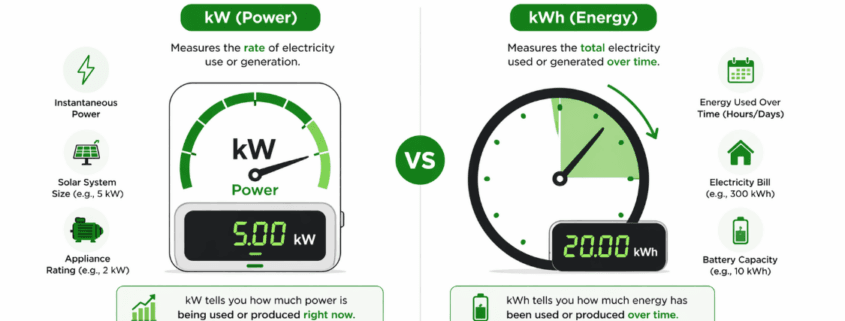
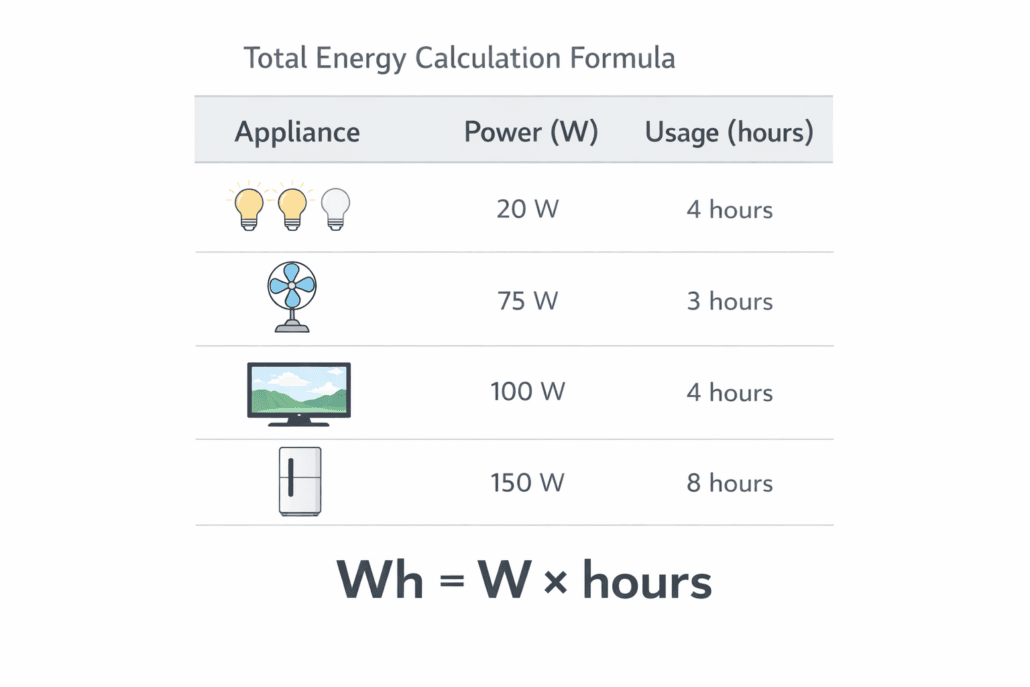
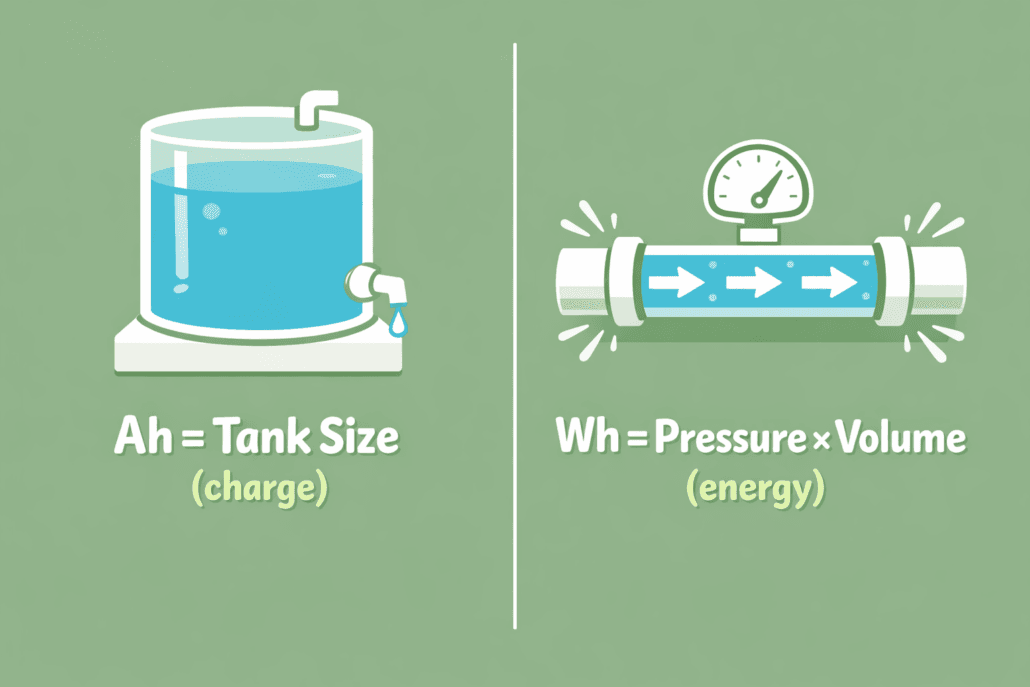
If you are confused about kWh vs kW explained, you are not alone. Many people mix up these terms. However, they measure different things.
In simple terms, kW (kilowatt) measures power. On the other hand, kWh (kilowatt-hour) measures energy over time. Therefore, understanding this difference is critical for solar and battery sizing.
🔍 kWh vs kW Explained: What Is kW (Kilowatt)?
kW measures how fast energy is used or produced. In other words, it is the rate of power.
For example:
A 1 kW heater uses 1 kilowatt of power
A 5 kW solar system produces 5 kilowatts at peak
Therefore, kW tells you instant power, not total energy.
🔋 kWh vs kW Explained: What Is kWh (Kilowatt-Hour)?
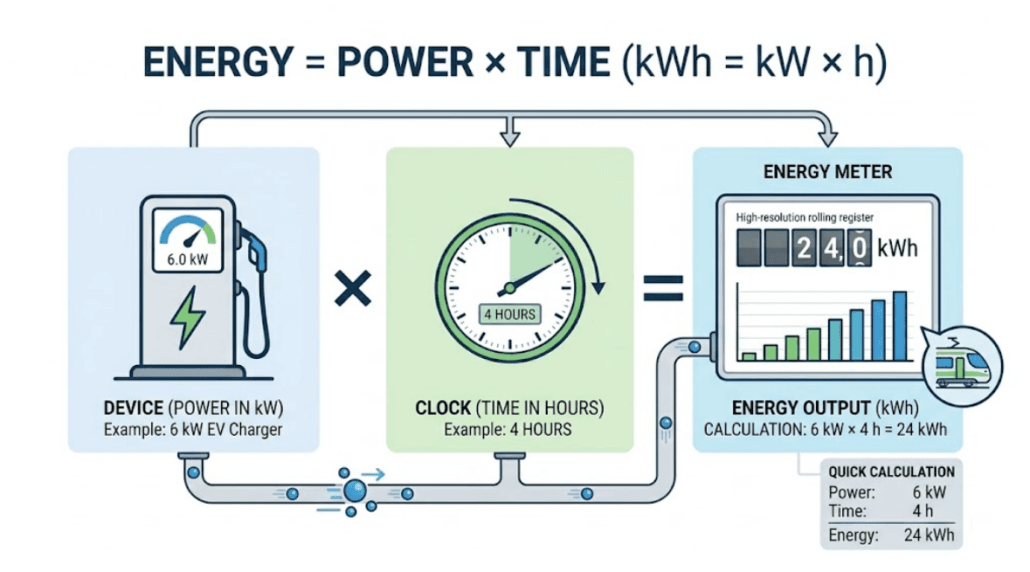
kWh measures total energy consumed over time. It combines power and duration.
Formula:
Energy (kWh) = Power (kW) × Time (hours)
Example:
1 kW device running for 5 hours = 5 kWh
2 kW AC running for 3 hours = 6 kWh
As a result, kWh tells you how much energy you actually use.
⚖️ kWh vs kW Explained: Key Difference
Metric
kW
kWh
Meaning
Power
Energy
Measures
Rate
Total usage
Example
5 kW system
20 kWh per day
Use Case
System size
Energy consumption
Therefore, kW is capacity, while kWh is consumption.
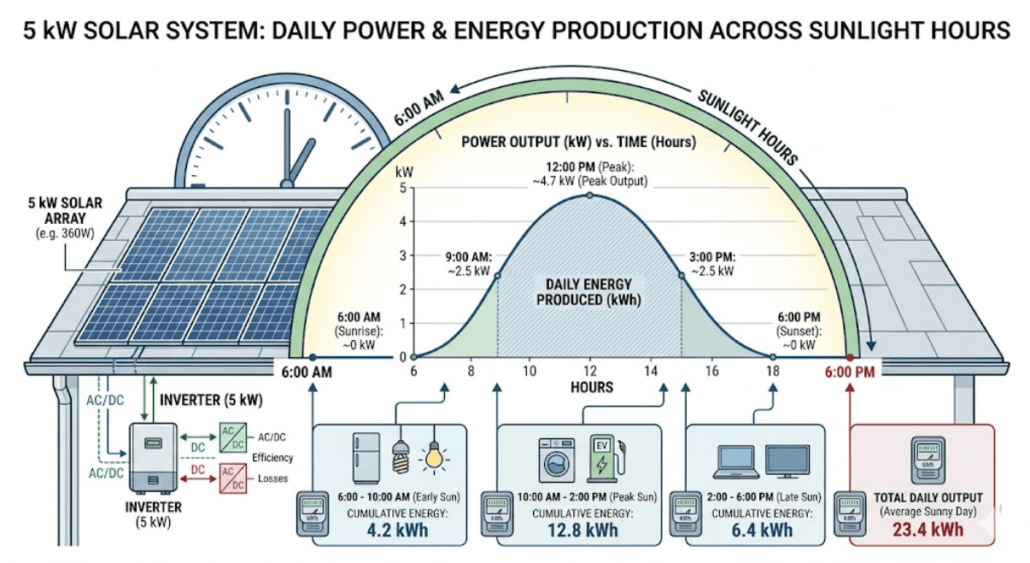
☀️ kWh vs kW Explained in Solar Systems
Solar systems use both values. However, they serve different purposes.
kW → Solar system size
kWh → Daily energy generation
For example:
A 5 kW system does not produce 5 kWh per day
It produces energy based on sunlight
👉Solar output depends on sunlight intensity. Therefore, understanding peak sun hours by location is essential for accurate energy calculations.
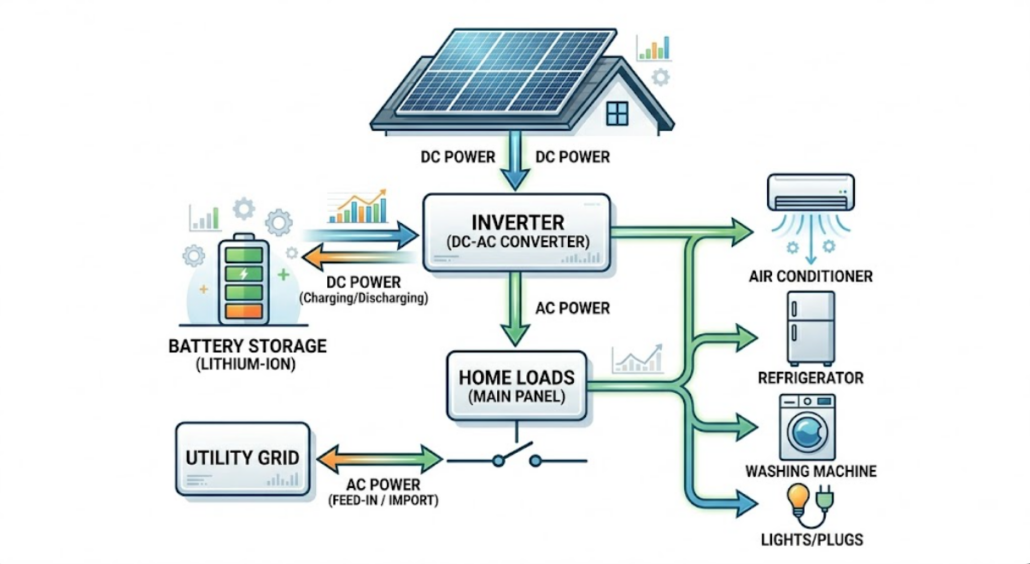
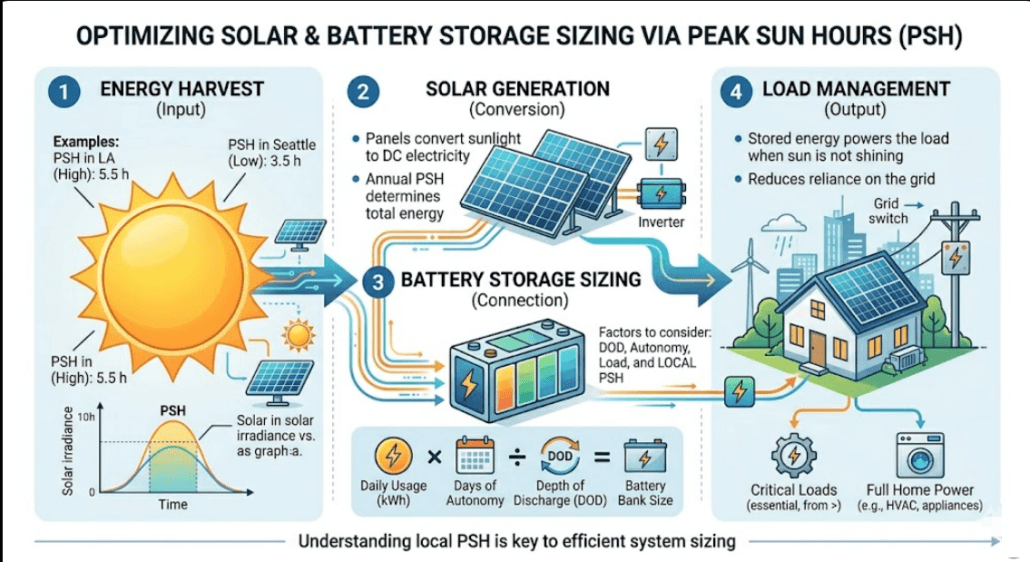
🔋 kWh vs kW Explained in Battery Storage
Battery systems are measured in kWh. This is because they store energy.
However, batteries also have a kW rating. This shows how fast they can deliver power.
👉 In addition, solar and battery systems must be sized together. You can follow this energy storage calculation guide to design a complete system.
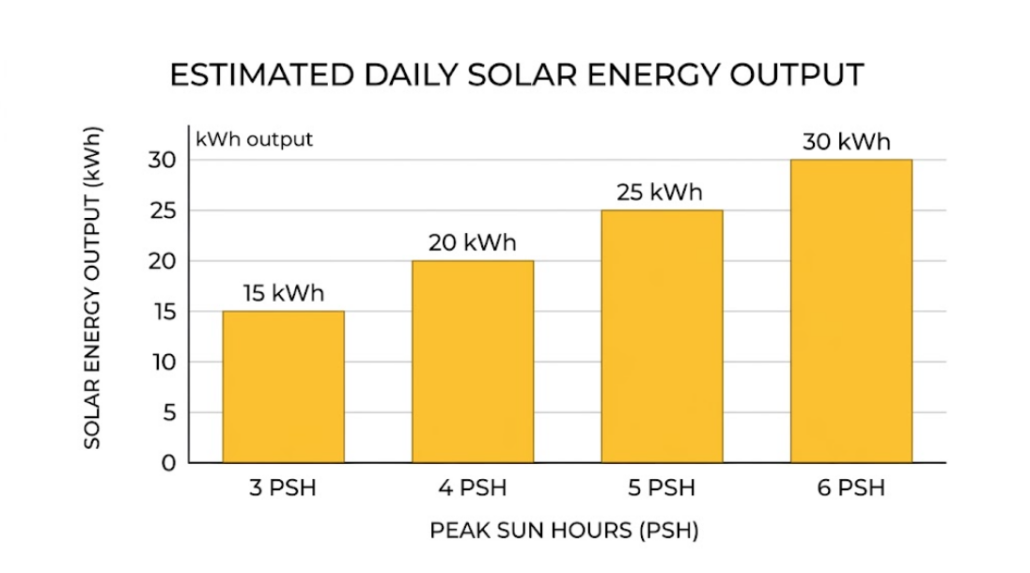
📉 kWh vs kW Explained with Real Example
Let’s break it down:
Solar system size = 6 kW
Peak sun hours = 5
Energy produced:
6 × 5 = 30 kWh per day
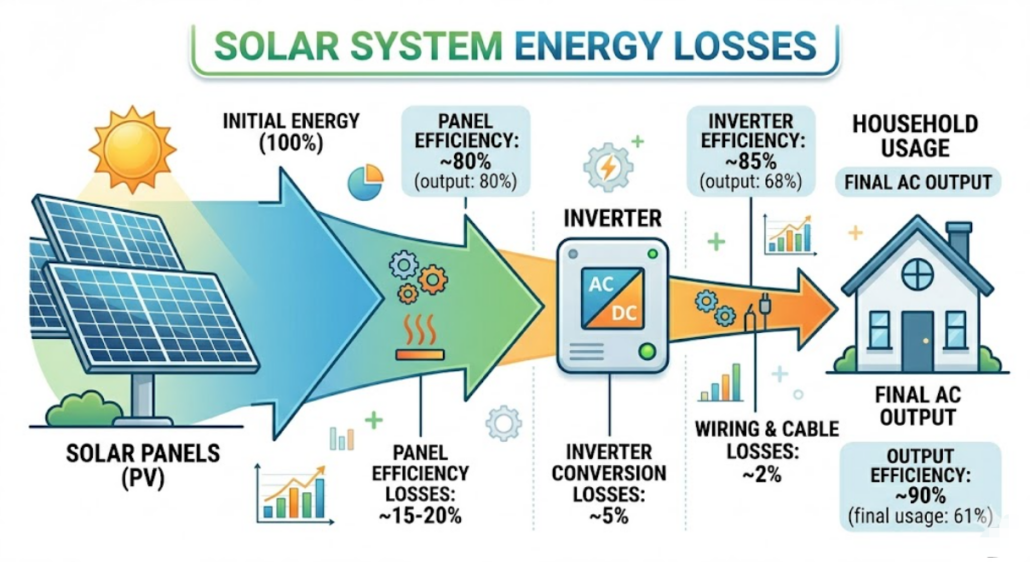
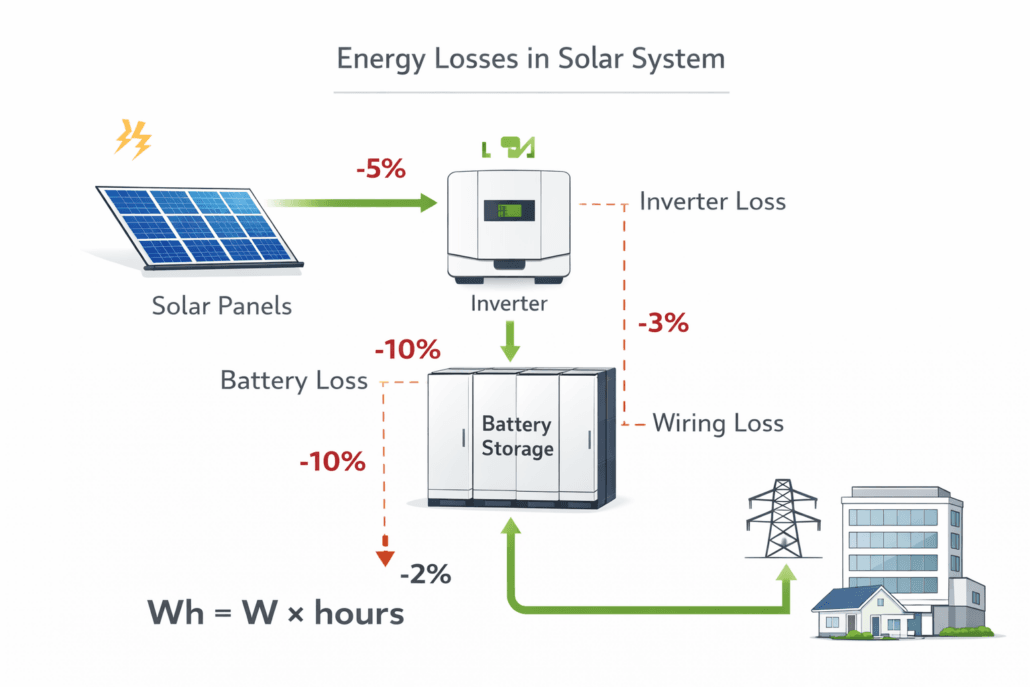
However, losses reduce output.
👉 However, actual energy output is lower due to inefficiencies. Learn more about energy storage system losses and their impact on system performance.
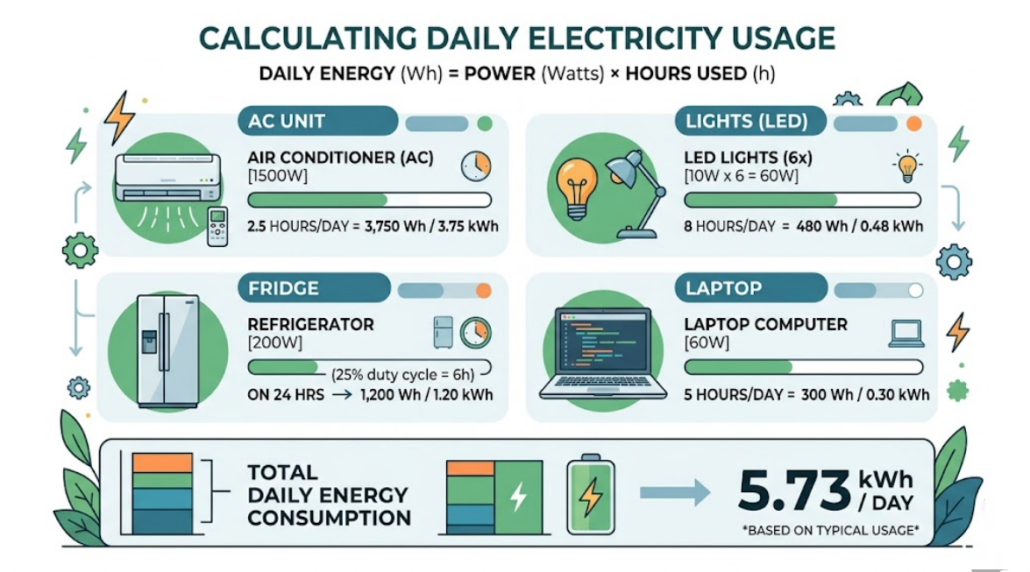
🧮 kWh vs kW Explained for Home Electricity Bills
Your electricity bill shows kWh. This is because utilities charge based on total energy used.
For example:
Monthly usage = 900 kWh
Daily usage ≈ 30 kWh
Therefore, kWh determines your cost.
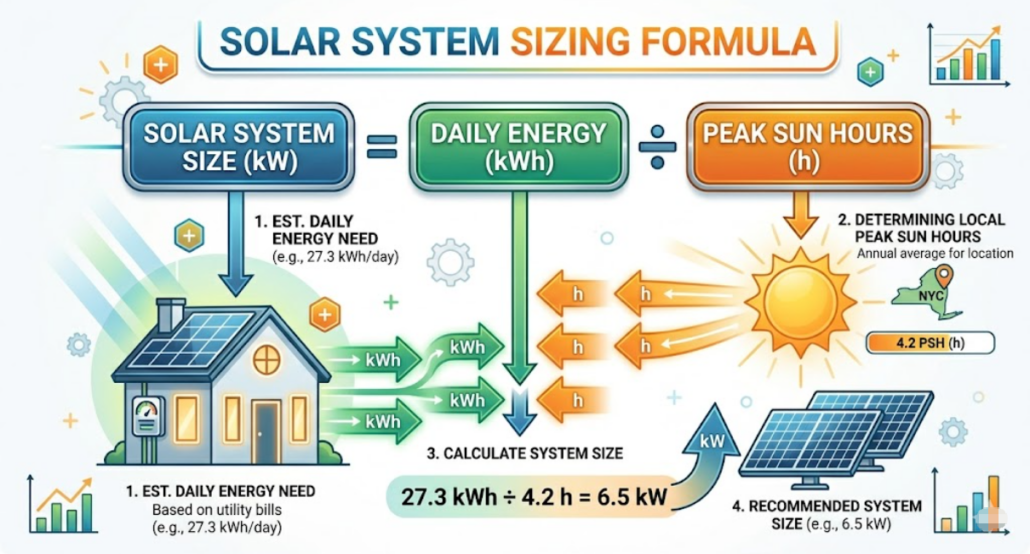
🔢 kWh vs kW Explained for Solar Panel Sizing
To size a solar system, you must convert kWh into kW.
Formula:
System Size (kW) = Daily Energy (kWh) ÷ Peak Sun Hours
⚠️ Common Mistakes in kWh vs kW Explained
Many users misunderstand these terms. As a result, they design incorrect systems.
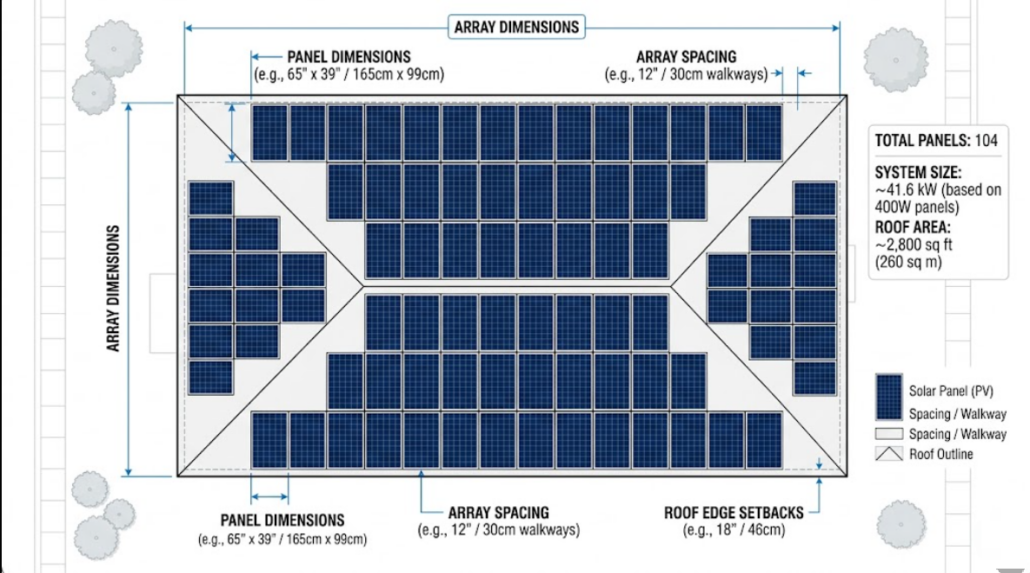
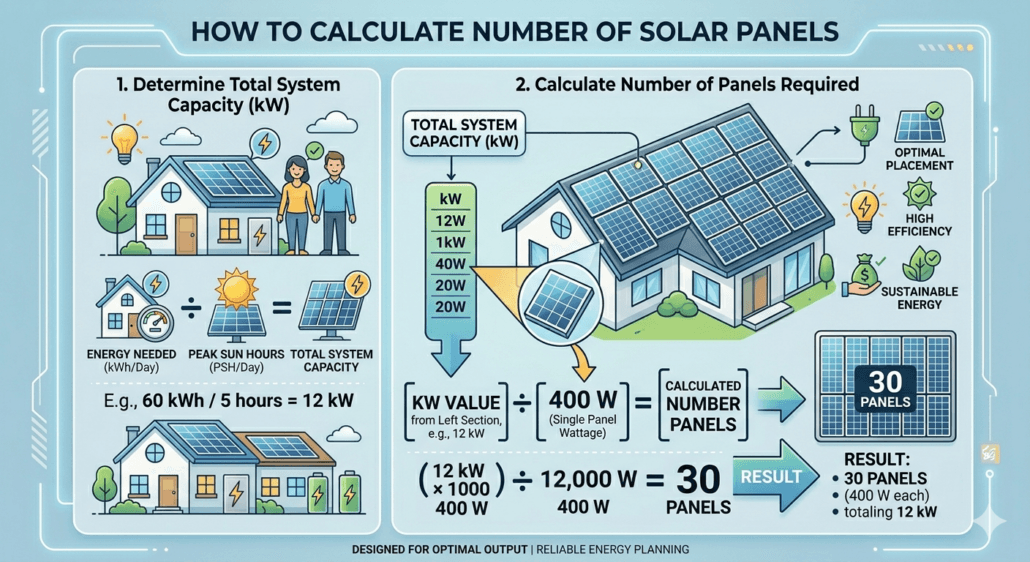
If you are asking how many solar panels do I need, the answer depends on your energy use, sunlight, and system efficiency. Therefore, you must calculate each factor correctly before choosing a system.
In this guide, you will learn simple formulas. In addition, you will see real examples. As a result, you can size your solar system with confidence.
🔍 How Many Solar Panels Do I Need Based on Energy Usage
First, calculate your daily electricity consumption. Without this step, your system will be inaccurate.
You can find this on your electricity bill. Then, divide monthly usage by 30.
Example:
Monthly usage = 900 kWh
Daily usage = 900 ÷ 30 = 30 kWh/day
Therefore, your system must generate 30 kWh per day.
☀️ How Many Solar Panels Do I Need Using Peak Sun Hours
Next, you must consider sunlight. Solar panels only produce full power during peak hours.
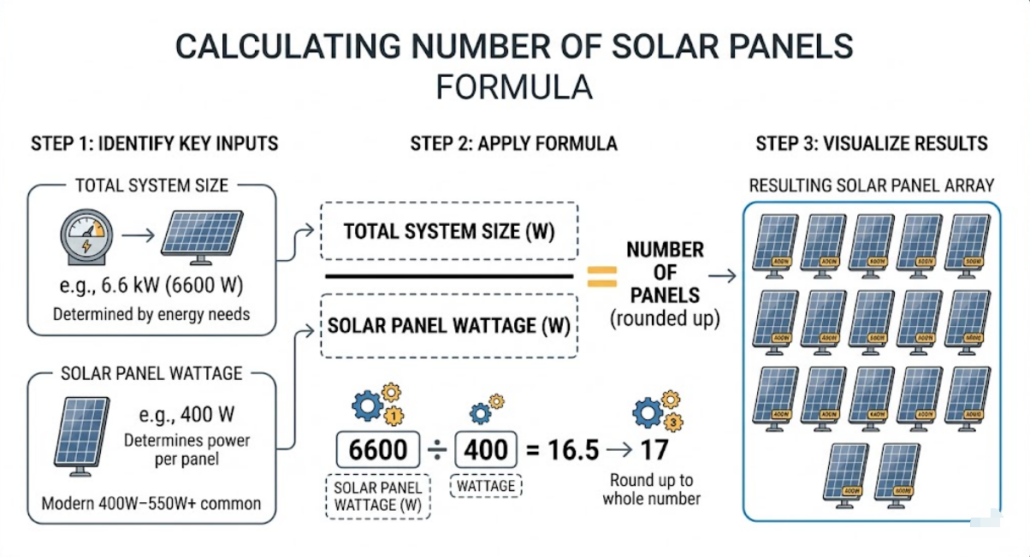
Note: For example, if your calculations show you need a 7.5 kW (7,500 Watts) system and you plan to buy standard 400W solar panels, the math is simple:
7,500 Watts ÷ 400W = 18.75
Rounding up to the nearest whole number ensures you meet your production targets, meaning you will need exactly 19 panels.
📊 How Many Solar Panels Do I Need (Quick Table)
Daily Energy Usage
Required System Size (kW)
Est. Number of 400W Panels
10 kWh / day
2.5 kW – 3.0 kW
8 – 10 Panels
20 kWh / day
5.0 kW – 6.0 kW
14 – 16 Panels
30 kWh / day
7.5 kW – 9.0 kW
18 – 22 Panels
40 kWh / day
10.0 kW – 12.0 kW
24 – 28 Panels
However, results vary by location.
🏠 How Many Solar Panels Do I Need for My Home Roof
Roof space is also important. In most cases, one panel needs about 2 m².
Each panel needs space.
For example:
400W panel ≈ 2 m²
20 panels ≈ 40 m²
Therefore, you must check available space before installation.
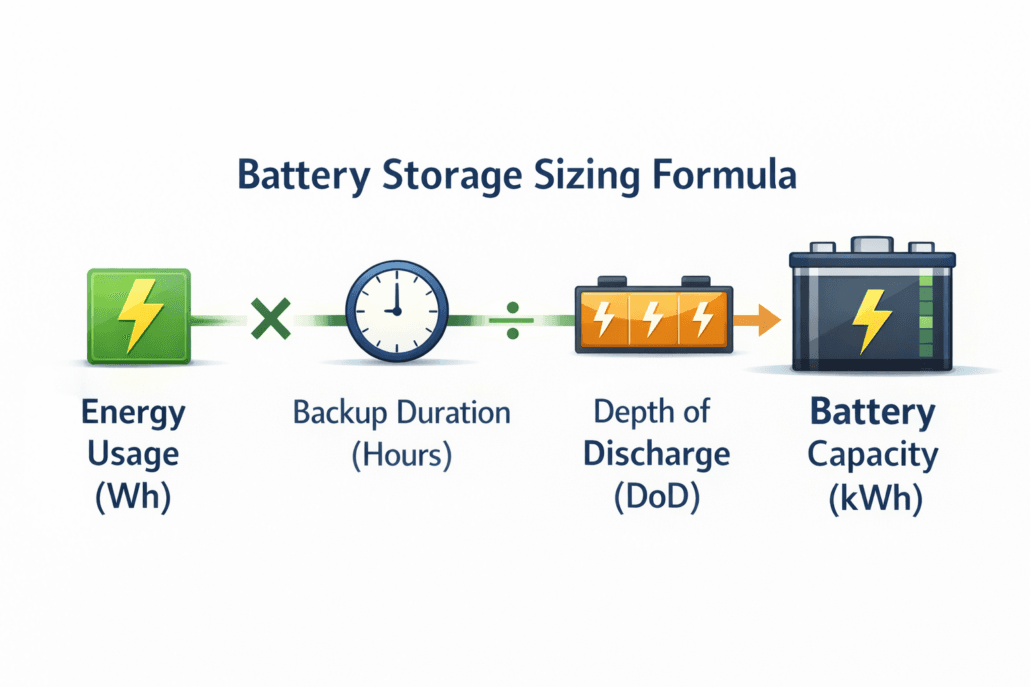
🔋 How Many Solar Panels Do I Need with Battery Storage
Solar panels generate energy, while batteries store it. Therefore, both systems must match.
👉 In addition, proper system design requires both solar and storage sizing. You can follow this Energy Storage Calculation Guide
In addition, battery size affects how much solar energy you can use at night.
❌ Common Mistakes When Calculating How Many Solar Panels You Need
Many users make simple mistakes. However, these can cause major system issues.
Ignoring peak sun hours
Not including losses
Using wrong panel wattage (Avoid confusing a panel's peak laboratory rating with its actual energy output by reviewing our kWp vs kWh in Solar Energy breakdown).
For global solar irradiance values, you can explore the Global Solar Atlas
❓ FAQs
How many solar panels do I need for 30 kWh per day?
To generate 30 kWh of electricity per day, you will typically need a 7.5 kW solar system, which translates to roughly 19 to 22 solar panels (assuming standard 400W panels and an average of 4.5 to 5 peak sun hours per day).
How many solar panels do I need for a house?
Most homes need 15–30 panels. However, usage varies.
How many solar panels do I need with batteries?
You may need more panels because storage systems add losses.
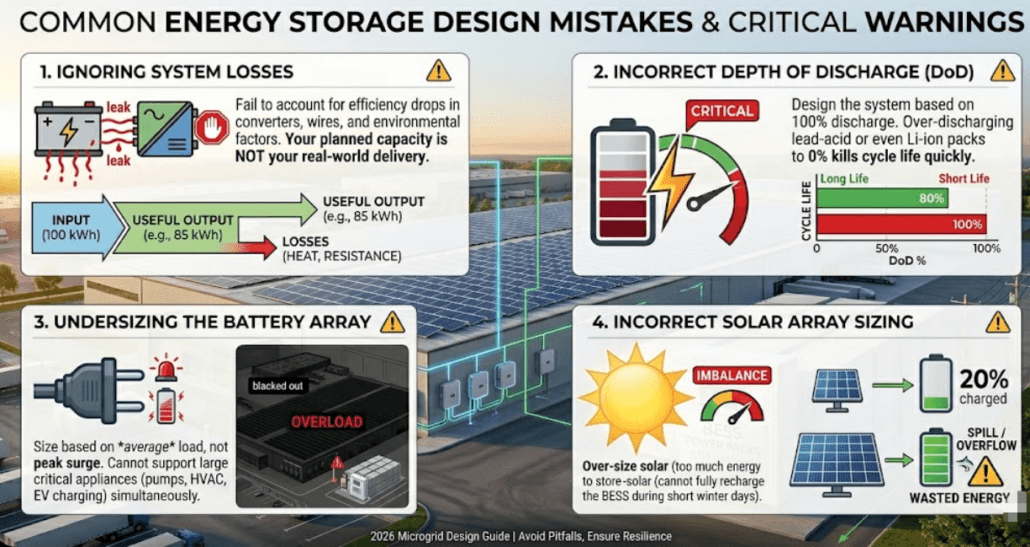
⚡ Quick Answer: BESS Supplier BMS Evaluation in Brief In any BESS supplier BMS evaluation, ask for cell-level monitoring, SOC algorithm type, balancing current, fault response speed, SOH logging, certifications, and full test reports. A quality supplier answers all seven without hesitation. Vague answers, missing test data, or refusal to name the SOC algorithm are the clearest red flags.
A thorough BESS supplier BMS evaluation is one of the most important steps in any energy storage procurement. Most buyers spend hours comparing cell chemistry, capacity, and cycle life. Then they spend five minutes on the BMS. That gap is where expensive mistakes happen.
The battery management system determines whether a BESS is safe and whether its cells reach their rated life. Yet BMS quality is hard to verify from a spec sheet. Many suppliers use the same headline numbers — regardless of whether the implementation delivers those claims.
This guide gives you a practical BESS supplier BMS evaluation framework. Specifically, it covers the questions to ask, the documentation to request, and the red flags that reveal when a BMS falls short.
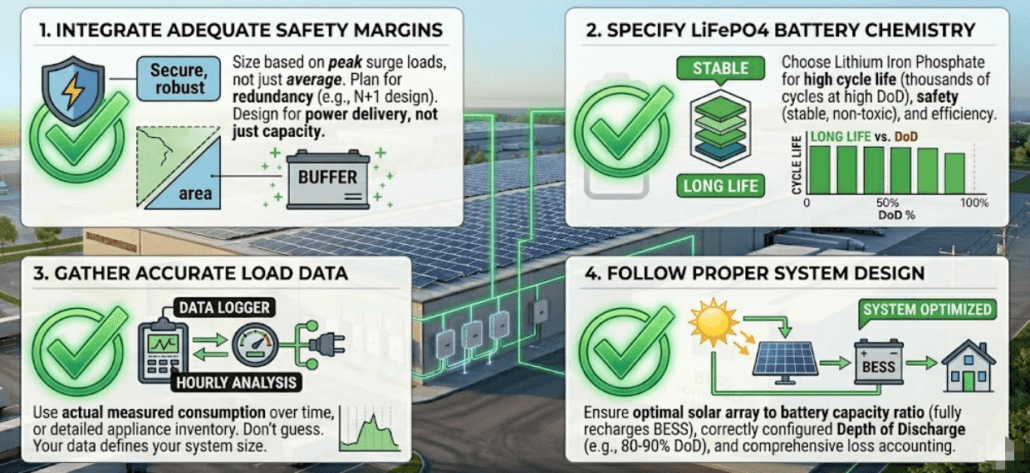
1. Why BESS Supplier BMS Evaluation Matters More Than Most Buyers Realise
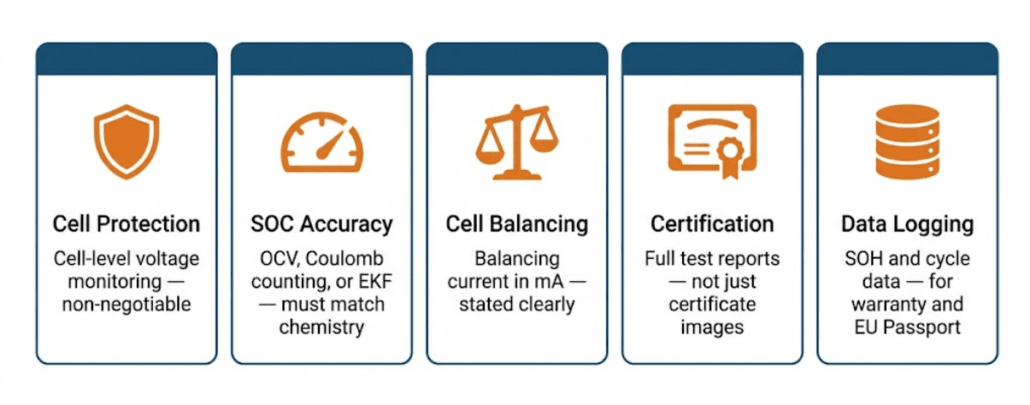
A thorough BESS supplier BMS evaluation covers five areas: SOC accuracy, protection, balancing, certification, and data logging
The BMS is the hardest BESS component to evaluate from a spec sheet. Cells have measurable characteristics — capacity, internal resistance, cycle life. A BMS spec sheet, in contrast, often contains claims that are hard to verify without test data.
Consider two BMS platforms with identical spec sheets. Both claim 6,000-cycle compatibility, active balancing, and EKF SOC. One uses a properly calibrated EKF with cell-level monitoring. The other uses Coulomb counting relabelled as EKF and pack-level monitoring relabelled as cell-level.
In the field, the first system protects cells correctly and reaches its rated cycle life. The second degrades faster, shows erratic SOC readings, and fails early. Both had identical spec sheets.
Consequently, a structured BESS supplier BMS evaluation is the only way to tell them apart. Asking the right questions and requesting the right documentation must happen before you sign.
2. The Seven Questions Every BESS Supplier BMS Evaluation Must Include
These seven questions form the core of any BESS supplier BMS evaluation. Specifically, a credible supplier answers all of them without hesitation. Vague or evasive answers are red flags.
Question 1: Is Monitoring at Cell Level or Pack Level?
Cell-level monitoring tracks every individual cell voltage. Pack-level monitoring, however, tracks only the total pack voltage. These are fundamentally different levels of protection.
In a 16-cell LFP pack, one weak cell can hit its 2.5V limit while the pack reads 49V. A BMS monitoring only pack voltage misses this. As a result, the weak cell gets damaged and the pack degrades faster.
Cell-level monitoring is non-negotiable. Ask specifically: does the BMS monitor each individual cell voltage — or only the total pack? Pack-level only is an immediate disqualifier. For more on why, see our BMS guide.
Question 2: Which SOC Algorithm Is Used — and Is It Calibrated for This Chemistry?
SOC estimation is where most generic BMS platforms fall short on LFP. OCV-based SOC on LFP is unreliable during operation. Coulomb counting is the minimum standard. EKF is the most accurate option for systems above 200 kWh.
Ask two sub-questions. First: which method — OCV, Coulomb counting, EKF, or hybrid? Second: was the cell model calibrated for the specific cells in this system? An EKF with a mismatched model is often less accurate than well-implemented Coulomb counting.
Question 3: What Is the Balancing Current and Method?
Ask whether balancing is passive or active, and what the current is in milliamps. Residential systems under 30 kWh need 100 mA passive balancing. Commercial systems above 200 kWh need 200 mA or more. Active balancing is preferred above 500 kWh.
Indeed, a supplier who cannot state the balancing current either uses a low-quality BMS or does not know their product. Both are red flags.
Question 4: How Fast Does the BMS Respond to Faults?
Short circuit protection must activate in microseconds. This uses hardware circuits, not software. Thermal runaway protection must disconnect in under 100ms. Ask specifically for fault response times in the spec document.
A vague answer such as “the BMS has overcharge protection” is not enough. Response time is what matters. Slow fault response on NMC especially can mean the difference between a contained event and a fire.
Question 5: What Communication Protocols Does the BMS Support?
Confirm the BMS works with your specific inverter and EMS before signing. CAN bus and Modbus RTU are the most common protocols. Ask for a compatibility list showing which inverter models have been tested.
A protocol mismatch needs a gateway converter — adding cost, a failure point, and communication lag. Discovering this after delivery is also expensive and causes project delays.
Question 6: Does the BMS Log SOH and Cycle Data — and for How Long?
SOH logging is essential for warranty claims. Most BESS warranties guarantee a minimum SOH at a set cycle count. Without accurate SOH records, therefore, any warranty dispute becomes very hard to resolve in your favour.
Furthermore, from February 2027, EU Battery Passport compliance requires SOH history, cycle count, and energy throughput data. A BMS without adequate logging creates regulatory risk. For more on these requirements, see our EU 2023/1542 compliance guide.
Question 7: Which Certifications Does the BMS Hold — and Can You Provide Full Test Reports?
UL 1973, IEC 62619, and IEC 62933-5 are the key certifications for a BESS BMS. Always ask for full test reports — not just a certificate image. A certificate shows testing was done. A test report, however, shows what was tested, under what conditions, and what the results were.
If a supplier provides only a certificate image and cannot produce the full report, that is a serious red flag. Reputable suppliers keep test reports on hand.
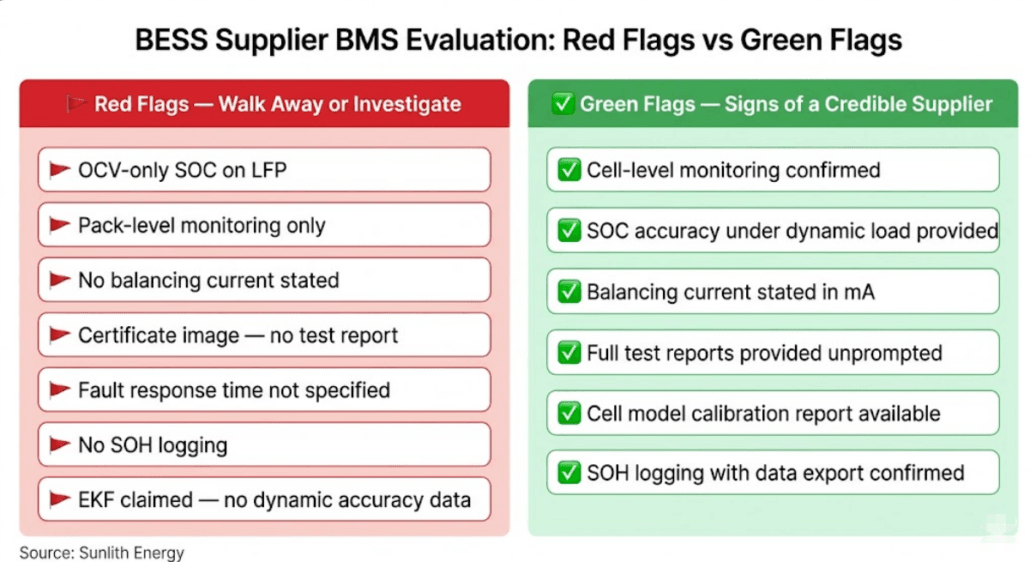
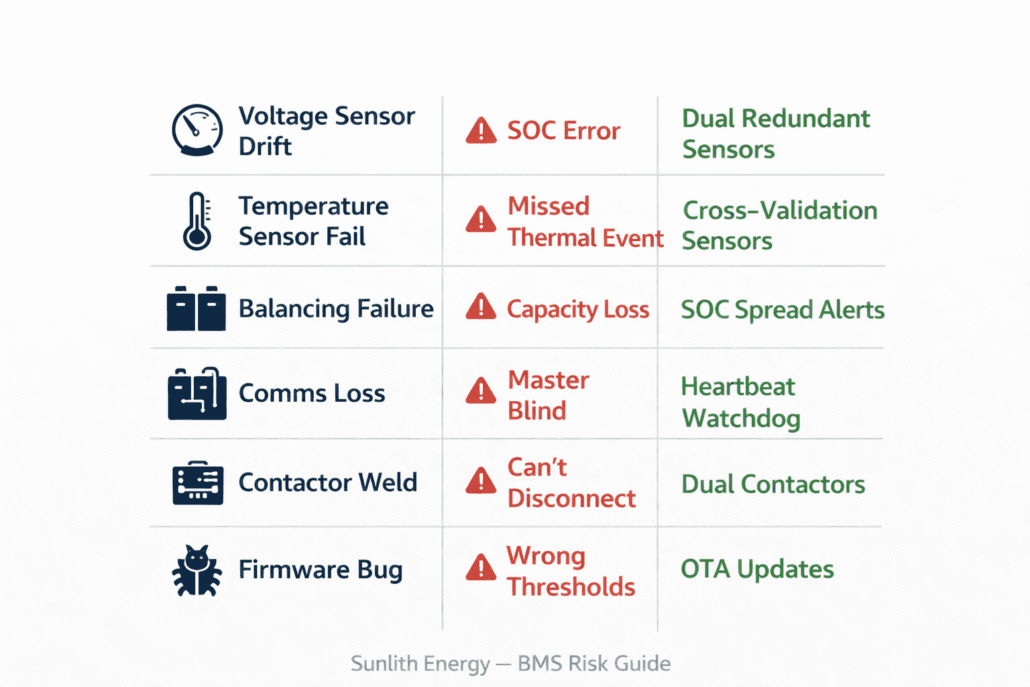
3. BESS Supplier BMS Evaluation: Red Flags and Green Flags
Red flags and green flags in a BESS supplier BMS evaluation — what credible suppliers provide versus what evasive suppliers avoid
Red Flags: Signs a BMS Falls Short
Red Flag
What It Means
What to Do
🚩 OCV-only SOC on LFP
SOC will be inaccurate — erratic readings, wrong shutdowns
Require Coulomb counting or EKF with LFP-calibrated model
🚩 Pack-level voltage monitoring only
Cannot detect weak cell — will miss over-discharge events
Require cell-level individual voltage monitoring as standard
🚩 Cannot state balancing current
Low-quality BMS or supplier unfamiliar with their product
Request balancing current in mA from the spec sheet
🚩 No test report — certificate image only
Cannot verify what was actually tested or under what conditions
Require full test report from the certification body
🚩 Fault response time not specified
Cannot confirm short circuit or thermal protection speed
Require fault response time in ms in the spec document
🚩 No SOH logging capability
Cannot support warranty claims or EU Battery Passport compliance
Require SOH logging with timestamped cycle data
🚩 EKF claimed but no dynamic SOC accuracy data
May be Coulomb counting relabelled — not genuine EKF
Require SOC accuracy spec under dynamic load, not just at rest
Green Flags: Signs of a Credible Supplier
Green Flag
What It Means
What to Do
✅ Cell-level voltage monitoring confirmed
Weak cells will be detected and protected before damage occurs
Verify in test report
✅ SOC accuracy data under dynamic load provided
Genuine EKF or well-calibrated Coulomb counting
Cross-check against your application’s cycle profile
✅ Balancing current stated in spec sheet
Supplier understands their product and is transparent
Verify adequacy for your system size
✅ Full certification test reports provided
BMS has been genuinely tested under fault conditions
Check test temperature and conditions match your application
✅ Cell model calibration confirmed for specific cells
SOC estimation is tuned for actual cells in the system
Request calibration test report as evidence
✅ SOH logging with data export capability
Warranty claims and EU Battery Passport compliance are supported
Confirm export format and data retention period
4. Documentation to Request in a BESS Supplier BMS Evaluation
Questions reveal what a supplier claims. Documentation, however, reveals what they can prove. Request these six documents during any BESS supplier BMS evaluation — before signing.
BMS Technical Specification Sheet
Specifically, the spec sheet should state: cell voltage monitoring level, voltage accuracy in mV, SOC algorithm type, balancing current in mA, fault response times in ms, and communication protocols.
If any parameter is missing, ask for it in writing. A supplier who cannot provide this data does not have it — and that reveals something important about BMS quality.
Certification Test Reports
Request full test reports for UL 1973, IEC 62619, and IEC 62933-5. These reports specify the test conditions — temperature, voltage range, C-rate, and fault scenarios. They also show pass/fail results for each test item.
Pay attention to the test temperature. A BMS certified at 25°C may behave differently at 45°C in an outdoor enclosure. Ask whether certification was done at your actual operating temperature.
SOC Accuracy Test Data
Ask for SOC accuracy data under dynamic load — not resting accuracy. Specifically, the test should show SOC error during charge and discharge at varying C-rates and temperatures. Genuine EKF achieves ±1–2% under these conditions. If the supplier only has resting data, the SOC method is likely OCV-based.
Cell Model Calibration Report
If the supplier claims EKF, ask for the cell model calibration report. This confirms the EKF model was built and validated for the specific cells in the system. A generic EKF model, calibrated for different cells, will underperform.
Firmware Version and Update Policy
Ask for the current BMS firmware version and update policy. Ask whether OTA updates are supported and whether cell model updates can be deployed remotely. For 10–15 year systems, OTA capability is valuable — it keeps SOC accuracy high as cells age.
Field Reference List
Also ask for a reference list of installed systems using the same BMS platform. A few direct conversations with reference customers reveals real-world BMS performance that no spec sheet captures.
5. BESS Supplier BMS Evaluation by System Size
The depth of BESS supplier BMS evaluation needed scales with system size. Specifically, a 10 kWh residential install carries different risk than a 5 MWh commercial project. This section provides a tiered evaluation framework.
Residential BESS — Under 30 kWh
Residential systems have simpler BMS requirements. Key items to verify are cell-level voltage monitoring, a 0°C charge inhibit, and IEC 62619 certification. Coulomb counting SOC with OCV resets is the minimum SOC standard.
Passive balancing at 50–100 mA is adequate at this scale. SOH logging is also good practice — however, it is less critical for warranty purposes. The main risk is a BMS that allows over-discharge or cold-temperature charging. Both cause permanent cell damage.
Commercial BESS — 30 kWh to 1 MWh
Commercial systems need all seven questions from Section 2 addressed. SOC accuracy matters more at this scale. Dispatch contracts and self-consumption both depend on knowing available energy. EKF is therefore preferred above 200 kWh.
SOH logging becomes important at this scale for warranty compliance. Communication protocol compatibility with the site’s EMS is also critical — confirm this before delivery, not after.
Utility-Scale BESS — 1 MWh and Above
At utility scale, every aspect of the BESS supplier BMS evaluation matters. EKF is strongly recommended. A 5% SOC error on a 10 MWh system means 500 kWh of uncertainty. That directly affects revenue from grid services contracts.
Additionally, require master-slave architecture documentation, slave module independence verification, and a data logging spec that meets EU Battery Passport requirements for EU market systems.
6. How to Interpret Supplier Answers in a BESS Supplier BMS Evaluation
Knowing how to interpret supplier answers is as important as knowing which questions to ask. These, therefore, are the most common responses in a BESS supplier BMS evaluation — and what they actually mean.
Supplier Answer
What It Likely Means
Follow-up Required
“Our BMS has cell-level monitoring”
Could be cell-level or pack-level — the term is used loosely
Ask: how many voltage sensors are in a 16-cell module?
“We use advanced SOC algorithms”
Could mean anything — likely Coulomb counting marketed as advanced
Ask: specifically OCV, Coulomb counting, or EKF?
“Our BMS is EKF-based”
May be genuine EKF or may be lookup table relabelled
Ask: what is the SOC accuracy under dynamic load?
“We have all the certifications”
Certifications may be for cells only, not the full BMS system
Ask: UL 1973 or IEC 62619 specifically for the BMS?
“Our BMS has active balancing”
Active balancing design varies widely in quality and current
Ask: what is the balancing current in mA or A?
Provides full test report without being asked
Supplier is confident in their product and transparent
Green flag — review test conditions carefully
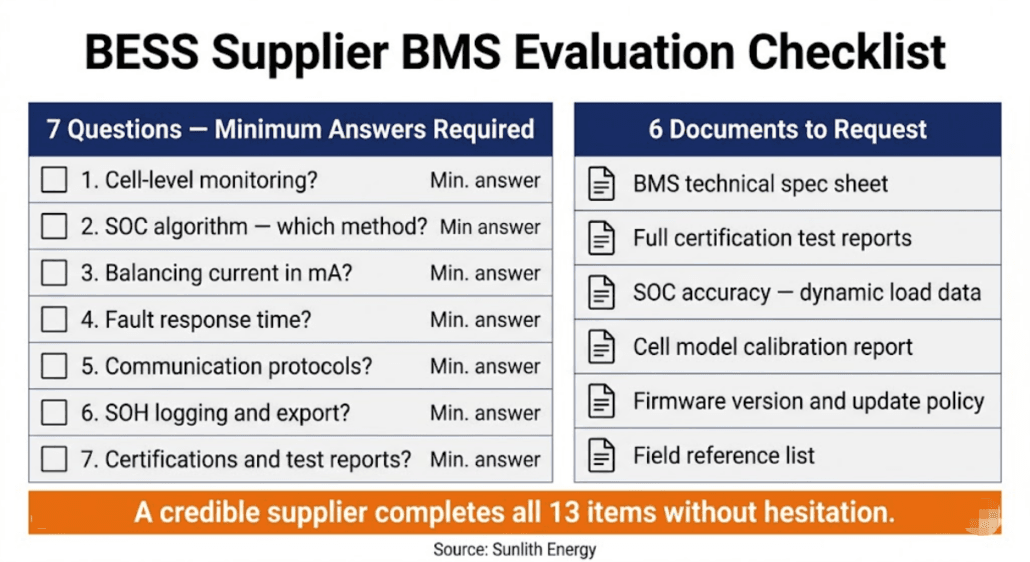
7. The BESS Supplier BMS Evaluation Checklist
BESS supplier BMS evaluation checklist — seven questions and six documents to request before signing a purchase order
Use this checklist when evaluating any BESS supplier’s BMS. A credible supplier completes all items. Any item left blank or answered vaguely is a prompt for further investigation.
Seven Questions — Minimum Answers Required
Q1: Cell-level or pack-level voltage monitoring?
Required answer: cell-level individual voltage monitoring, confirmed in the spec sheet.
Q2: SOC algorithm — OCV, Coulomb counting, EKF, or hybrid?
Required answer: Coulomb counting minimum. EKF preferred above 200 kWh. Cell model calibration confirmed for specific cells.
Q3: Balancing method and current in mA?
Required answer: specific mA value stated. 100 mA+ for residential. 200 mA+ for commercial. Active balancing for 500 kWh+.
Q4: Fault response time for short circuit and thermal events?
Required answer: short circuit response in microseconds. Thermal disconnect under 100ms confirmed.
Q5: Communication protocols and inverter compatibility?
Required answer: specific protocols stated. Compatibility with your inverter confirmed.
Q6: SOH logging — what data, how long, and what export format?
Required answer: SOH, cycle count, energy throughput logged. Retention period stated. Export format confirmed.
Q7: Certifications held and full test reports available?
Required answer: UL 1973 and/or IEC 62619 confirmed. Full test reports available on request.
Six Documents to Request
BMS technical specification sheet — with all parameters listed above
Full certification test reports — UL 1973, IEC 62619, IEC 62933-5
SOC accuracy test data — under dynamic load at relevant temperatures
Cell model calibration report — confirming EKF is tuned for specific cells
Firmware version and update policy — including OTA capability if applicable
Field reference list — installed systems at comparable scale using the same BMS platform
8. What a Strong BESS Supplier BMS Evaluation Response Looks Like
To give context to the checklist, here is what a strong, credible supplier response looks like for each key question. Use this as a benchmark when comparing suppliers side by side.
✅ Example 1. Strong Response — Cell Monitoring “Our BMS monitors each individual cell voltage using dedicated ADC channels — one per cell. In a 16-cell module, there are 16 independent voltage measurements sampled every 500ms. Cell-level monitoring is confirmed in our IEC 62619 test report, which we can provide.”
✅ Example 2. Strong Response — SOC Algorithm “We use an Extended Kalman Filter combined with Coulomb counting. The EKF cell model was calibrated for the EVE LF280K cells used in this system, at 15°C, 25°C, and 45°C. SOC accuracy is ±1.8% under 0.5C dynamic load. We can provide the calibration test report and the dynamic load accuracy data.”
🚩 Example 3. Red Flag Response — SOC Algorithm “Our BMS uses advanced intelligent SOC estimation technology that provides highly accurate state of charge monitoring in real time.” — No algorithm type named. No accuracy figure given. No test data offered. This is marketing language, not a technical answer. Follow up with the specific sub-questions from Section 2 immediately.
Conclusion: Make BESS Supplier BMS Evaluation a Standard Step
A BESS supplier BMS evaluation is not a technical exercise reserved for engineers. It is a procurement discipline that any buyer can apply with the right questions and the right checklist.
The seven questions and six documents in Section 7 take less than an hour to work through. That hour protects against BMS failures that cost far more to fix in the field.
The clearest signal of a credible supplier is transparency. Credible suppliers answer the seven questions clearly and provide full test reports without hesitation. Evasive or vague answers, in contrast, are the most reliable red flag in any BESS supplier BMS evaluation.
☀️ Need Help with Your BESS Supplier BMS Evaluation? Sunlith Energy reviews BMS specifications and supplier documentation for BESS projects from 50 kWh upward. We apply this checklist on your behalf — identifying gaps in protection architecture, SOC accuracy, and certification compliance before you commit. Contact us
Frequently Asked Questions About BESS Supplier BMS Evaluation
What is the most important question in a BESS supplier BMS evaluation?
Cell-level voltage monitoring is the most important single question. A BMS that monitors only pack voltage cannot protect individual cells from over-discharge or overcharge. This failure mode causes faster degradation across the entire pack. Every other BMS feature is secondary to getting this protection right.
How do I know if a supplier is using genuine EKF or just claiming it?
Ask for SOC accuracy data under dynamic load — not resting accuracy. Genuine EKF achieves ±1–2% during active charge and discharge. If the supplier gives only resting data, the SOC method is likely Coulomb counting or OCV. Also ask for the cell model calibration report.
What certifications should a BESS BMS hold?
For most commercial BESS, UL 1973 and IEC 62619 are the primary certifications to require. IEC 62933-5 covers the ESS safety framework and is relevant for grid-connected systems. For EU market access after 2027, the BMS must also support the EU Digital Battery Passport data requirements. Always ask for full test reports.
Can I evaluate a BESS supplier’s BMS without technical expertise?
Yes. These questions require no engineering background. The answers either contain the information required — algorithm type, balancing current, fault response time — or they do not. A credible supplier gives specific answers. An evasive supplier gives vague, non-specific ones. That distinction is clear without technical expertise.
What happens if I skip the BESS supplier BMS evaluation?
The risks are real and specific. A BMS without cell-level monitoring allows weak cells to be over-discharged, accelerating degradation. Poor SOC estimation causes unnecessary shutdowns and wasted capacity. Missing SOH logging makes warranty disputes nearly impossible to win. For a 10-year BESS project, these failures compound significantly over time.
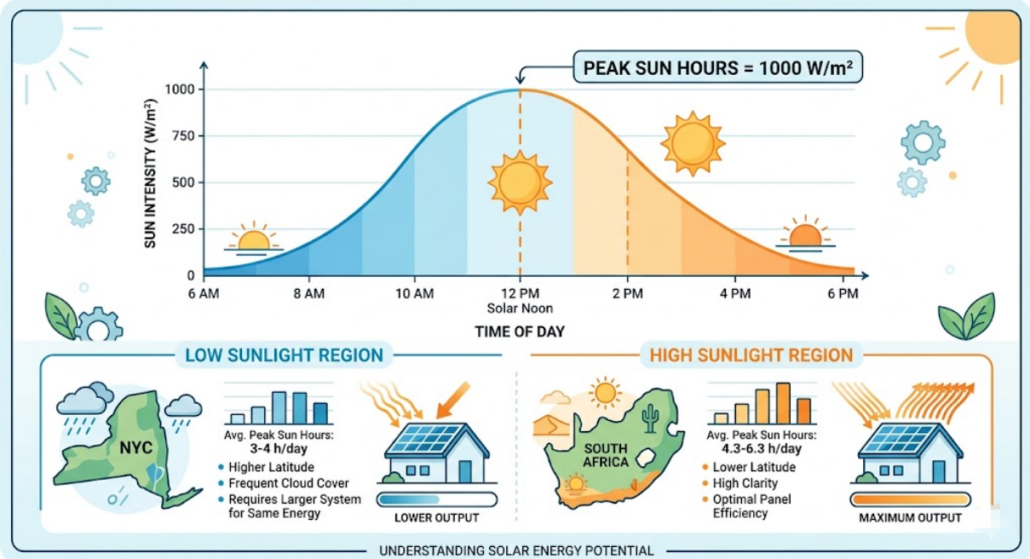
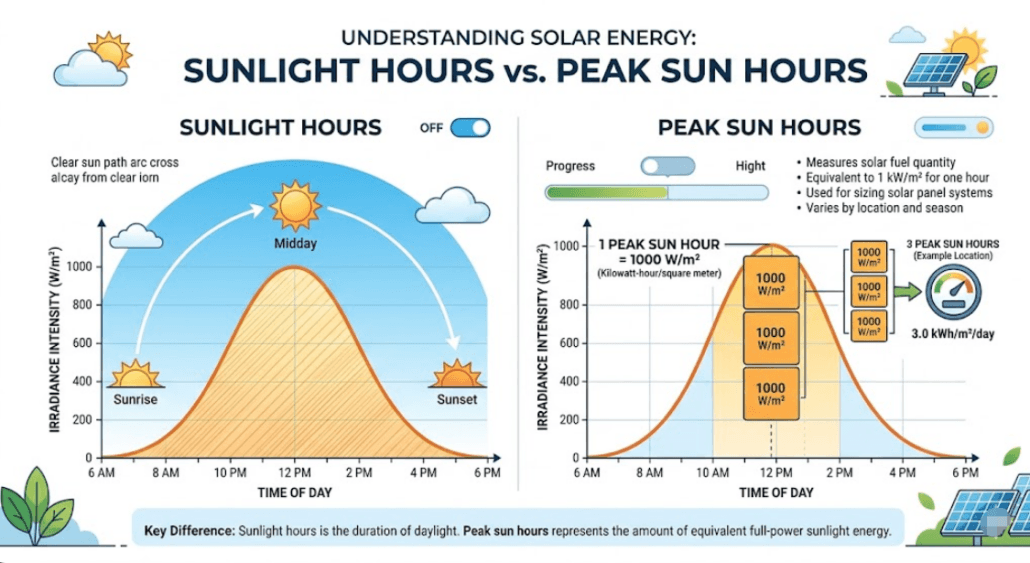
Peak sun hours show how much usable sunlight a location gets in one day. In simple terms, they convert changing sunlight into full-power hours.
Therefore, this value helps you estimate solar energy output. For example, a region may receive sunlight all day, but only a part of that counts as full energy. To capture every bit of this potential, pairing local irradiance data with the correct solar panel tilt angle by location is critical.
As a result, most locations get about 3 to 6 effective hours.
📊 Why Peak Sun Hours by Location Matter
Peak sun hours directly affect solar system design. However, many systems still use average values.
Because of this, systems often underperform. Therefore, using location-based values is critical.
Solar exposure also changes worldwide. In addition, climate plays a major role.
Region
Sunlight (hrs/day)
North India
4 – 5
South India
5 – 6
Middle East
6 – 7
Europe
2.5 – 4
Australia
5 – 6
🌏 Search Global Peak Sun Hours
Location / Region
Average Peak Sun Hours (hrs/day)
Rajasthan
5.5 – 6.5 ✨
Gujarat
5.2 – 6.0 ✨
Madhya Pradesh
5.0 – 5.8
Maharashtra
4.5 – 5.5
Andhra Pradesh & Telangana
4.8 – 5.5
Karnataka
4.5 – 5.3
Tamil Nadu
4.5 – 5.2
Uttar Pradesh
4.0 – 5.0
Queensland (QLD)
5.5 – 6.5 ✨
Northern Territory (NT)
6.0 – 6.8 ✨
Western Australia (WA)
5.0 – 6.2
New South Wales (NSW)
4.5 – 5.5
South Australia (SA)
4.5 – 5.8
Victoria (VIC)
3.5 – 4.2
Saudi Arabia (Riyadh/Desert)
6.0 – 7.0 ✨
United Arab Emirates (UAE)
5.8 – 6.4 ✨
Oman
5.5 – 6.3
Qatar
5.5 – 6.2
Kuwait
5.2 – 6.0
Jordan
5.0 – 5.8
Spain (Southern/Andalusia)
4.5 – 5.5 ✨
Italy (Sicily/South)
4.0 – 5.0
Greece
4.2 – 5.0
France (Southern Coast)
3.5 – 4.2
Germany (Central/South)
2.8 – 3.5
United Kingdom (UK)
2.0 – 2.8
As a result, systems must always match local conditions.
👉 You can also explore global solar irradiance data from the Global Solar Atlas
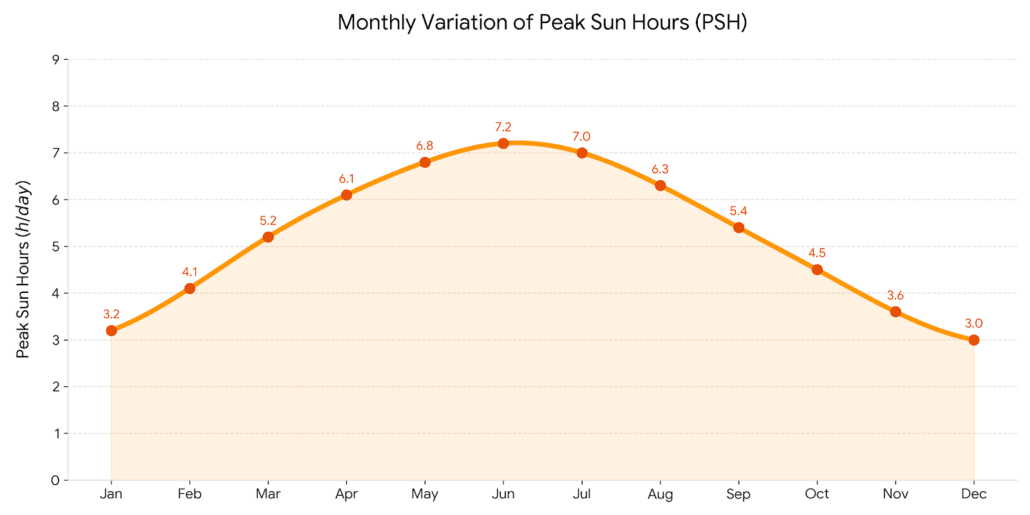
🌦️ Seasonal Peak Sun Hours by Location
Peak sun hours change during the year. Therefore, seasonal variation is important.
Example:
Summer → higher output
Winter → lower output
For instance, New York drops from 5 to about 3 hours. Similarly, California drops from 6.5 to about 4 hours.
As a result, solar production falls in winter.
⚠️ Why Seasonal Design Is Important
If systems use yearly averages, they may fail in winter. Therefore, engineers plan for the worst case.
In other words, they use the lowest sunlight value of the year. Because of this, systems stay reliable.
🧠 Peak Sun Hours Design Rule
Always size systems using the lowest sunlight period.
Therefore, even during cloudy or winter days, the system will still work. As a result, energy supply stays stable.
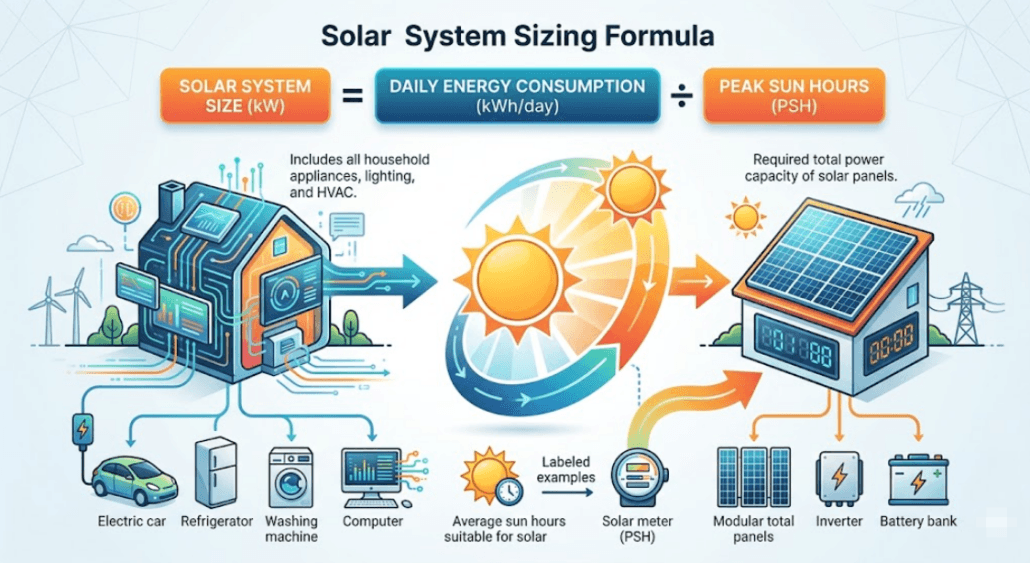
⚡ Solar Sizing Using Peak Sun Hours
Solar system size depends on energy use and sunlight. Therefore, both must be calculated.
Formula:
Solar Size (kW) = Daily Load ÷ Sunlight Hours
(Note: When sizing a system, it is crucial to understand how your raw panel capacity translates into actual daily and annual energy generation. Read our comprehensive kWp vs kWh Solar Guide to see exactly how these metrics work together).
Example:
Load = 10 kWh
Sunlight = 3 hours
System size = 3.3 kW
However, this is not the final value.
⚡ Test Your Own System Sizing
Input your energy requirements below to calculate your system capacity instantly.
Base Estimated Size: 3.33 kW
Recommended Size (with 20% loss margin): 4.00 kW
🔄 Adjust for System Losses
Solar systems lose energy. Therefore, you must add a safety margin.
Systems are often oversized. This helps handle low sunlight days.
Typical Increase:
Residential: 20–30%
Commercial: 25–40%
Because of this, systems perform better in winter.
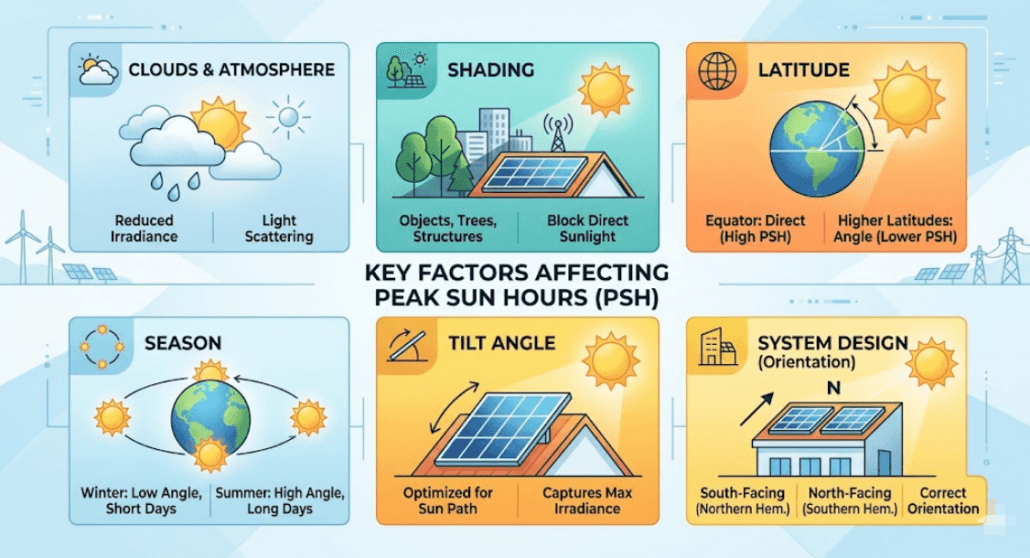
🌡️ Factors Affecting Peak Sun Hours by Location
Peak sun hours depend on several factors. Therefore, you must consider:
Location
Weather
Season
Panel angle
Temperature
In addition, pollution and shading can reduce output.
⚠️ Common Mistakes
Many systems fail due to simple errors.
Avoid these:
Using average values
Ignoring seasonal changes
Designing only for summer
Skipping loss calculations
Confusing peak system capacity with actual energy generation (Make sure you can easily distinguish between them by checking out our guide on kWp vs kWh in Solar Energy)
As a result, your system will perform more reliably.
📊 Quick Reference Table
Condition
Action
High sunlight
Smaller system
Low sunlight
Larger system
Winter design
Use minimum value
Critical systems
Add margin
❓ FAQ
What are peak sun hours?
They measure usable sunlight for solar power generation.
How many hours do most locations get?
Most regions get 3 to 6 hours daily.
Why do values change?
They change due to location, weather, and season.
Should I use average values?
No. Instead, use minimum values for better reliability.
🧾 Conclusion
Peak sun hours vary by location and season. Therefore, accurate data is essential.
By using correct values, you can:
Improve system design
Increase reliability
Optimize solar output
Ensure proper battery charging
As a result, your solar system will work efficiently all year.
⚡ Quick Answer: Which BMS SOC Estimation Method Is Best? For LiFePO4 systems, Coulomb counting with OCV resets is the minimum standard. The Extended Kalman Filter (EKF) is the most accurate option — particularly for LFP’s flat voltage curve. OCV lookup alone is unreliable for LFP during operation. For NMC, OCV lookup is more viable but still benefits from Coulomb counting in real-time use. EKF suits any system where SOC accuracy directly affects revenue, safety, or EU Battery Passport compliance.
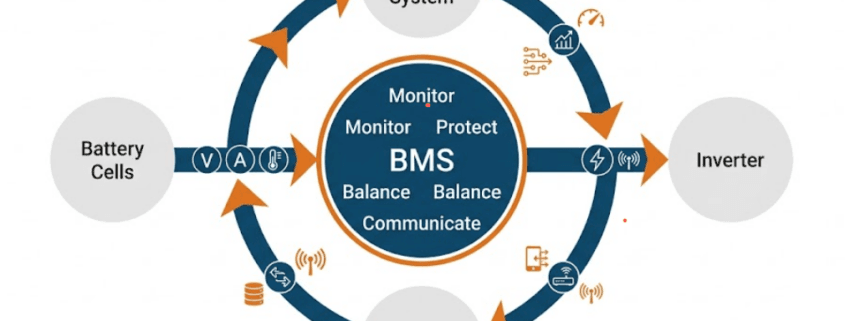
BMS SOC Estimation: State of Charge (SOC) is the most important number a battery management system produces. It is the fuel gauge of your BESS. Every dispatch decision, every protection threshold, and every warranty calculation depends on it being accurate.
Yet SOC cannot be measured directly. It must be estimated from voltage, current, and temperature data. The method used for BMS SOC estimation determines how accurate the reading is, how quickly it drifts, and how well it handles different conditions.
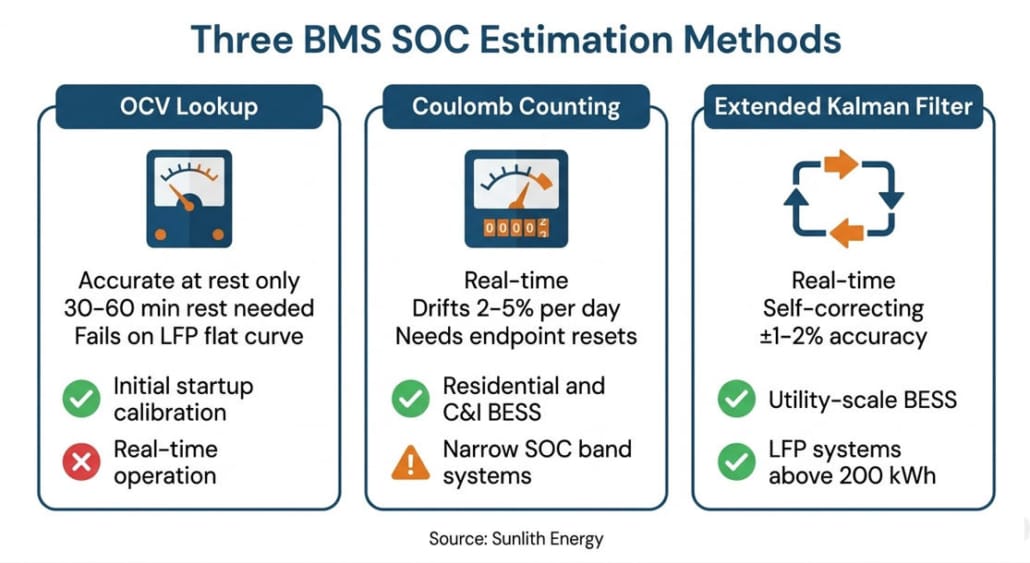
There are three main BMS SOC estimation methods: OCV lookup, Coulomb counting, and the Extended Kalman Filter (EKF). Each works differently and suits different chemistries. Choosing the wrong method is one of the most common and costly BMS mistakes in BESS procurement.
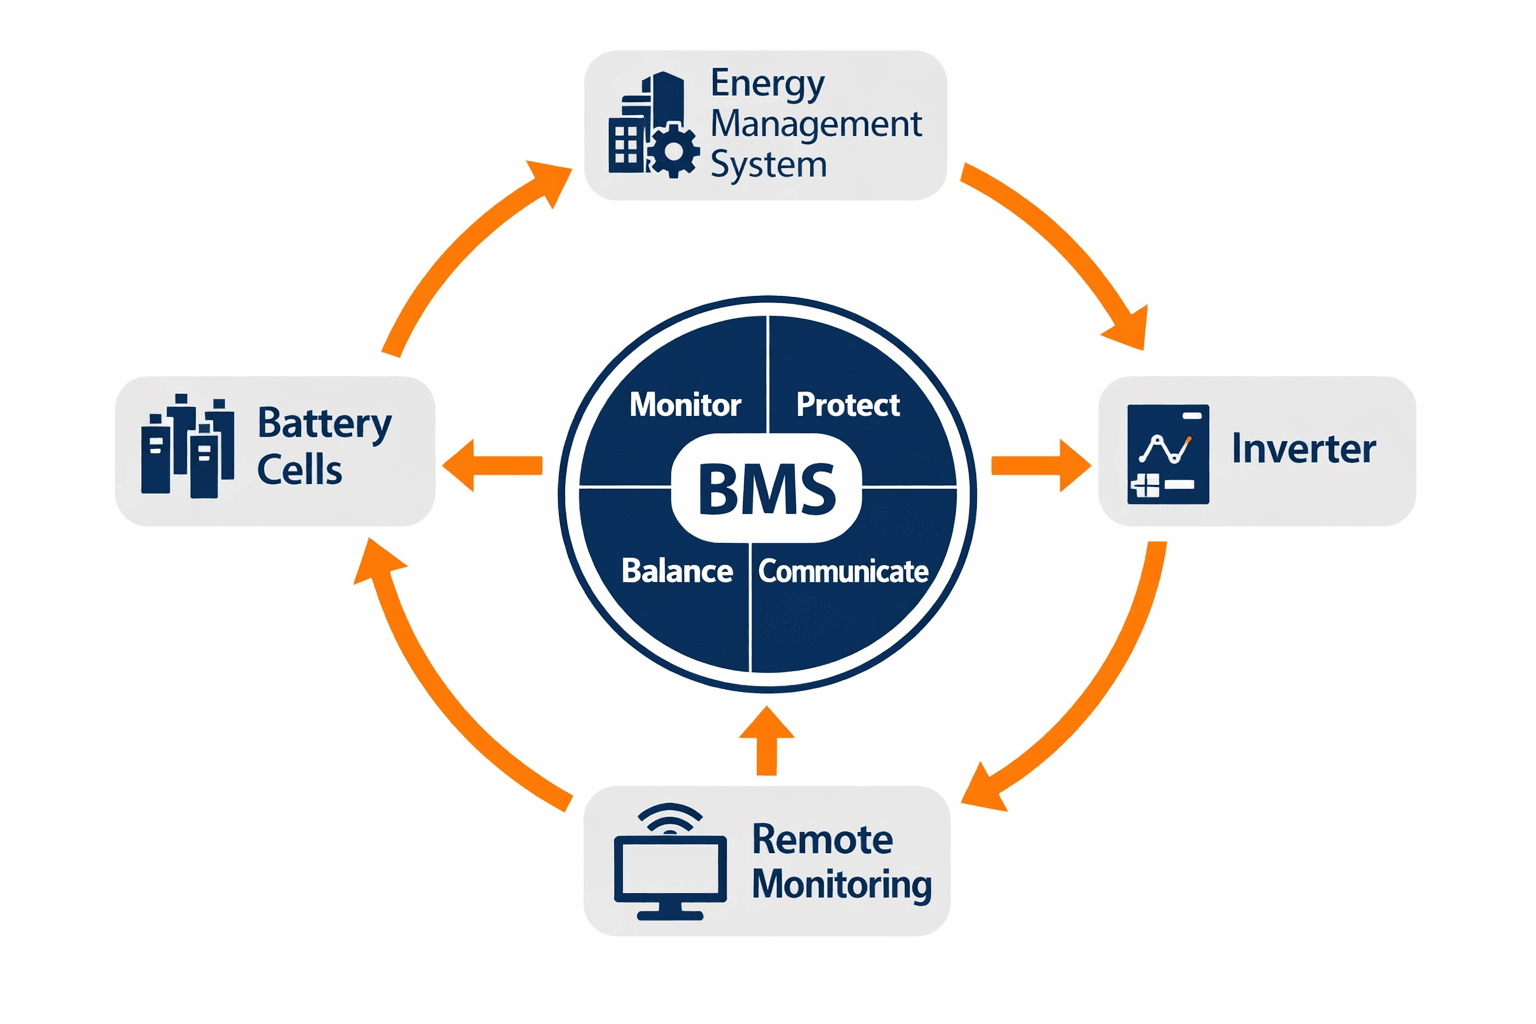
This guide explains how each BMS SOC estimation method works, where it succeeds, and where it fails. For the full context on how SOC fits into everything the BMS does, read our complete battery management system guide first.
1. Why BMS SOC Estimation Is Harder Than It Looks
The three main BMS SOC estimation methods each work differently and suit different battery chemistries and applications
SOC tells you what percentage of a battery’s full capacity is currently stored. A battery at 100% SOC is fully charged. At 0% SOC it is empty. In theory this sounds simple. In practice it is one of the hardest measurements in battery engineering.
The difficulty comes from two factors. First, SOC is an internal state — there is no sensor that reads it directly. Second, the relationship between measurable quantities and SOC changes with temperature, aging, load rate, and cell chemistry. As a result, every BMS SOC estimation method is an approximation.
The consequences of poor SOC accuracy are serious. An overestimate means the battery appears fuller than it is — causing unexpected shutdowns. An underestimate wastes usable capacity through early cutoff. In grid-connected systems, inaccurate SOC directly affects dispatch revenue and contract compliance.
Furthermore, from February 2027, the EU Battery Passport requires accurate SOC and SOH history logging. A BMS with poor SOC estimation will produce unreliable passport data. For more on the passport requirements, see our EU 2023/1542 compliance guide.
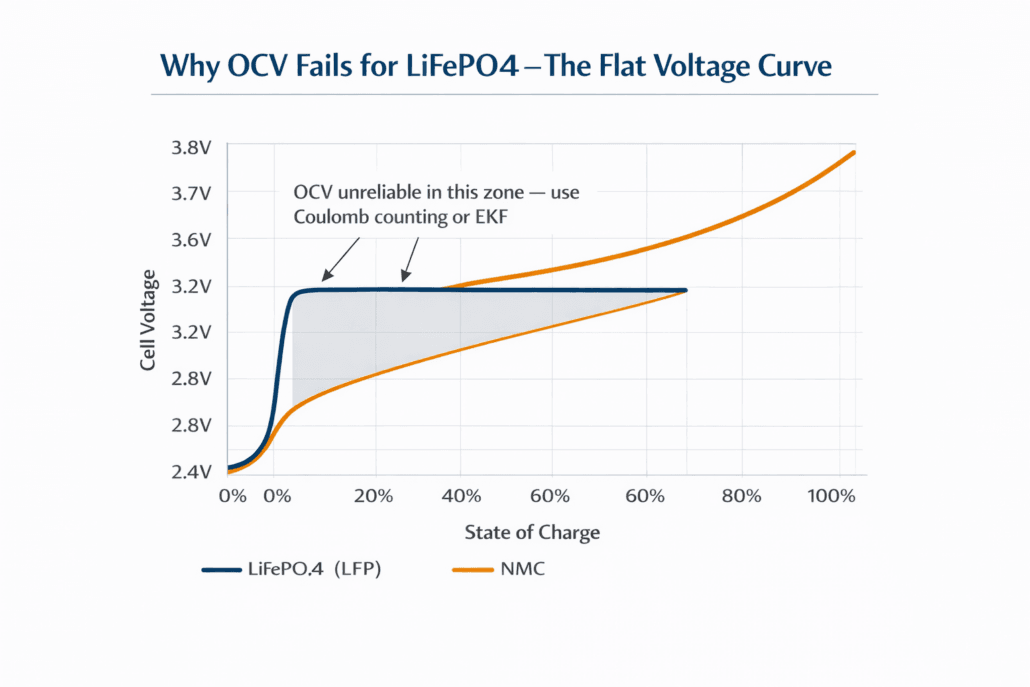
2. Method 1: Open Circuit Voltage (OCV) BMS SOC Estimation
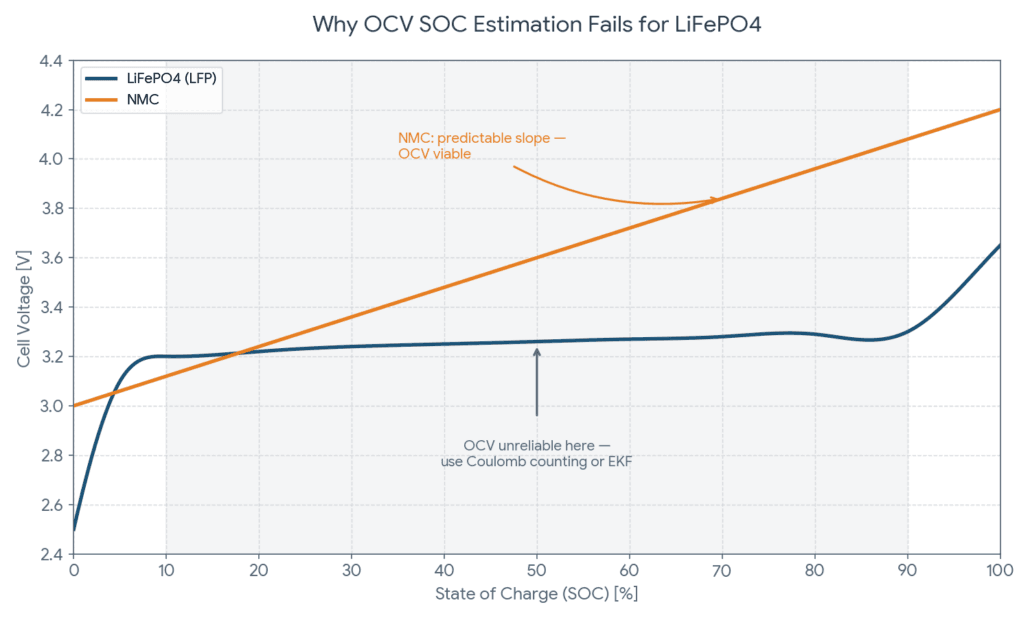
OCV SOC estimation works well for NMC but fails for LFP because of the flat voltage curve between 20% and 80% SOC
OCV lookup is the simplest BMS SOC estimation method. When a battery has rested with no current flowing, its terminal voltage settles to its Open Circuit Voltage. This OCV value maps to a specific SOC via a pre-built lookup table derived from cell tests.
The method is straightforward and requires no current sensor. It is also highly accurate — but only under the right conditions.
When OCV SOC Estimation Works
OCV is reliable when the battery has truly rested. A 30–60 minute rest lets the voltage fully settle after any charge or discharge event. During this rest, the BMS reads the terminal voltage and looks up the corresponding SOC value.
This makes OCV most useful for setting the initial SOC at startup. After a BESS has been idle overnight, an OCV reading at power-on gives an accurate starting point. Furthermore, OCV works well as a periodic recalibration anchor — resetting Coulomb counting drift when the battery reaches a known full or empty state.
Why OCV SOC Estimation Fails for LiFePO4
LFP is the dominant chemistry for solar storage and BESS. Unfortunately, it is also the worst candidate for real-time OCV SOC estimation. The reason is LFP’s flat voltage curve.
LFP cells sit near 3.2V–3.3V across roughly 80% of their usable SOC range — from about 10% to 90% SOC. A cell at 30% SOC and a cell at 70% SOC look almost identical on OCV. The BMS cannot distinguish between them during operation.
Consequently, an OCV-based BMS on LFP shows SOC readings that jump erratically. The estimates are only accurate near the very top and bottom of the charge range. In the flat middle region — where the battery operates most of the time — OCV is essentially useless for real-time SOC tracking.
OCV SOC Estimation for NMC
NMC has a more sloped voltage curve. Its voltage drops more steadily and predictably from around 4.2V fully charged to 3.0V at empty. This makes OCV-based SOC estimation more viable for NMC than for LFP.
However, even for NMC, OCV alone is not sufficient for real-time SOC tracking during active charge and discharge. The cell voltage under load differs from OCV due to internal resistance effects. As a result, most NMC BMS platforms combine OCV with Coulomb counting rather than relying on OCV alone.
3. Method 2: Coulomb Counting in BMS SOC Estimation
Coulomb counting is the most widely used BMS SOC estimation method in real-time operation. It tracks the net charge flowing in and out of the battery and uses that to update the SOC estimate continuously.
The name comes from the coulomb — the unit of electric charge. Counting coulombs in and out gives a running tally of how full the battery is.
How Coulomb Counting BMS SOC Estimation Works
The BMS measures current using a shunt resistor or Hall-effect sensor. It samples current at regular intervals — typically every 100ms to 1 second. It calculates the charge added or removed in each interval, then updates the SOC accordingly.
If the battery starts at 80% SOC and 10 Ah of charge is removed from a 100 Ah pack, the BMS calculates the new SOC as 70%. The arithmetic is simple. The challenge is keeping it accurate over time.
Coulomb Counting Accuracy and Drift
Coulomb counting is accurate over short periods. Over longer periods, however, it drifts. Several factors cause this drift:
Current sensor error — a small measurement offset accumulates with each sample. A 1% sensor error builds up steadily over hundreds of cycles
Temperature effects — battery capacity changes with temperature. A cell at 0°C holds less charge than at 25°C. The same Coulomb count means different SOC at different temperatures
Self-discharge — batteries lose a small amount of charge over time even with no load. The BMS current sensor does not measure this internal loss
Coulombic efficiency — not all charge put into a battery comes back out. The BMS must account for this charge efficiency factor to avoid overestimating SOC on each cycle
Over several days without recalibration, Coulomb counting drift typically reaches 2–5%. In some systems it reaches 10% or more — particularly if the sensor quality is low or the efficiency model is poorly set up.
Resetting Coulomb Counting Drift in BMS SOC Estimation
The fix for Coulomb counting drift is periodic recalibration using known anchor points. When the battery reaches full charge, the BMS resets SOC to 100%. When it reaches the discharge cutoff, the BMS resets SOC to 0%.
These anchor points are highly reliable. Any accumulated error is corrected at each full cycle. Systems that rarely reach full charge or full discharge — such as those staying in a partial SOC band — need additional recalibration strategies.
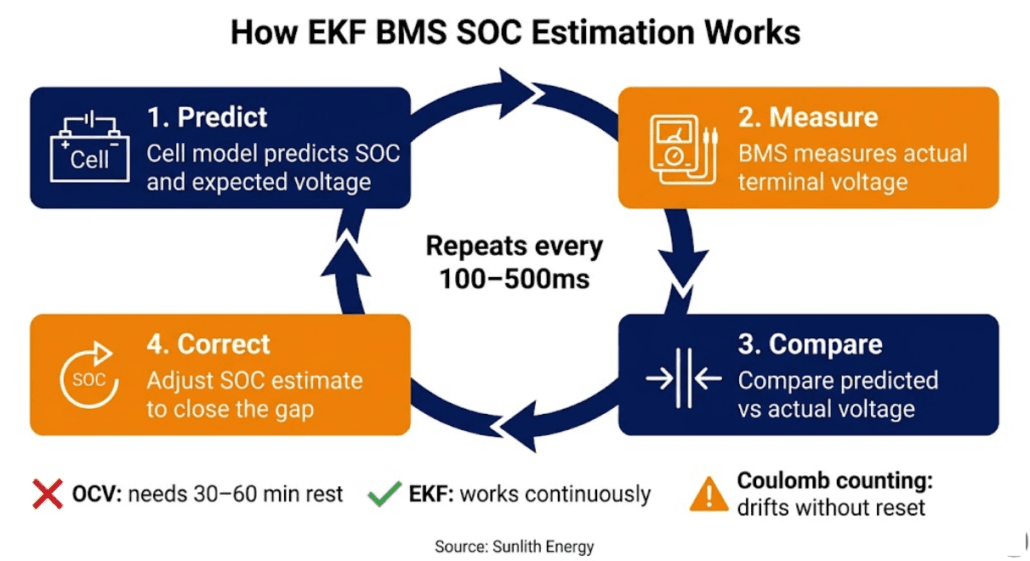
The Extended Kalman Filter combines a mathematical cell model with real-time voltage feedback to produce the most accurate BMS SOC estimation
The Extended Kalman Filter (EKF) is the most accurate BMS SOC estimation method available. It is also the most complex. Understanding how it works helps you spot genuine EKF from marketing language.
How EKF BMS SOC Estimation Works
EKF combines two things: a mathematical model of the battery’s behaviour and real-time measurements from the BMS sensors. It works in a continuous loop of prediction and correction.
First, the model predicts the current SOC and expected terminal voltage. It uses the last known state, the measured current, and the cell model to do this. Second, the BMS measures the actual terminal voltage. Third, the EKF compares predicted to measured voltage. Any gap triggers an SOC adjustment. This cycle repeats every few hundred milliseconds.
The result is an SOC estimate that self-corrects in real time. Unlike Coulomb counting, EKF does not accumulate drift — it continuously anchors its estimate to the measured voltage. Unlike OCV lookup, it does not need the battery to be at rest.
Why EKF BMS SOC Estimation Handles LFP So Well
The flat voltage curve that makes OCV unreliable for LFP does not stop EKF from working. The EKF does not try to read SOC directly from voltage. Instead, it uses the voltage measurement as a correction signal for the cell model.
Even a small voltage deviation from the model prediction provides useful information. The EKF extracts SOC data from tiny voltage changes that OCV lookup would treat as noise. Furthermore, as the cell ages, adaptive EKF variants update the cell model parameters in real time to maintain accuracy throughout the battery’s life.
EKF Limitations and What to Ask Suppliers
EKF is powerful but has real requirements. First, it needs a cell model specifically calibrated for the cell chemistry, capacity, and temperature range of the actual cells in the system. A generic EKF with a poorly matched model is often less accurate than good Coulomb counting.
Second, EKF requires more processing power than OCV or Coulomb counting. This is manageable on modern BMS hardware but is a cost factor in low-end systems.
Third, EKF accuracy degrades as cells age if the model is not updated. The best EKF implementations use adaptive Kalman filtering — continuously refining the cell model as the battery ages. This is the gold standard for long-life BESS applications.
When evaluating a supplier, ask specifically: is the EKF model calibrated for the exact cells in this system? Can you show me the SOC accuracy data under dynamic load conditions? These two questions separate genuine EKF implementations from marketing claims.
5. BMS SOC Estimation Methods Compared: Full Head-to-Head
Factor
OCV Lookup
Coulomb Counting
Extended Kalman Filter
How it works
Maps resting voltage to SOC via lookup table
Integrates current over time to track charge change
Combines cell model + real-time voltage correction
Accuracy on LFP
Poor — flat curve makes lookup unreliable
Good short-term — drifts without recalibration
Excellent — handles flat curve, self-correcting
Accuracy on NMC
Good at rest — unreliable under load
Good short-term — drifts without recalibration
Excellent — most accurate under all conditions
Real-time use
No — needs 30–60 min rest period
Yes — works continuously during operation
Yes — works continuously, self-corrects
Drift over time
None — but only valid at rest
2–5% per day without recalibration
Minimal — self-correcting via voltage feedback
Hardware needed
Voltage sensor only
Needs voltage + current sensor
Voltage + current + temperature sensor
Processing demand
Very low
Low
Medium to high
Cost
Lowest
Low to medium
Medium to high
Best application
Initial SOC at startup / recalibration anchor
Residential and C&I BESS — minimum standard
Utility-scale BESS, high-accuracy and EU Passport systems
⚠️ The Supplier Red Flag to Watch For Some BMS suppliers claim EKF but implement only Coulomb counting with a lookup table correction. Ask for the SOC accuracy specification under dynamic load — not just at rest. Genuine EKF achieves ±1–2% accuracy under active charge and discharge. If a supplier cannot provide dynamic load SOC accuracy data, the EKF claim should be treated with scepticism.
6. Combining BMS SOC Estimation Methods: The Hybrid Approach
In practice, most well-designed BMS platforms combine more than one method. Each method has complementary strengths. Using them together produces better SOC accuracy than any single method alone.
Coulomb Counting with OCV Resets — The Standard Hybrid
The most common combination is Coulomb counting for real-time tracking, with OCV resets at known charge endpoints. This is the minimum acceptable standard for any serious BESS application.
During operation, Coulomb counting tracks every charge and discharge event. When the battery reaches full charge or full discharge, the BMS resets the Coulomb count to 100% or 0%. This corrects drift and keeps the long-term SOC estimate accurate.
The weakness of this hybrid is that it only corrects drift at the endpoints. Systems within a narrow SOC band — staying between 20% and 80% — may go many days without hitting a reset point. Drift can therefore accumulate. However, for most solar storage applications, a full charge event happens every few days, keeping drift within acceptable limits.
EKF with Coulomb Counting — The Premium Hybrid
The best BMS SOC estimation systems use EKF as the primary method with Coulomb counting as a supporting input. Coulomb counting data feeds the EKF’s prediction step, providing a continuous current-based SOC estimate. EKF then corrects this estimate in real time using the actual measured voltage.
This hybrid gets the best of both worlds. Coulomb counting provides a stable, low-noise baseline. EKF then provides continuous self-correction and adapts to temperature changes, aging, and varying load profiles. As a result, this combination achieves ±1–2% SOC accuracy under most real-world conditions.
Premium BMS platforms from Texas Instruments, Analog Devices, Orion BMS, and leading Chinese BMS manufacturers use this EKF-plus-Coulomb-counting design. It is the right choice for utility-scale systems, high-frequency cycling, and any BESS needing SOC accuracy for grid services or EU Battery Passport compliance.
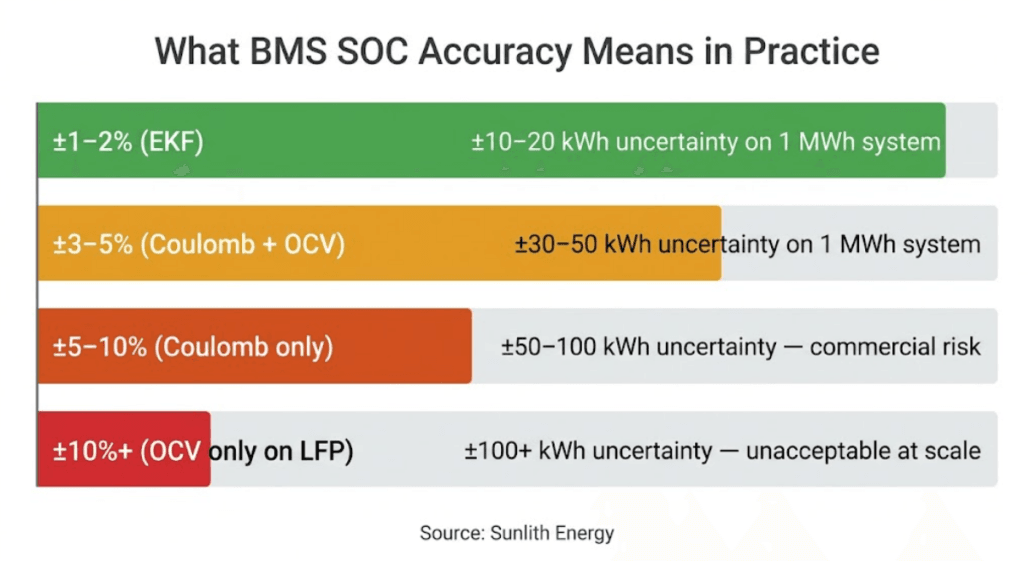
7. BMS SOC Estimation Accuracy: What the Numbers Mean in Practice
SOC accuracy is stated as a percentage error. Understanding what these numbers mean for your system helps you decide how much BMS SOC estimation quality you actually need.
SOC Accuracy
Method Typical Range
Impact on 100 kWh System
Impact on 1 MWh System
±1–2%
EKF (premium)
±1–2 kWh uncertainty
±10–20 kWh uncertainty
±3–5%
Coulomb + OCV reset
±3–5 kWh uncertainty
±30–50 kWh uncertainty
±5–10%
Coulomb (no reset)
±5–10 kWh uncertainty
±50–100 kWh uncertainty
±10%+
OCV only (LFP)
±10+ kWh uncertainty
±100+ kWh uncertainty — unacceptable
For a residential solar storage system, ±5% SOC accuracy is generally acceptable. The system rarely needs precise SOC accounting. The cost premium of EKF over Coulomb counting is hard to justify at this scale.
For a commercial BESS providing grid services, ±3–5% may be the minimum. Dispatch contracts require specific energy delivery. Poor SOC accuracy means the system either under-delivers — breaching the contract — or over-reserves buffer, leaving revenue on the table.
For a utility-scale BESS above 1 MWh, ±1–2% from EKF is strongly preferred. At this scale, a 5% SOC error represents 50 kWh of uncertainty. Over a year of daily cycling, that uncertainty compounds into meaningful commercial and compliance risk.
8. BMS SOC Estimation and LFP: Special Considerations
LFP’s flat voltage curve makes it the hardest chemistry for BMS SOC estimation. This is covered in depth in our BMS for LiFePO4 guide. Here is a summary of the key points for context.
Why OCV SOC Estimation Fails on LFP
LFP cells show almost no voltage change between 20% and 80% SOC. This flat region covers most of the battery’s working range. An OCV lookup here produces a highly uncertain SOC estimate — the voltage gap between 30% and 70% SOC is smaller than most sensor noise floors.
The practical consequence is large SOC jumps. A BMS relying on OCV for LFP may show the SOC drop from 60% to 20% almost instantly as the battery moves off the plateau. This causes unnecessary alarms, early shutdowns, and confused dispatch logic.
The Correct BMS SOC Estimation Approach for LFP
For LFP, the minimum acceptable approach is Coulomb counting with OCV resets at the charge and discharge endpoints. This gives accurate real-time tracking with periodic recalibration at known states.
For LFP systems above 200 kWh or cycling more than once daily, EKF is strongly recommended. Its self-correcting design keeps SOC accurate even when the system stays within a narrow SOC band and rarely reaches the reset endpoints.
9. Questions to Ask Your BMS Supplier About SOC Estimation
Most BMS suppliers will claim accurate SOC estimation. Asking specific questions separates genuine capability from marketing language. These five questions reveal what is actually under the hood.
Questions on Method and Accuracy
Which SOC estimation method does the BMS use — OCV, Coulomb counting, EKF, or a hybrid?
This is the foundational question. OCV-only on LFP cells is a dealbreaker — walk away. For Coulomb counting, ask about the drift rate and recalibration strategy. For an EKF answer, proceed to question 2.
What is the SOC accuracy under dynamic load — not just at rest?
Many suppliers quote SOC accuracy measured at rest, where OCV is reliable. Genuine EKF accuracy should be ±1–2% under active charge and discharge. Ask specifically for dynamic load accuracy data. If they can only provide resting accuracy, the EKF implementation is likely superficial.
Was the cell model calibrated for the specific LFP or NMC cells in this system?
A generic EKF with a poorly matched cell model is often less accurate than good Coulomb counting. The cell model must be calibrated for the specific cell chemistry, capacity, and temperature range. Ask for a test report showing SOC accuracy on the actual cells being supplied.
Questions on Long-Term Performance
How does the BMS SOC estimation handle cell aging?
Cell capacity decreases as the battery ages. A BMS using a fixed capacity value will overestimate SOC as the cells degrade. The best systems use adaptive EKF or periodic capacity recalibration to track fade. Ask whether the BMS updates its capacity estimate over time.
How is the SOC estimate logged and exported for EU Battery Passport compliance?
From February 2027, BESS sold into the EU must provide SOC history, energy throughput, and SOH data as part of the Digital Battery Passport. The BMS is the primary data source. Ask how the SOC log is stored, how long it is kept, and what format it exports in. A BMS without adequate data logging creates EU compliance risk from 2027.
Conclusion: Choosing the Right BMS SOC Estimation Method
BMS SOC estimation is not a detail — it is the foundation of everything your BESS does. A poor SOC estimate causes early shutdowns, wasted capacity, bad dispatch decisions, and EU compliance problems.
The right BMS SOC estimation method depends on your system:
Residential and small C&I (under 100 kWh): Coulomb counting with OCV resets is the minimum standard. It is reliable, cost-effective, and accurate enough for most solar storage applications
Commercial BESS (100 kWh–1 MWh): Coulomb counting with OCV resets is acceptable. However, EKF is preferred for systems providing grid services or operating within a narrow SOC band
Utility-scale BESS (1 MWh+): EKF is strongly recommended. At this scale, a 5% SOC error is too large for safe and profitable operation
LFP systems at any scale: OCV-only is never acceptable. Coulomb counting with resets is the minimum. EKF is best for daily-cycling systems above 200 kWh
The five questions in Section 9 will reveal whether a supplier uses genuine BMS SOC estimation or a basic method relabelled with technical language. Ask them before you sign.
☀️ Need a BMS SOC Estimation Review for Your BESS Project? Sunlith Energy reviews BMS SOC estimation methods and accuracy data for BESS projects from 50 kWh upward. We check whether the method suits your chemistry, cycling profile, and EU compliance needs — before you commit to a supplier. Contact us
Frequently Asked Questions About BMS SOC Estimation
What is SOC in a battery management system?
SOC stands for State of Charge. It is the BMS’s estimate of how much energy is currently stored in the battery, expressed as a percentage of full capacity. A battery at 100% SOC is fully charged. At 0% SOC it is empty. The BMS uses voltage, current, and temperature data to calculate this estimate continuously during operation.
Why is Coulomb counting the most common BMS SOC estimation method?
Coulomb counting is widely used because it works in real time and requires only a current sensor. It is accurate over short periods and does not need the battery to rest — unlike OCV lookup. It is also computationally simple, making it cost-effective for residential and commercial BMS platforms. Its main weakness is drift, which is corrected by OCV resets at known charge endpoints.
Is Kalman filter SOC estimation worth the cost for a small BESS?
For residential systems under 30 kWh, EKF is generally not worth the cost premium. Coulomb counting with OCV resets delivers adequate accuracy at lower cost. However, for systems above 100 kWh that cycle daily or use LFP in a narrow SOC band, EKF’s self-correcting accuracy pays for itself quickly in reduced dispatch errors and avoided shutdowns.
How does SOC estimation affect EU Battery Passport compliance?
The EU Digital Battery Passport, mandatory from February 2027, requires historical SOC data, energy throughput, and State of Health records. The BMS is the primary data source for all of these. A BMS with poor SOC accuracy produces unreliable passport data — and creates regulatory risk. For EU market access after 2027, accurate SOC logging is not optional.
What SOC accuracy should I expect from my BMS?
A Coulomb counting BMS with regular OCV resets should achieve ±3–5% in normal operation. An EKF-based BMS with a well-calibrated cell model should achieve ±1–2% under dynamic load conditions. SOC accuracy worse than ±10% typically indicates OCV-only estimation on LFP — or a poorly calibrated system that needs attention.
Can the BMS SOC estimation method be changed after installation?
In most systems, the SOC estimation method is set in the BMS firmware. It cannot be changed in the field without a firmware update. Some premium BMS platforms support OTA updates, allowing the SOC algorithm to be improved remotely. For long-life BESS projects, OTA capability is worthwhile — it lets the cell model be refined as the battery ages.
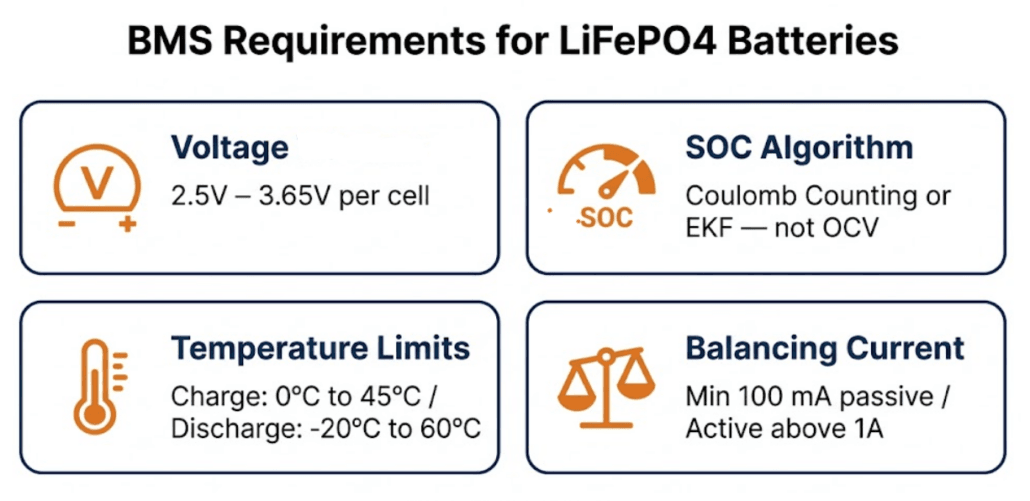
⚡ Quick Answer: What Does a BMS for LiFePO4 Need? A BMS for LiFePO4 batteries must enforce a cell voltage window of 2.5V–3.65V, use Coulomb counting or Kalman filtering for accurate SOC (not OCV alone), provide at least 80–100 mA balancing current for passive systems, monitor temperature at multiple points, and halt charging below 0°C. These requirements differ significantly from NMC — a BMS designed for NMC will underperform on LFP cells.
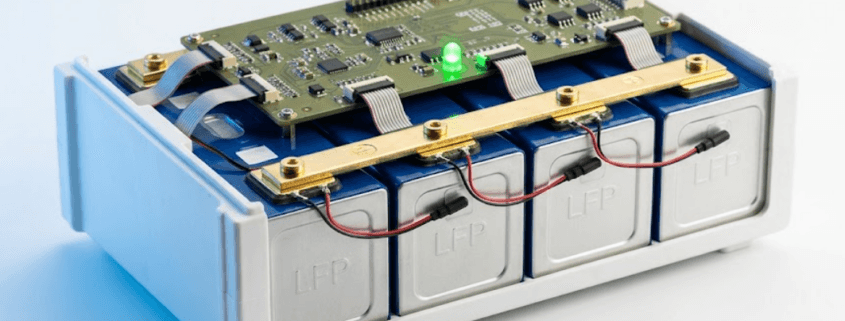
LiFePO4 (LFP) is the dominant chemistry for solar storage, commercial BESS, and off-grid systems. Its long cycle life, thermal stability, and safety advantages make it the first choice for most stationary applications. However, LFP also has specific characteristics that place unique demands on the BMS for LiFePO4.
Not every BMS is built with LFP in mind. Many suppliers use a generic platform across multiple chemistries. Consequently, an NMC-designed BMS on LFP cells shows poor SOC accuracy and slow balancing. It also lacks the specific protections LFP needs.
This guide covers the key requirements for a BMS for LiFePO4 — voltage parameters, SOC methods, balancing current, and temperature limits. It also includes the supplier questions that reveal whether a BMS is genuinely built for LFP.
New to battery management systems? Read our complete BMS explainer guide first, then return here for the LFP-specific detail.
1. Why LiFePO4 Places Unique Demands on the BMS
LFP’s chemistry gives it three properties that directly shape what the BMS must do. Understanding these properties is the starting point for evaluating any BMS for LiFePO4.
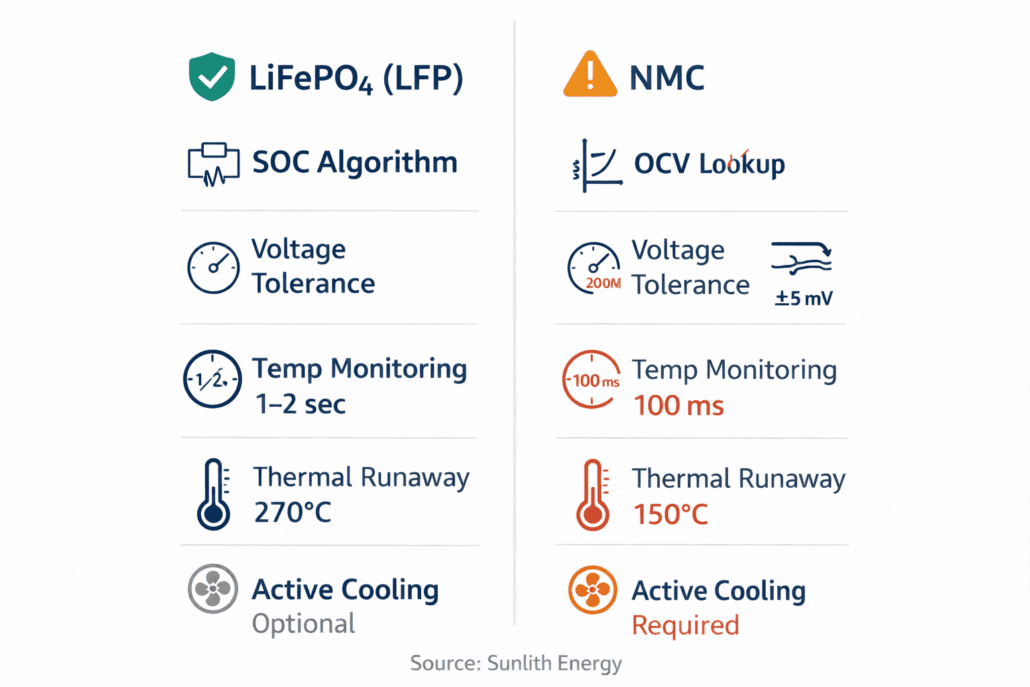
The Flat Voltage Curve: LiFePO4’s Biggest BMS Challenge
LFP cells operate near 3.2V–3.3V across most of their usable SOC range. Specifically, from 20% to 80% SOC, the voltage barely moves. This is unlike NMC, where voltage drops steadily and predictably as the cell discharges.
Consequently, the BMS cannot rely on voltage alone to estimate SOC. A cell at 50% SOC and a cell at 30% SOC look almost identical on voltage. As a result, any BMS that uses OCV as its primary SOC method will be wildly inaccurate on LFP during operation.
This is the most important LFP-specific BMS requirement. A wrong SOC estimate causes early shutdowns and surprise overcharge events. It also wastes usable energy by setting overly cautious capacity limits.
Chemical Stability: LiFePO4 Still Needs BMS Protection
LFP’s iron-phosphate cathode is chemically very stable. Its thermal runaway threshold is 270°C–300°C — far higher than NMC’s 150°C–210°C. This stability means the BMS has more time to respond to developing faults. However, it does not mean LFP needs less protection.
Over-discharge below 2.5V per cell damages the anode permanently. Overcharge above 3.65V per cell damages the cathode. Both need fast BMS action. The stability advantage of LFP reduces thermal risk — but it does not reduce voltage protection needs.
Wide Operating Temperature Range
LFP handles temperature extremes better than NMC. It operates from -20°C to 60°C on discharge and from 0°C to 45°C on charge. However, charging below 0°C causes lithium plating. This is a permanent form of anode damage that accumulates with each cold-temperature charge cycle.
The BMS must, therefore, actively halt charging when cell temperature drops below 0°C. This is a hard protection requirement, not a soft warning. For more on how temperature affects LFP lifespan, see our guide on temperature impact on LiFePO4 cycle life.
2. LiFePO4 BMS Voltage Parameters: The Exact Numbers
Voltage parameters are the foundation of any BMS for LiFePO4 configuration. These values define the safe operating window for each cell. The BMS enforces them through contactor control and charge/discharge current limiting.
Parameter
LFP Value
What Happens If Breached
Nominal cell voltage
3.2V
Reference point for system design — not a limit
Charge cutoff (max)
3.65V per cell
Permanent cathode damage above this — BMS must disconnect
Discharge cutoff (min)
2.5V per cell
Permanent anode damage below this — BMS must disconnect
Recommended operating range
2.8V–3.4V per cell
Staying within this range extends cycle life significantly
Cell voltage balance tolerance
±20mV typical
Wider spread indicates balancing failure or weak cell
Low voltage pre-warning
2.7V–2.8V
BMS should alert before hard cutoff — allows graceful shutdown
Why Cell-Level Monitoring Is Non-Negotiable
These voltage limits apply to individual cells — not to the overall pack voltage. In a 16S LFP pack (16 cells in series), the nominal pack voltage is 51.2V. However, one weak cell can hit its 2.5V discharge cutoff while the pack voltage still reads 49V — well above the apparent safe threshold.
A BMS that monitors only pack voltage will therefore miss this event entirely. The weak cell gets driven below its safe limit and suffers permanent damage. Consequently, cell-level individual voltage monitoring is the most basic non-negotiable requirement for any BMS for LiFePO4.
Voltage Tolerance in the BMS Hardware
The accuracy of the voltage measurement circuit matters. For LFP, a measurement tolerance of ±5–10mV per cell is acceptable. Some premium BMS platforms achieve ±1–2mV. Tighter tolerances mean the BMS can set closer operating limits and extract more usable capacity from the pack.
Ask your supplier: what is the cell voltage measurement accuracy of the BMS? If they cannot answer, that is a red flag.
3. SOC Estimation for LiFePO4: Why OCV Alone Fails
LFP’s flat voltage curve makes OCV-based SOC estimation unreliable — the BMS must use Coulomb counting or Kalman filtering instead
SOC estimation is where most generic platforms fail. It is, therefore, the most important technical question to ask any BMS for LiFePO4 supplier.
Why OCV Fails for LFP
OCV lookup works by mapping a resting cell voltage to a SOC value. It uses a table built from cell tests. This works well for NMC because NMC voltage drops steadily as the cell discharges.
LFP, however, produces an almost flat voltage curve between 20% and 80% SOC — roughly 3.2V to 3.3V across this entire range. As a result, a cell at 25% SOC and a cell at 75% SOC look nearly identical on OCV. The BMS cannot distinguish between them. Consequently, an OCV-based BMS on LFP shows SOC readings that jump erratically and fail to track the actual charge state.
OCV is only useful for LFP after the battery has rested for at least 30–60 minutes with no current flowing. It is, therefore, a valid method for setting the initial SOC estimate at startup — not for real-time tracking.
Coulomb Counting: The Minimum Standard for LFP
Coulomb counting integrates current over time to track charge entering and leaving the battery. It is the most widely used SOC method in real-time operation. It is also the minimum acceptable standard for any BMS for LiFePO4.
Coulomb counting is accurate over short periods. However, it drifts over time. Sensor errors, temperature effects, and small unmeasured currents all add up. Without regular recalibration, the SOC estimate can drift by 2–5% over several days.
Best practice: The BMS should recalibrate SOC to 100% when the battery reaches full charge voltage (3.65V per cell) and to 0% when it reaches the discharge cutoff (2.5V per cell). These are reliable anchor points that correct accumulated drift automatically.
Extended Kalman Filter: The Gold Standard for LFP
The Extended Kalman Filter (EKF) is the most accurate SOC method for LFP. It combines Coulomb counting with a cell behaviour model. Continuously, it corrects the estimate by comparing the model’s output to the actual measured voltage.
EKF handles LFP’s flat curve far better than OCV. It does not rely on voltage to estimate SOC. Instead, it uses a dynamic model that accounts for temperature, aging, and load history. Furthermore, premium BMS platforms from Texas Instruments, Analog Devices, and Orion BMS use EKF or adaptive Kalman filter variants.
The trade-off is complexity. EKF requires a well-characterised cell model that must be calibrated for the specific LFP cell chemistry in use. A generic EKF implementation calibrated for one cell type will not necessarily be accurate on another. Always ask whether the EKF model was calibrated for the specific cells in your system.
Method
Accuracy on LFP
Key Limitation
Use Case
OCV Lookup
Poor (flat curve)
Useless during operation
Initial SOC at rest only
Coulomb Counting
Good short-term, drifts
Accumulates error over time
Minimum standard — all LFP systems
Coulomb + OCV reset
Good — self-correcting
Needs full charge/discharge cycles
Residential and C&I systems
Extended Kalman Filter
Excellent (±1–2%)
Needs cell-specific calibration
Utility-scale and precision BESS
4. Temperature Requirements for a LiFePO4 BMS
LFP handles temperature better than NMC. However, this does not mean temperature management matters less — it means the safety margins are wider. The BMS must still enforce hard temperature limits and respond to thermal events.
LFP Temperature Operating Limits
Condition
Safe Range
BMS Action Required
Charging temperature
0°C to 45°C
Halt charging below 0°C — lithium plating risk
Discharging temperature
-20°C to 60°C
Reduce current below -10°C; cut off below -20°C
Optimal operating range
15°C to 35°C
No restriction — full rated performance
High temp warning
45°C–55°C
Reduce charge/discharge current; trigger cooling
High temp cutoff
Above 55°C–60°C
Disconnect pack — risk of accelerated degradation
Thermal runaway threshold
~270°C–300°C
Emergency disconnect and alarm — well above normal ops
Temperature Sensor Placement for LFP
The number and placement of temperature sensors directly affects BMS accuracy. For LFP packs, the minimum is one sensor per module. However, in larger systems, multiple sensors per module are standard — at the cell surface, the busbar, and inside the enclosure.
Temperature gradients across a large LFP pack can be significant. A poorly ventilated corner of a battery rack can run 10°C–15°C hotter than the rest. Without adequate sensor coverage, the BMS misses this. Consequently, the hottest cells degrade faster, creating imbalance that shortens the entire pack’s life.
Cold Weather and LFP: The Lithium Plating Risk
Charging LFP below 0°C is one of the most common field mistakes in cold-climate installations. When lithium ions cannot intercalate into the anode at low temperatures, they deposit as metallic lithium on the anode surface instead. This lithium plating is permanent and cumulative.
Specifically, repeated cold-temperature charging causes capacity loss and increases internal resistance. In severe cases, it creates dendrites that cause internal short circuits. The BMS must therefore monitor cell temperature before and during charging. It must halt charge current if any cell falls below 0°C.
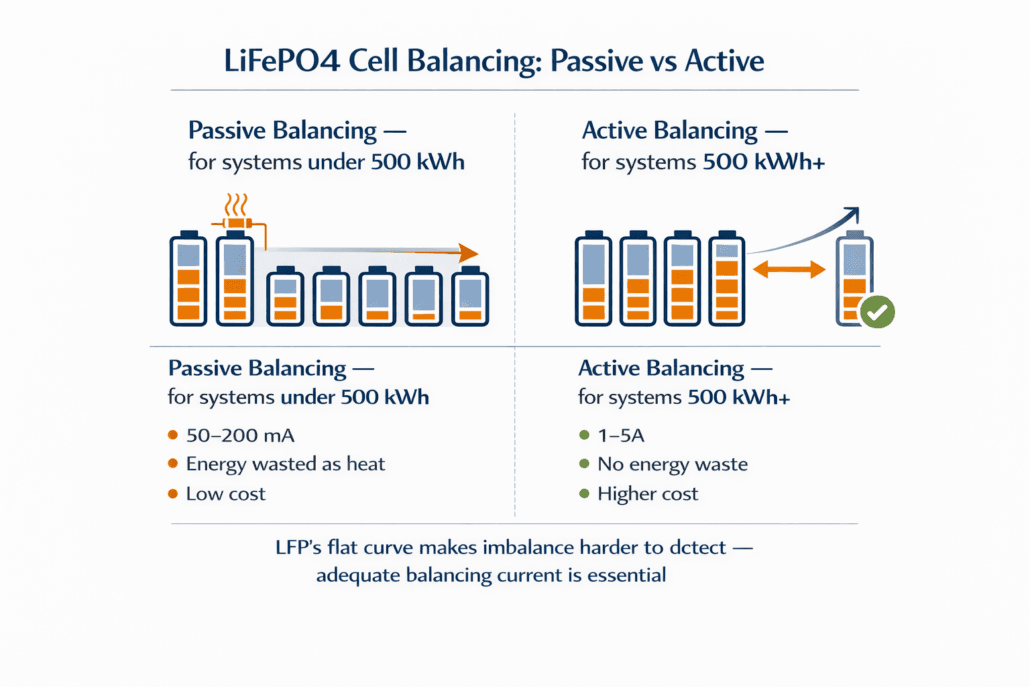
5. Cell Balancing Requirements for LiFePO4 BMS
LFP’s flat voltage curve makes cell imbalance harder to detect — the BMS needs adequate balancing current to keep cells in sync
Cell balancing is especially important for LFP. The flat voltage curve makes imbalance harder to spot by voltage alone. Two cells can differ significantly in SOC while showing nearly the same voltage. As a result, the BMS must use current tracking — not just voltage — to detect and correct imbalance.
Minimum Balancing Current for LFP
Passive balancing current determines how quickly the BMS can correct cell imbalance. For LFP systems, the minimum acceptable balancing current depends on system size and cycle frequency.
System Size
Minimum Balancing Current
Why
Residential (under 30 kWh)
50–100 mA
Low cycle frequency — slow balancing keeps up
Small C&I (30–200 kWh)
100–200 mA
Daily cycling creates drift — needs more current to correct
Large C&I (200–500 kWh)
200–500 mA or active
Passive may not keep up — active balancing preferred
Utility-scale (500 kWh+)
Active balancing (1–5A)
Passive is inadequate — active required for long-term performance
When to Specify Active Balancing for LFP
In residential systems with one cycle per day and high-grade A-cell packs, passive balancing at 100 mA is typically sufficient. The cells are well-matched from the factory and, consequently, drift slowly at moderate cycle rates.
Active balancing becomes worthwhile for LFP systems in three situations. First, systems above 500 kWh that cycle daily — imbalance builds faster than passive balancing can fix. Second, systems in variable temperature environments where thermal gradients cause uneven aging. Third, long-duration systems designed for 15+ years where small capacity gains have significant ROI impact.
For a detailed comparison of passive vs active balancing methods, see our complete BMS guide which covers both approaches in depth.
6. Protection Functions: What a LiFePO4 BMS Must Detect
Beyond voltage and temperature, a BMS for LiFePO4 must handle several protection scenarios. Each one has LFP-specific parameters that differ from other chemistries.
Overcharge Protection in a BMS for LiFePO4
The hard overcharge cutoff for LFP is 3.65V per cell. Above this, the cathode undergoes irreversible structural changes. The BMS must therefore disconnect the charge current before any cell reaches this limit. It must do so at the cell level — not the pack level.
Response time should be under 100ms from detection to contactor opening. Additionally, the BMS should implement a pre-warning at around 3.55V–3.60V that reduces charge current (CC-CV charging taper) before the hard cutoff is needed. This protects cells and reduces stress on the contactor.
Over-Discharge Protection for LiFePO4 Cells
The discharge cutoff for LFP is 2.5V per cell. However, the recommended operating minimum is 2.8V — keeping cells above 2.8V significantly extends cycle life. The BMS should therefore implement a two-stage approach: a soft limit at 2.8V that issues a warning and reduces available power, and a hard cutoff at 2.5V that disconnects the pack entirely.
In grid-connected systems, the EMS typically enforces the operational SOC limit well above the hard BMS cutoff. However, the BMS hard limit acts as the last line of defence. It activates if the EMS dispatch fails or if the system enters an unexpected deep discharge scenario.
Short Circuit and Overcurrent Protection
Short circuit response must be in microseconds. The BMS uses a hardware protection circuit — a MOSFET or contactor — that operates independently of the main processor. Software-based response is simply too slow for a hard short circuit event.
Overcurrent protection covers sustained high-current events that are not a hard short. It typically uses a time-delay threshold — for example, 2C discharge for more than 10 seconds triggers a disconnect. The exact settings depend on the cell’s C-rate rating and the load profile.
Cell Voltage Imbalance: A Key LiFePO4 BMS Alert
This is an LFP-specific protection function that many generic BMS platforms handle poorly. LFP cells look similar on voltage even when SOC values differ significantly. As a result, the BMS must monitor cell voltage spread continuously and alert when cells diverge beyond the tolerance threshold.
A spread greater than 50–100 mV across cells indicates a problem. It is typically a sign of a weak cell, a failing balancing circuit, or early degradation. The BMS should log this event and alert the monitoring platform — not simply trigger a hard cutoff.
7. BMS for LiFePO4: Communication and Data Requirements
A BMS for LiFePO4 in a modern BESS must communicate reliably with the inverter, EMS, and monitoring platform. Furthermore, from 2027, EU Battery Passport compliance adds data logging requirements. As a result, communication capability becomes a regulatory issue — not just a technical one.
Communication Protocols: What a BMS for LiFePO4 Must Support
CAN bus 2.0A/B — standard for high-performance and EV-derived BMS platforms; fastest and most reliable
RS485 / Modbus RTU — most common in C&I and utility BESS; compatible with most commercial inverters
CANopen — used in some European industrial applications
MQTT / TCP-IP — required for cloud monitoring and Battery Passport data export
Before specifying a BMS, confirm it works with your inverter’s protocol. A mismatch needs a gateway converter — adding cost, a failure point, and communication lag.
Data Logging Requirements for LiFePO4 BMS Systems
For residential and small commercial LFP systems, minimum data logging should cover SOC, cell voltages, temperatures, cycle count, and fault history. This supports warranty claims and helps diagnose degradation over time.
For systems selling into the EU market after February 2027, the BMS must also log SOH history, energy throughput, and temperature exposure. This data must be in a format compatible with the EU Digital Battery Passport. For full details, see our EU 2023/1542 compliance guide.
8. BMS for LiFePO4 Certifications: What to Check
A BMS for LiFePO4 in a commercial or grid-connected system must hold safety certifications. These confirm the BMS has been tested under fault conditions and meets minimum protection standards.
Standard
Scope
LFP BMS Relevance
UL 1973
Stationary lithium battery systems
Required for US market — covers BMS protection functions
IEC 62619
Li-ion battery safety
International standard — covers voltage, temp, and BMS protection
IEC 62933-5
ESS safety framework
Covers BMS communication, monitoring, and fault response
UN 38.3
Transport safety
BMS must survive vibration and thermal tests for shipping
CE Marking
EU market access
Required for EU sales — covers electrical safety
Always request the full test reports — not just the certificate. A reputable BMS supplier will provide complete documentation without hesitation. If they provide only a certificate image with no underlying test data, treat that as a red flag.
9. How to Evaluate a LiFePO4 BMS: 7 Specific Questions
Generic BMS evaluation questions apply to all lithium chemistries. These seven questions, however, are specifically designed to reveal whether a BMS has been properly configured for LFP cells.
Questions 1–4: Technical Parameters
What SOC algorithm does this BMS use for LFP — and can you show me the accuracy data?
If the answer is OCV lookup, walk away. Ask specifically for SOC accuracy under dynamic load conditions — not just at rest. A good answer is Coulomb counting with OCV reset, or EKF with LFP-calibrated cell model. Ask for the SOC error percentage from their test data.
What is the cell voltage measurement accuracy, and how often does the BMS sample each cell?
For LFP, ±10mV or better is the minimum. Sampling frequency should be at least once per second under normal operation, with faster sampling during charge/discharge transitions. Slower sampling misses brief voltage spikes near the cutoff limits.
Does the BMS halt charging below 0°C at the cell level — not just the ambient temperature?
This is a critical LFP protection requirement. Ambient temperature sensors can give false readings. A cell inside an enclosure can be warmer or colder than the ambient sensor shows. The BMS must therefore use cell-level temperature sensors for this protection. If the supplier uses only one ambient sensor, that is inadequate for LFP.
What is the balancing current, and is it sufficient for the system’s daily cycle rate?
Use the table in Section 5 as your reference. A 50 kWh residential system cycling once daily needs at least 100 mA. A 500 kWh C&I system cycling twice daily needs at minimum 500 mA passive or active balancing. If the supplier cannot tell you the balancing current, that is a red flag.
Questions 5–7: Data and Support
Was the BMS calibrated specifically for the LFP cells in this system — or is it a generic configuration?
SOC accuracy depends on the BMS being calibrated for the specific cell chemistry and capacity. A BMS set up for a 100 Ah CATL cell will not be accurate on a 200 Ah EVE cell. Always ask whether the cell model was calibrated for your specific cells.
What LFP-specific fault codes does the BMS log, and how are they accessible?
Look for: cell voltage imbalance alerts, low-temperature charge inhibit events, SOC drift correction logs, and balancing records. These are essential for diagnosing field problems and supporting warranty claims. A BMS that only logs hard faults — not pre-fault warnings — will miss early signs of cell trouble.
Does the BMS support OTA firmware updates — and is the LFP cell model updatable in the field?
LFP cells change as they age. A BMS with OTA firmware updates can recalibrate its cell model over time. This keeps SOC accuracy high as the cells degrade. It is a premium feature — but it matters a lot for systems designed to last 15+ years.
Conclusion: Match the BMS to the Chemistry
A BMS for LiFePO4 is not the same as a generic lithium BMS. LFP’s flat voltage curve needs a purpose-built SOC method. Its sensitivity to cold charging needs cell-level temperature sensors. Its long cycle life needs strong balancing to keep cells aligned over thousands of cycles.
The seven questions in Section 9 will reveal whether a supplier has genuinely designed their BMS for LiFePO4 — or simply relabelled an NMC platform. The difference matters. Over a 15-year lifespan, a purpose-built BMS for LiFePO4 delivers more usable energy, better SOC accuracy, and fewer field failures.
☀️ Need an LFP BMS Review for Your BESS Project? Sunlith Energy reviews BMS specifications for LFP projects from 50 kWh upward. We check SOC algorithm suitability, voltage parameter configuration, balancing current adequacy, and certification compliance — before you commit to a supplier. Contact us
Frequently Asked Questions
What voltage should a LiFePO4 BMS cut off at?
The hard charge cutoff is 3.65V per cell and the hard discharge cutoff is 2.5V per cell. However, for longer cycle life, the recommended operating range is 2.8V to 3.4V. Operating consistently within this narrower range can significantly extend total cycle count over the system’s lifetime.
Can I use an NMC BMS on LiFePO4 cells?
Technically you can, but the SOC accuracy will be poor. NMC BMS platforms typically use OCV-based SOC, which fails on LFP’s flat voltage curve. The voltage window settings will also be wrong — NMC cells have higher charge cutoffs and different discharge profiles. In practice, an NMC BMS on LFP leads to inaccurate SOC readings, early shutdowns, and reduced usable capacity.
What is the minimum balancing current for a LiFePO4 BMS?
Residential systems under 30 kWh cycling once daily need 50–100 mA passive balancing. Commercial systems above 100 kWh cycling daily need 200 mA or more. Active balancing is preferred for systems above 500 kWh. Low balancing current in a large pack allows imbalance to accumulate — leading to progressive capacity loss.
Does a LiFePO4 BMS need to stop charging in cold weather?
Yes — this is a hard requirement. Charging LFP below 0°C causes lithium plating, which is permanent and cumulative. The BMS must use cell-level temperature sensors to enforce this protection. Ambient sensors alone are not sufficient — cells inside an enclosure can be warmer or colder than the surrounding air suggests.
How accurate should SOC be on a LiFePO4 BMS?
A Coulomb counting BMS with regular OCV resets should achieve ±3–5% SOC accuracy in steady-state operation. An EKF-based BMS with a properly calibrated LFP cell model should achieve ±1–2%. Poor SOC accuracy above ±10% typically indicates OCV-only estimation — or a cell model not calibrated for the specific LFP chemistry.
Energy Storage Calculation is essential for designing reliable solar and battery systems. In simple terms, it helps you determine how much energy you need to store and how large your solar system should be.
In this guide, you will learn step-by-step formulas, real examples, and practical sizing methods. As a result, you can design a system that is both efficient and cost-effective.
How do you calculate energy storage requirements?
Parameter
Formula
Battery Storage
Daily Energy × Backup Time ÷ DoD
Solar Size
Daily Energy ÷ Peak Sun Hours
Energy storage requirements are calculated by multiplying daily energy consumption by backup duration. Then, divide by battery depth of discharge (DoD). Similarly, solar size is calculated by dividing daily energy consumption by peak sun hours.
What is energy storage calculation?
Energy Storage Calculation is the process of determining battery capacity based on energy usage and backup time. In other words, it ensures your system can handle real demand.
Moreover, accurate calculation prevents system failure and overspending. Therefore, it is a critical step in system design.
How do you calculate your daily load?
First, list all appliances. Then, multiply power by usage hours.
Formula:
Energy (Wh) = Power (W) × Time (hours)
Example:
Appliance
Power
Hours
Energy
Lights
50W
6
300 Wh
Fan
75W
8
600 Wh
Refrigerator
150W
10
1500 Wh
TV
100W
4
400 Wh
Total daily load = 2800 Wh (2.8 kWh)
As you can see, even small loads add up quickly. Therefore, accurate listing is important.
How do you account for system losses?
#image_title
In real systems, energy losses always occur. For example, losses come from inverters, wiring, and battery conversion.
Formula:
Adjusted Load = Total Load ÷ Efficiency
Typically, efficiency ranges from 80% to 90%.
Example: 2800 ÷ 0.85 = 3294 Wh
As a result, your system must be slightly larger than the raw load.
A major mistake is underestimating system losses — read more about real-world loss factors in our Energy Storage Losses BESS guide
How do you calculate battery storage requirements?
Next, calculate battery size based on backup duration.
Before sizing your array, it is important to understand how raw panel ratings translate into energy output. For a full breakdown, check out our kWp vs kWh Solar Guide.
Battery sizing depends on how long backup is required. For short outages, smaller batteries work. However, for multi-day backup, large systems are needed.
Therefore, always define backup duration clearly before design.
Residential system example
Let’s consider a typical home.
Daily load: 5 kWh
Backup: 1 day
DoD: 80%
Battery: 5 ÷ 0.8 = 6.25 kWh
Solar: 5000 ÷ 5 = 1 kW
So, the system requires:
~6.5 kWh battery
~1 kW solar
Commercial system example
Now consider a commercial case.
Load: 50 kWh
Backup: 2 days
Battery: 50 × 2 ÷ 0.8 = 125 kWh
Solar: 50000 ÷ 5 = 10 kW
Clearly, commercial systems scale quickly. Therefore, precise calculation is critical.
What are common mistakes in energy storage calculation?
Many systems fail due to simple errors. For example:
Ignoring efficiency losses
Underestimating backup time
Using incorrect sun hours
Not applying DoD
Skipping safety margin
As a result, systems may underperform or fail early.
To build a more efficient energy storage system, factor in real losses. Our energy storage loss guide breaks this down with practical examples and tips.
Best practices for accurate system design
To improve system performance, follow these best practices:
Always add 20% safety margin
Use LiFePO4 batteries
Design using real load data
Plan for worst-case conditions
Additionally, separating peak load from energy load improves design accuracy.
Next Step: Once you have calculated your baseline numbers, read our deep dive on BESS Oversizing: Pros, Cons & Strategy to see if adding an extra capacity buffer makes financial sense for your project.
To build a more efficient energy storage system, factor in real losses. Our energy storage loss guide breaks this down with practical examples and tips.
Resources
For deeper understanding and system design support:
These resources help validate calculations and improve system design accuracy.
Frequently Asked Questions (FAQ)
How much battery storage do I need for my home?
Battery storage depends on daily energy use and backup time. Typically, homes require 5–15 kWh for 1-day backup.
How many solar panels are required?
It depends on energy consumption and sunlight. On average, 1 kW solar requires 2–3 panels (400W each).
What is the best battery type?
LiFePO4 batteries are the best choice due to long life, high safety, and deep discharge capability.
What happens if battery size is too small?
If the battery is undersized, backup time reduces. In some cases, the system may fail during outages.
Can solar panels run load and charge battery together?
Yes. A properly designed system can supply load and charge batteries simultaneously.
Conclusion
Energy Storage Calculation is the backbone of any solar and battery system. By following the correct steps, you can design a system that is reliable, efficient, and cost-effective.
Moreover, accurate sizing improves performance and extends battery life. Therefore, always use proper formulas and real data.
⚡ Quick Answer: What Is a Battery Management System? A battery management system (BMS) is the electronic brain inside every lithium battery pack. It monitors cell voltage, current, and temperature in real time. It also protects cells from overcharge, over-discharge, short circuit, and thermal runaway. Furthermore, it estimates State of Charge (SOC) and State of Health (SOH). Without a BMS, a lithium battery is both unsafe and short-lived.
Every lithium BESS relies on a battery management system to run safely. This is true for a 10 kWh home install and a 10 MWh grid system alike. In both cases, therefore, the BMS is not optional — it sits between your cells and everything that can destroy them.
Yet the BMS is one of the most overlooked parts of any BESS purchase. Buyers focus on cell chemistry, capacity, and cycle life. Then they treat the battery management system as a given. That is a costly mistake.
A poor BMS, therefore, degrades good cells. A great battery management system, in contrast, extends the life of average cells. It is a lifespan management tool — not just a safety device.
This guide explains how a battery management system works, what it monitors, and how it balances cells. We also cover SOC and SOH calculation and show you how to evaluate a supplier’s BMS before you sign. For context on how the BMS interacts with cell chemistry, first read our LiFePO4 vs NMC battery comparison guide.
1. What Is a Battery Management System?
How a battery management system connects cells, inverter, EMS, and monitoring platform
A battery management system (BMS) is an electronic control unit built into a battery pack. Specifically, its job is to protect cells, measure their state, and report data to the rest of the system.
Think of the BMS as doing three jobs at once. First, it acts as a protection circuit — preventing electrical and thermal damage to the cells. Second, it is a measurement system — tracking voltage, current, temperature, SOC, and SOH. Third, it is a communication hub — sending live data to the inverter, EMS, and monitoring platform.
In a simple 12V residential pack, the BMS is a small PCB inside the module. In a commercial BESS, however, it manages hundreds of cells at once. The scale changes — but the core functions stay the same.
🔋 Why the Battery Management System Determines Lifespan Two identical cell packs with different BMS implementations deliver very different lifespans. Specifically, a BMS that allows cells to hit voltage limits, run hot, or drift out of balance will shorten cell life — regardless of the chemistry’s rated cycle count. The battery management system is, therefore, as important as the cells themselves.
2. Battery Management System Functions: The Seven Core Jobs
A well-designed battery management system performs seven distinct functions. Each one protects the battery in a different way. Together, furthermore, they determine whether your BESS is safe, efficient, and long-lived.
2.1 Cell Voltage Monitoring
The BMS monitors every individual cell voltage — not just overall pack voltage. This matters because cells in a multi-cell pack drift apart over time. Specifically, one weak cell can hit its limit before the others do.
For LiFePO4 cells, the safe range is 2.5V to 3.65V per cell. Going outside this range — even briefly — causes permanent capacity loss. So the BMS must, therefore, detect and respond to violations in milliseconds.
Voltage monitoring also underpins SOC estimation, which we cover in Section 5. Without accurate cell-level data, furthermore, everything else the BMS does becomes unreliable.
2.2 Current Monitoring and Overcurrent Protection
The BMS measures charge and discharge current using a shunt resistor or Hall-effect sensor. Specifically, this data serves four purposes:
Coulomb counting — integrating current over time to estimate SOC
Overcurrent protection — detecting short circuits and excessive discharge rates
C-rate enforcement — ensuring cells never charge or discharge faster than their rated speed
Power limiting — reducing available power as SOC drops or temperature rises
2.3 Temperature Monitoring
Temperature is one of the biggest drivers of battery degradation. Consequently, the BMS places sensors at multiple points — cell surfaces, busbars, and the enclosure. It uses this data to trigger cooling and reduce current.
It also halts charging below 0°C. Charging below freezing causes lithium plating. This is permanent anode damage that cannot be reversed.
For LiFePO4, the safe charging range is 0°C to 45°C. Discharge, however, runs across a wider range of -20°C to 60°C. The BMS enforces both limits automatically.
2.4 Overcharge and Over-Discharge Protection
These are the two most critical BMS protection functions. Overcharging a lithium cell causes irreversible changes in the cathode. Similarly, over-discharging collapses the anode. Both permanently reduce capacity.
The BMS prevents both by triggering a contactor disconnect when any cell breaches its voltage limit. This happens even if the pack’s overall voltage looks normal. One weak cell can hit its limit while others still have headroom. That is why cell-level monitoring is non-negotiable.
2.5 Short Circuit Detection and Response
A short circuit sends a massive current spike through the pack in milliseconds. Without protection, the heat this creates can trigger thermal runaway. As a result, the BMS detects the spike and opens the contactor in microseconds — before damage occurs. Learn more about how these critical failure paths are analyzed and mitigated in our engineering deep-dive on BMS Functional Safety, HARA, and FMEA.
Furthermore, sustained overcurrent protection prevents operation at damaging C-rates. This applies even without a sudden short circuit event.
2.6 Cell Balancing
Cell balancing is one of the most important long-term BMS functions. It keeps all cells at the same State of Charge. Without it, the weakest cell limits the entire pack — even though the others still have energy to give.
We cover passive vs. active balancing in detail in Section 4. The key point, however, is this: balancing quality directly affects how much rated capacity you can use over time. In other words, poor balancing means lost energy.
2.7 Communication and Data Reporting
A modern battery management system communicates with the inverter, EMS, SCADA, and remote monitoring platforms. In particular, the most common protocols include:
CAN bus — standard in high-performance BESS and automotive applications
RS485 / Modbus RTU — common in commercial and industrial storage
MQTT / TCP-IP — used for cloud monitoring and Battery Passport data exports
For a comprehensive look at how these networks function and talk to one another, read our complete guide on BESS Communication Protocols.
The BMS transmits SOC, SOH, cell voltages, temperatures, current, cycle count, and fault codes. Specifically, this data feeds dispatch decisions in the EMS and enables remote health tracking.
3. Battery Management System Architecture Options
BMS architecture scales with system size. Specifically, there are three implementation levels. Each one adds capability and complexity.
BMS Tier
Also Called
Scope
Typical Application
Cell-level BMS
CBMS
Monitors individual cells in one module
Residential storage under 30 kWh
Module BMS
Slave BMS / MBMS
Manages one group of cells in a module
C&I systems, EV battery packs
System / Master BMS
SBMS / Master BMS
Coordinates all modules in the full pack
Utility-scale BESS, multi-rack systems
Single-Level BMS (Residential)
In smaller systems — typically under 100 kWh — a single BMS manages all cells directly. This is a simple, low-cost architecture. Consequently, the BMS PCB sits inside the battery module and handles monitoring, protection, and balancing on its own.
However, as cell count grows, wiring becomes complex and processing load increases. Beyond a certain size, single-level BMS becomes impractical.
Master-Slave BMS (Commercial and Utility Scale)
In larger systems — typically above 100 kWh — a master-slave design is used. Each battery module has its own Slave BMS. It handles local cell monitoring and balancing. All Slave units then report to a central Master BMS, which coordinates the full system.
The Master BMS aggregates data from all modules and manages system-level protection. Furthermore, it communicates with the inverter and EMS. As a result, this architecture scales well to multi-megawatt-hour systems.
⚠️ Key Evaluation Point: Master-Slave Independence In a quality master-slave battery management system, each slave module should protect its own cells independently — even if communication with the master is lost. A BMS where cell protection depends entirely on the master, however, creates a single point of failure. Therefore, always ask: what happens to cell-level protection if the master controller fails?
🔗Read Also:For a deeper comparison including wiring protocols and wireless BMS, see ourfull BMS architecture guide
4. Cell Balancing in a Battery Management System: Passive vs. Active
Passive balancing dissipates excess charge as heat. Active balancing transfers charge between cells electronically.
Why Cells Need Balancing
No two lithium cells are identical. Manufacturing tolerances mean cells leave the factory with slightly different capacities. Moreover, temperature gradients within a pack cause some cells to age faster. Self-discharge rates also vary slightly between cells.
[!NOTE] For the manufacturing step that happens before balancing even starts, see our cell matching guide.
Over time, cells drift apart in State of Charge. The cell with the lowest SOC determines when discharge must stop. Similarly, the cell with the highest SOC determines when charging must stop. If cells are out of balance, the weakest cell constrains the entire pack — even though the others still have capacity.
The BMS corrects this drift through balancing. As a result, all cells stay at the same SOC and the full rated capacity remains usable.
Passive Balancing: Simpler and More Common
Passive balancing is, specifically, the most common approach. The BMS bleeds off excess charge from higher-SOC cells as heat through a resistor. It keeps doing this until, eventually, all cells match the lowest cell.
Advantages: Low cost, simple, reliable, and well-proven across millions of systems.
Disadvantages: Energy is wasted as heat. Balancing current is typically low (20–200 mA), so it is slow. In large packs with heavy imbalance, furthermore, passive balancing cannot keep up.
Passive balancing is, therefore, best suited to residential and small commercial systems. It works particularly well where cell quality is high and cycle frequency is moderate.
Active Balancing: Better for High-Cycle Systems
Unlike passive balancing, active balancing transfers energy from higher-SOC cells to lower-SOC cells using inductive or capacitive circuits. Energy is not wasted — instead, it is redistributed within the pack.
Advantages: No energy waste. Higher balancing currents (0.5–5A) mean faster correction. Better long-term capacity retention in high-cycle applications.
Disadvantages: Higher cost and more complexity. There are, therefore, more potential failure points in the balancing circuitry.
Active balancing is, therefore, best specified for utility-scale BESS, frequency regulation, and systems designed for 15+ year lifespans where long-term capacity retention is critical to ROI.
Factor
Passive Balancing
Active Balancing
How it works
Burns excess charge as heat via resistor
Transfers charge between cells electronically
Energy efficiency
Low — energy wasted as heat
High — energy redistributed within pack
Balancing speed
Slow: 20–200 mA typical
Fast: 0.5–5A typical
System complexity
Simple and reliable
More complex, more failure points
Cost
Low
Higher (2–5x passive)
Best for
Residential and small C&I (under 500 kWh)
Utility-scale and high-cycle BESS (over 500 kWh)
🧠 Interactive BMS Balancing Simulator
Simulate how a BMS manages individual cell drift and balances a 4-cell LFP pack.
🔋 Current Cell Status (Target: 3.40V)
Cell 1 (Balanced):3.40V
Cell 2 (High Spike / Overcharge Risk):3.55V
Cell 3 (Balanced):3.40V
Cell 4 (Weak / Low Capacity):3.25V
⚡ Step 2: Trigger BMS Balancing Strategy
BMS Operational Status
Status: Standby (Imbalance Detected)
Pack efficiency is restricted by Cell 4. Select a balancing method above to view the electronic correction process.
*Visualized example based on a standard 4S LiFePO4 configuration operating near upper knee voltage thresholds.*
5. How the Battery Management System Estimates SOC (State of Charge)
Essentially, SOC is the fuel gauge of your battery. It shows how much energy is stored, expressed as a percentage of full capacity. Accurate SOC is essential for safe operation and efficient dispatch.
Importantly, SOC cannot be measured directly. Instead, it must be estimated from measurable quantities — voltage, current, and temperature. The BMS uses one or more algorithms to do this. Each method has distinct strengths and trade-offs.
Method 1: Open Circuit Voltage (OCV) Lookup
Specifically, this is the simplest SOC estimation method. When a battery has rested for 30–60 minutes, its Open Circuit Voltage maps to SOC via a lookup table. The table is built from cell characterisation tests.
However, OCV works poorly for LiFePO4. LFP has a very flat voltage curve between 20% and 80% SOC. Small voltage changes correspond to large SOC swings in this region. As a result, OCV-based SOC is inaccurate during normal operation. It is mainly useful for setting the initial estimate after a long rest period.
Method 2: Coulomb Counting
Coulomb counting integrates current over time. It tracks how much charge has entered or left the battery. As a result, it is the most widely used SOC method in real-time operation.
Coulomb counting is accurate over short periods. However, it accumulates error over time due to sensor tolerances, temperature effects, and small unmeasured currents. Without periodic recalibration, the estimate drifts.
Best practice: In practice, reset SOC to 0% or 100% when the battery hits its cutoff voltage. These anchor points correct accumulated drift effectively.
Method 3: Extended Kalman Filter (EKF)
The Extended Kalman Filter is the most accurate SOC method available. It combines Coulomb counting with a mathematical model of the battery’s electrochemical behaviour. Consequently, it corrects the estimate continuously based on the gap between model prediction and actual voltage.
EKF handles LFP’s flat voltage curve far better than OCV. It adapts in real time to temperature changes, aging effects, and varying loads. Furthermore, premium BMS platforms from Texas Instruments, Analog Devices, and Orion BMS use EKF or adaptive Kalman variants.
The trade-off: EKF requires significant processing power and a well-characterised cell model. It is, consequently, computationally demanding and needs careful tuning for each chemistry.
SOC Method
Accuracy
LFP Suitability
Typical Use
Open Circuit Voltage
±5–10% in flat region
Poor — flat curve limits accuracy
Initial SOC after rest period only
Coulomb Counting
±3–5% short term, drifts over time
Good for real-time tracking
Residential and most C&I systems
Extended Kalman Filter
±1–2% with good cell model
Excellent — handles flat curve well
Utility-scale BESS and precision apps
6. How the Battery Management System Tracks SOH (State of Health)
State of Health (SOH) measures how much of a battery’s original capacity remains. A new battery starts at 100% SOH. Each cycle causes a small, permanent capacity loss. Consequently, the BMS tracks this degradation over the system’s lifetime.
Specifically, SOH is defined as: SOH (%) = (Current Capacity ÷ Original Rated Capacity) × 100.
Notably, End of Life (EOL) is declared when SOH drops to 80% — or 70% in some industrial applications. For more on how EOL thresholds work in practice, see our Battery Cycle Standards guide.
How SOH Is Estimated Over Time
SOH cannot be measured with a single reading. Instead, the BMS builds up estimates using several data sources accumulated over time:
Capacity fade tracking — comparing measured full-charge capacity against original rated capacity
Internal resistance measurement — resistance increases as cells age; higher resistance correlates with lower SOH
Cycle counting — simple but imprecise; does not account for partial cycles or varying depth of discharge
Incremental Capacity Analysis (ICA) — an advanced technique that analyses the dV/dQ curve to detect electrochemical aging signatures
SOH Logging and Warranty Compliance
Accurate SOH logging matters for two reasons. First, it supports warranty claims. Most BESS warranties guarantee a minimum SOH at a set cycle count — for example, 80% SOH at 6,000 cycles. The BMS is the primary evidence source for any claim.
Second, SOH logging is becoming a regulatory requirement. The EU Digital Battery Passport, mandatory from February 2027 under EU Batteries Regulation 2023/1542, requires SOH history, cycle count, and energy throughput data. The battery management system is the primary source for all of it.
📊 Battery Management System SOH and Warranty Compliance A BMS that accurately logs SOH over time — with timestamped cycle data — makes warranty claims straightforward. A BMS without proper SOH logging, however, creates disputes. Always ask what SOH data is recorded, how long it is stored, and in what format it can be exported.
7. Battery Management System Requirements: LiFePO4 vs. NMC
LFP and NMC place very different demands on the battery management system — especially for SOC estimation and thermal monitoring speed
LiFePO4 (LFP) and NMC place very different demands on the battery management system. Understanding these differences, therefore, helps you confirm that a supplier’s BMS is genuinely designed for their stated chemistry. A BMS reused from a different application, for instance, will often perform poorly on LFP.
SOC Accuracy: Why LFP and NMC Differ
LFP’s flat voltage curve — discussed in Section 5 — makes SOC measurement significantly harder than NMC. An NMC cell’s voltage, in contrast, changes continuously and predictably with SOC. LFP, however, sits near 3.2V–3.3V across 80% of its SOC range. As a result, OCV lookup is unreliable for LFP in real-time operation.
Consequently, a BMS designed for NMC but deployed on LFP cells will show poor SOC accuracy. This leads to premature shutdowns or unexpected overcharge events. Always, therefore, confirm the BMS SOC algorithm is specifically calibrated for LFP chemistry.
Thermal Monitoring: NMC Is More Demanding
NMC cells are more temperature-sensitive than LFP. Specifically, they degrade significantly above 35°C and have a lower thermal runaway threshold — 150°C to 210°C versus 270°C to 300°C for LFP.
As a result, an NMC battery management system requires:
Temperature monitoring intervals of every 100–500ms — versus every 1–2 seconds for LFP
Faster thermal runaway response — disconnection in milliseconds when temperature spikes
More temperature sensors per module — to catch hot spots before they spread
Integration with active liquid cooling systems — which are common in NMC BESS
NMC cells are damaged more easily by small voltage excursions above the charge cutoff. As a result, a BMS protecting NMC must enforce tighter tolerances — typically ±5mV per cell versus ±10–20mV for LFP. It must also respond faster when a cell approaches its limit.
BMS Function
LiFePO4 (LFP)
NMC
SOC algorithm required
Coulomb counting or Kalman filter essential (flat curve)
OCV lookup or Coulomb counting (clearer voltage slope)
Voltage tolerance per cell
±10–20mV
±5mV — much tighter
Temperature monitoring interval
Every 1–2 seconds typical
Every 100–500ms — faster response needed
Thermal runaway response
Standard — higher threshold
Fast — lower runaway threshold (150–210°C)
Active cooling integration
Optional in most deployments
Often required
Overall BMS complexity
Standard
Higher on all parameters
8. Battery Management System Certifications: Which Standards Apply
As a safety-critical component, the battery management system must, therefore, comply with the relevant standards for each market where the BESS will be installed. Certification covers both the BMS hardware itself and the complete battery system.
Standard
Scope
BMS Relevance
UL 1973
Stationary lithium battery systems
Cell, module, and BMS safety — required for US market access
UL 9540
Complete BESS system safety
BMS must demonstrate system-level protection functions
IEC 62619
Safety for lithium-ion batteries
International standard covering BMS protection requirements
IEC 62933-5
ESS safety framework
Covers BMS communication, monitoring, and fault response
UN 38.3
Transport safety for lithium batteries
BMS must survive vibration, altitude, and thermal tests
EU 2023/1542
EU Batteries Regulation
BMS data required for Digital Battery Passport from 2027
The EU Digital Battery Passport and BMS Data
Specifically, the EU Digital Battery Passport becomes mandatory in February 2027 for industrial and EV batteries above 2 kWh. It is a QR-code record containing a battery’s full lifecycle data — SOH history, cycle count, energy throughput, and temperature exposure.
The battery management system is the primary data source for this passport. Consequently, any BESS sold into the EU after 2027 must have a BMS that records and exports this data in a compliant format. BMS data logging is, therefore, no longer just a technical feature. It is a regulatory requirement. For a full breakdown, see our EU 2023/1542 compliance guide.
9. How to Evaluate a Commercial Battery Management System
Most buyers evaluate batteries on capacity, cycle life, and price. The BMS is then treated as a given. That is a mistake. These eight questions, therefore, separate a robust battery management system from one that will cause problems in the field.
Questions 1–4: Protection and Accuracy
Question 1: Is cell-level voltage monitoring standard — or only pack-level?
Cell-level monitoring is non-negotiable. A BMS that only monitors overall pack voltage cannot prevent localised overcharge or over-discharge. Always, therefore, confirm cell-level monitoring is standard — not an add-on.
Question 2: What SOC algorithm is used — and is it calibrated for the cell chemistry?
If a supplier cannot answer this clearly, that is a red flag. OCV-based SOC on LFP is inaccurate. Ask whether Coulomb counting, Kalman filtering, or a hybrid method is used. Furthermore, confirm it is tuned for the specific cell chemistry in your system.
Question 3: Is balancing passive or active — and what is the balancing current?
For high-cycle applications or systems above 500 kWh, active balancing is preferable. For smaller residential systems, passive balancing at 100 mA or above is adequate. In contrast, a balancing current under 50 mA in a large pack is a warning sign.
Question 4: How fast does the BMS respond to overcurrent and thermal events?
Short circuit response must be in microseconds. Thermal runaway disconnection must happen in under 100ms. Specifically, ask for the fault response time in the specification — not just a general claim that protection exists.
Questions 5–8: Communication, Data, and Certification
Question 5: What communication protocols are supported?
Confirm the BMS communicates with your inverter and EMS. CAN bus and Modbus RTU are the most common protocols. Additionally, cloud connectivity via MQTT or TCP-IP is increasingly important for monitoring and Battery Passport data exports.
Question 6: Does the BMS log SOH and cycle data — and for how long?
SOH logging is essential for warranty claims and EU Battery Passport compliance. Ask how many years of data is stored, which parameters are logged, and how the data is exported. Consequently, a BMS with no data export capability is a liability for EU market sales after 2027.
Question 7: What happens to cell protection if the master controller fails?
In a master-slave BMS, slave modules must maintain cell-level protection independently — even without master communication. A system where protection depends entirely on the master creates a single point of failure. Therefore, always ask this question before signing.
Question 8: Which certifications does the BMS hold — and can you provide test reports?
UL 1973, IEC 62619, and IEC 62933-5 are the key standards. A reputable supplier provides full test documentation — not just a certificate summary. If they hesitate, that is therefore a red flag.
10. Common Battery Management System Failure Modes
Common battery management system failure modes and how to prevent each one in a BESS installation
Understanding how a battery management system can fail helps you design systems with the right redundancy. It also helps you evaluate suppliers whose BMS architecture accounts for these risks.
Failure Mode
Consequence
Prevention
Voltage sensor drift
Incorrect SOC — risk of overcharge or over-discharge
Dual redundant sensors; periodic recalibration against known references
Temperature sensor failure
Missed thermal event — possible thermal runaway
Multiple sensors per module; cross-validation between sensors
Balancing circuit failure
Cell imbalance grows; usable capacity shrinks
Active monitoring of balancing currents; SOC spread alerts
Master-slave communication loss
Master loses visibility of module status
Slaves maintain local protection; heartbeat watchdog triggers alarm
Contactor weld failure
BMS cannot disconnect pack during a fault
Pre-charge circuits; contactor health monitoring; dual contactors on large systems
OTA firmware updates; staged rollouts; version logging with rollback capability
11. The Battery Management System in a Complete BESS: System Integration
Importantly, the battery management system does not operate in isolation. In a complete BESS, it sits at the centre of a data and control network — connecting cells to the inverter, the EMS, the monitoring platform, and the thermal management system.
Connecting to the Inverter
The BMS sends SOC, available power, voltage, and fault status to the inverter in real time. The inverter uses this data to manage charge and discharge rates and respect SOC limits. It also triggers a soft shutdown when the battery approaches empty.
Without reliable BMS-to-inverter communication, the inverter operates blind. As a result, overcharge or deep discharge events become possible.
Connecting to the Energy Management System (EMS)
The EMS sits above the BMS in the control hierarchy. It uses BMS data to decide when to charge, when to discharge, and how much power to commit to a grid services contract. Consequently, a BMS that cannot communicate reliably with the EMS limits the system’s ability to optimise for economics.
To understand how BESS economics work in practice, see our guide on calculating BESS ROI.
Connecting to Remote Monitoring Platforms
Cloud-connected monitoring platforms use BMS data to track performance and flag early warnings. Typical parameters include SOC, SOH, cell voltage spread, temperatures, energy throughput, and fault logs. Moreover, this data is increasingly required for EU Battery Passport compliance after 2027.
Connecting to Thermal Management Systems
In systems with active cooling — fans or liquid cooling — the BMS directly controls the thermal hardware. It turns cooling on and off based on real-time cell temperature readings. In liquid-cooled NMC systems, this link is especially critical. In LFP systems, thermal management is simpler — but still important in warm climates or poorly ventilated enclosures.
Conclusion: The Battery Management System Is Not a Commodity
The battery management system determines whether a BESS is safe. It also determines whether cells reach their rated cycle life — and whether capacity is fully used. It is, therefore, not a component to be cut from the bill of materials.
Here are the key takeaways from this guide:
Cell-level voltage and temperature monitoring are non-negotiable in any lithium system
SOC algorithm choice matters enormously — especially for LFP’s flat voltage curve
Balancing method should match your cycle frequency and system size
SOH logging is now a regulatory requirement under the EU Battery Passport — not just a technical feature
BMS architecture must scale with system size: single-level for residential, master-slave for commercial and utility
Use the eight evaluation questions above before accepting any supplier’s BMS specification
Overall, whether you are designing a 10 kWh home system or a 10 MWh grid-scale BESS, the battery management system deserves the same scrutiny as the cells. A good BMS extends the life of average cells. A poor BMS, in contrast, shortens the life of great ones.
☀️ Need a Battery Management System Review for Your BESS Project? Sunlith Energy reviews BMS specifications and supplier documentation for BESS projects from 50 kWh upward. Specifically, we identify gaps in protection architecture, SOC algorithm suitability, and certification compliance — before you sign a purchase order. Contact us
Frequently Asked Questions About the Battery Management System
Does a LiFePO4 battery need a BMS?
Yes — without exception. LiFePO4 is chemically stable, but it still needs a battery management system. Specifically, the BMS prevents overcharge, over-discharge, short circuit, and thermal damage. No reputable BESS supplier ships lithium cells without one.
What is the difference between a BMS and a battery controller?
The battery management system monitors and protects individual cells and modules. A battery controller — or Master BMS — manages the full system and coordinates with the inverter and EMS. In simple residential systems, one device does both. In large commercial systems, however, they are typically separate hardware.
Can a BMS extend battery life?
Yes — significantly. A BMS keeps cells within safe voltage and temperature limits. It also maintains good cell balance and enforces appropriate C-rate limits. As a result, it extends cell life considerably compared to unprotected operation.
This depends on your inverter and EMS. CAN bus is most common in high-performance systems. Modbus RTU over RS485, however, is standard in commercial and industrial storage. Check your inverter’s compatibility list first — mismatched protocols require additional gateway hardware and add cost and complexity.
How do I know if my BMS is failing?
Watch for these warning signs: SOC readings that jump unexpectedly; growing cell voltage spread, which indicates poor balancing; shutdowns not caused by actual low SOC; temperature readings that are static or incorrect; and fault codes that repeat in the log without a clear cause. In particular, growing cell voltage spread is often the earliest signal of BMS trouble.
Remote monitoring platforms are, therefore, the most reliable early detection tool. They flag SOC spread and temperature anomalies before they become failures.
The Ah vs Wh debate comes up every time you shop for a battery. You see both numbers on every spec sheet. However, most buyers ignore one of them. That is a costly mistake. Ah and Wh measure different things. Confusing them leads to choosing the wrong battery size.
In this guide, Sunlith Energy breaks down both measurements. You will learn the formula that links them. Additionally, you will see real conversion examples. Furthermore, we share a step-by-step method to size your own battery system correctly.
According to the International Energy Agency, battery storage is central to the global clean energy transition. Therefore, understanding how battery capacity is measured matters more than ever. Every buyer deserves to get this right.
⚡ Quick Answer: Ah vs Wh Ah measures electric charge — how much current a battery delivers over time. Wh measures actual energy — charge multiplied by voltage. The formula: Wh = Ah × Voltage. For example, 100 Ah at 48V = 4,800 Wh. In contrast, 100 Ah at 12V = only 1,200 Wh. As a result, Wh is always the better metric for comparing batteries across different systems.
What Does Ah Mean? The Charge Side of Ah vs Wh
Ah stands for Amp-hours. It measures electric charge. Specifically, it tells you how many Amps a battery delivers and for how long.
The rule is simple. One Ah means 1 Amp delivered for exactly 1 hour. However, it could also mean 2 Amps for 30 minutes. Alternatively, it could be 10 Amps for 6 minutes. The total charge is always the same — only the rate changes.
🚿 Think of Ah Like a Garden Hose Ah is the tank size. A 100 Ah battery holds enough charge for 100 Amps over 1 hour. Turn the tap up — it drains faster. Turn it down — it lasts longer. However, the total water in the tank stays the same.
When to Use Ah in the Ah vs Wh Decision
Calculating runtime — how long a battery powers a fixed-current device
Setting charge rates — C-rate is always expressed relative to Ah
Designing battery banks — when all batteries share the same voltage
Comparing batteries of identical voltage side by side
There is one important limitation. Ah is voltage-independent. Therefore, a 100 Ah battery at 12V and a 100 Ah battery at 48V have the same Ah rating. Even so, they store very different amounts of energy. That is the most common battery-buying mistake.
Wh stands for Watt-hours. It measures actual energy. Because it accounts for voltage, Wh is the more complete measurement.
Furthermore, battery energy density is expressed in Wh/kg. So understanding Wh also helps you compare weight-to-energy ratios across different chemistries.
💧 Wh = Pressure × Volume If Ah is the tank size, Wh is the total force the water delivers. That force depends on volume AND pressure (voltage). In contrast to Ah, Wh gives you the full energy picture. More voltage means more energy for the same Ah.
When to Use Wh in the Ah vs Wh Decision
Comparing batteries at different voltages — for example, 12V vs 48V
Good news: only one formula connects Ah and Wh. Voltage is the bridge between them.
Wh = Ah × Voltage (V) Reversed: Ah = Wh ÷ Voltage For mAh: Wh = (mAh ÷ 1000) × Voltage
⚡ Interactive Ah ⇄ Wh Calculator
Calculated Result
4,800 Wh (4.8 kWh)
This explains why two batteries with the same Ah can store very different energy. Higher voltage multiplies charge into more usable Wh. As a result, 48V systems deliver far more energy per Ah than 12V setups. That is why 48V has become the standard for modern residential solar.
Ah vs Wh Conversion Examples — Real Numbers
Below are three practical examples. Each one shows how to apply the Ah vs Wh formula step by step.
Example 1 — Home Solar Battery (LiFePO4, 48V) → Battery rated: 100 Ah at 48V nominal → Formula: Wh = 100 × 48 ✅ 4,800 Wh (4.8 kWh) — runs a full-size fridge for about 2 full days
Example 2 — Portable Power Station (12V) → Battery rated: 50 Ah at 12V nominal → Formula: Wh = 50 × 12 ✅ 600 Wh — charges a laptop approximately 10 times
Example 3 — Smartphone Battery (mAh to Wh) → Battery rated: 5,000 mAh at 3.7V → Step 1: 5,000 ÷ 1,000 = 5 Ah → Step 2: Wh = 5 × 3.7 ✅ 18.5 Wh — a typical mid-range smartphone battery
⚡ Quick mAh Shortcut For 3.7V lithium cells: Wh ≈ mAh × 0.0037. Therefore, a 10,000 mAh power bank ≈ 37 Wh. Never compare mAh values from batteries with different voltages. Because voltage differs, the mAh number alone tells you nothing about energy.
Ah vs Wh — Which Metric Should You Use?
Both measurements are useful. However, the right choice depends on your question. Use this table as a quick reference:
Your Question
Use
Why
How long will my device run?
Ah
Runtime = Ah ÷ current draw
Which battery stores more energy?
Wh
Wh compares across voltages
Can I run a 100 W device for 3 hrs?
Wh
300 Wh needed — easy math
How fast can I charge this battery?
Ah
C-rate is always Ah-based
LiFePO4 vs NMC — which has more?
Wh
Different voltages make Ah wrong
Sizing solar panels and controller?
Ah
Fixed-voltage design uses Ah
Airline carry-on battery limits?
Wh
IATA rules: 100 Wh / 160 Wh
In summary: use Ah for current and time calculations within a fixed-voltage system. For everything else, use Wh. Comparing batteries across voltages or chemistries? Wh is always the right choice.
Same Ah, Very Different Energy — Why Voltage Changes Everything
Many buyers compare batteries on Ah alone. This is a common and expensive mistake. Voltage changes everything. Below is a clear example:
Battery
Ah
Voltage
Energy (Wh)
Powers...
Van / camping pack
50 Ah
12V
600 Wh
Laptop ~10×
Home 12V bank
100 Ah
12V
1,200 Wh
Fridge ~12 hrs
Home 24V bank
100 Ah
24V
2,400 Wh
Fridge ~24 hrs
Solar 48V system
100 Ah
48V
4,800 Wh
Fridge ~2 days
C&I 48V system
200 Ah
48V
9,600 Wh
Office ~1 day
As the table shows, identical Ah ratings hide very different energy levels. Consequently, always convert to Wh before comparing. For more on how chemistry affects this, see our LiFePO4 vs NMC battery guide.
What Reduces Your Real-World Ah vs Wh Capacity?
Battery labels show the theoretical maximum. In practice, usable capacity is always lower. Several factors reduce what you actually get. Understanding them is essential for accurate sizing.
1. Depth of Discharge (DoD)
Most batteries should not be fully drained. Doing so permanently damages cells. The safe depth of discharge varies by chemistry:
LiFePO4: 80–90% DoD — consequently, usable Wh = 80–90% of rated Wh
Lead-acid: only 50% DoD — therefore, you lose half your rated capacity
NMC: typically 80–85% for a long cycle life
2. Temperature
Cold weather hurts batteries significantly. Below 10°C, deliverable Ah drops by 20–30%. Temperature directly impacts LiFePO4 cycle life — a rise of 10°C above 25°C can halve total cycle life. Heat, on the other hand, temporarily boosts apparent capacity. However, it accelerates permanent degradation at the same time.
3. Discharge Rate (C-Rate)
Drawing current too fast reduces total Wh delivered. For example, a battery discharged at 2C gives fewer Wh than the same battery at 0.5C. Always check the C-rate used during the manufacturer's Ah test. Because a 0.2C rating looks far better than real-world 1C performance.
4. Battery Aging
Every cycle causes a small, permanent capacity loss. At 500 cycles, most batteries retain about 90%. At 1,000+ cycles, the best LiFePO4 cells still retain 70–80%. Consequently, factor aging into your long-term Wh budget when sizing.
5. System Efficiency Losses
Inverters, charge controllers, wiring, and BMS all consume energy. Modern lithium systems typically achieve 85–95% round-trip efficiency. Therefore, add a 10–15% buffer on top of your calculated Wh need. This protects you from real-world losses.
This efficiency depends heavily on how well the battery management system manages charge and discharge cycles — learn how a BMS works
How to Size Your Battery System Using Ah vs Wh
Now let's put it all together. Below is a simple four-step sizing method. It is the same approach used in our solar battery sizing guide.
Step 1 — Calculate Your Daily Wh Requirement
List every appliance you want to power. Write down its wattage and daily run hours. Multiply watts by hours for each device. Then add them all together. For example: a 50W fridge runs 24 hours = 1,200 Wh. Four 25W LED lights run 5 hours = 500 Wh. Total: 1,700 Wh per day. Additionally, add 10% for hidden standby loads — bringing the total to about 1,870 Wh.
Step 2 — Apply the Depth of Discharge
Divide your daily Wh by the safe DoD. For LiFePO4 at 80% DoD: 1,870 ÷ 0.80 = 2,338 Wh of rated capacity needed. This step is essential. It ensures you never drain the battery below its safe limit. As a result, both lifespan and warranty are protected.
Step 3 — Add a Safety Margin
Multiply your result by 1.15 to 1.20. This covers system losses, aging, and seasonal variation. In our example: 2,338 × 1.20 = 2,806 Wh minimum rated capacity. Therefore, look for a battery bank rated at or above 2,800 Wh.
Step 4 — Convert Wh Back to Ah
Use Ah = Wh ÷ Voltage. At 48V: 2,806 ÷ 48 ≈ 58 Ah. At 24V: 2,806 ÷ 24 ≈ 117 Ah. At 12V: 2,806 ÷ 12 ≈ 234 Ah. As a result, higher-voltage systems need far fewer Ah. That is why 48V has become the industry standard for residential solar.
☀️ Sunlith Off-Grid Tip For solar or off-grid systems, size for at least 2 days without sun. Multiply your daily Wh by 2 before applying DoD and the safety margin. This protects against cloudy days and seasonal dips. → Read more: Ultimate Guide to Battery Energy Storage Systems (BESS)
Ah vs Wh — Frequently Asked Questions
Q: Is a higher Ah battery always better?
No — not always. A higher Ah means more charge, not more energy. Voltage is the missing piece. For example, 200 Ah at 12V = 2,400 Wh. However, 100 Ah at 48V = 4,800 Wh. Therefore, always compare Wh — not Ah alone.
Q: Can I compare a 12V 100 Ah battery with a 24V 100 Ah battery?
No — not on Ah alone. Convert both to Wh first. 100 × 12 = 1,200 Wh. In contrast, 100 × 24 = 2,400 Wh. The 24V battery stores twice the energy. For a full chemistry breakdown, see our LiFePO4 vs NMC battery guide.
Q: What does 100 Ah mean in practical terms?
A 100 Ah battery delivers 100 Amps for 1 hour. Alternatively, it delivers 10 Amps for 10 hours. Furthermore, it delivers 1 Amp for about 100 hours. In a 12V system, 100 Ah = 1,200 Wh. In a 48V system, 100 Ah = 4,800 Wh. Additionally, apply the DoD to find the safe, usable portion.
Q: How many Wh do I need for an off-grid solar system?
A small cabin typically needs 1–3 kWh per day. A home averages 10–30 kWh per day. Furthermore, size for 2 days of autonomy for cloudy periods. Our detailed solar sizing guide walks through the full calculation with examples.
Q: Does temperature affect Ah vs Wh?
Yes — it affects both. Cold temperatures reduce deliverable Ah. Consequently, usable Wh also drops. High heat temporarily boosts apparent capacity. However, it causes permanent degradation over time. LiFePO4 handles temperature extremes better than NMC. For the full data, see our post on temperature impact on LiFePO4 cycle life.
Q: What is the difference between mAh and Ah?
mAh means milliamp-hours. There are 1,000 mAh in 1 Ah. Consumer devices use mAh because the numbers are easier to read. To convert: divide mAh by 1,000 to get Ah. Then multiply by voltage to get Wh. For example: 5,000 mAh ÷ 1,000 × 3.7V = 18.5 Wh.
Q: What Wh limits apply to lithium batteries on aeroplanes?
According to IATA's Lithium Battery Guidance, passengers may carry batteries up to 100 Wh without airline approval. Batteries between 100 Wh and 160 Wh require specific approval. Batteries above 160 Wh are generally not allowed in carry-on. Because rules vary by carrier, always confirm with your airline before travelling.
Q: Is LiFePO4 better than NMC for solar storage?
In most cases, yes. LiFePO4 offers better thermal safety and a longer cycle life. Its thermal runaway threshold is ~270–300°C, versus ~150°C for NMC. Furthermore, LiFePO4 performs more consistently in extreme temperatures. In contrast, NMC offers higher energy density — so it suits weight-constrained applications better. Compare both in our NMC vs LFP safety guide.
Q: Do BESS systems need certifications?
Yes — especially for commercial or grid-connected installations. Key certifications include UL 9540, IEC 62619, and CE Marking. Our BESS certifications guide covers every major standard required in 2026, what each tests, and the cost of skipping them.
Q
Conclusion — Ah vs Wh Made Simple
Knowing the Ah vs Wh difference saves you from bad battery decisions. Ah measures charge. Wh measures energy. The formula Wh = Ah × Voltage connects them. Use Ah for runtime and charge rate calculations. For everything else — especially cross-voltage comparisons — use Wh.
Additionally, always apply DoD, temperature effects, C-rate, and aging when estimating real-world usable capacity. The number on the label is a theoretical maximum. Your actual usable capacity will always be lower.
Whether you are planning a home solar install or a commercial BESS project, the Ah vs Wh distinction is the right place to start. Get it right — and every other sizing decision becomes easier.
Need Help Choosing the Right Battery? Our Sunlith Energy experts size your system — solar, BESS, off-grid, or C&I. No jargon. No pressure. Contact us: sunlithenergy.com/contact Browse our solutions: sunlithenergy.com