AC-coupled vs DC-coupled BESS is one of the first choices you’ll face in any solar-plus-storage project. This one decision shapes your system’s efficiency, cost, and how easily you can expand it later. Both architectures store solar energy in a battery for later use. But they connect the battery in different places relative to the inverter, and that single design choice ripples through nearly every other spec on the system. This guide walks through the differences so you can pick the right fit.
What Is AC-Coupled BESS?
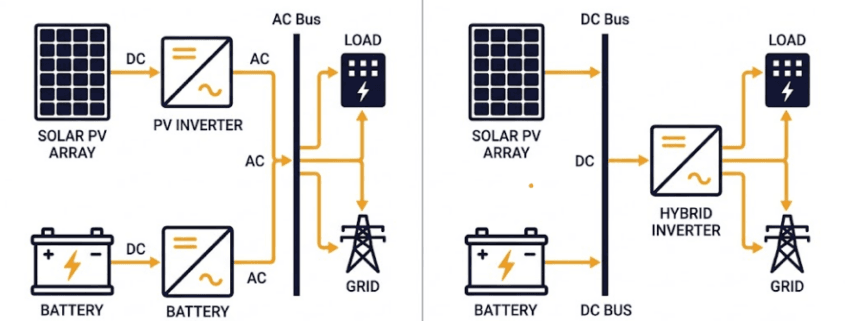
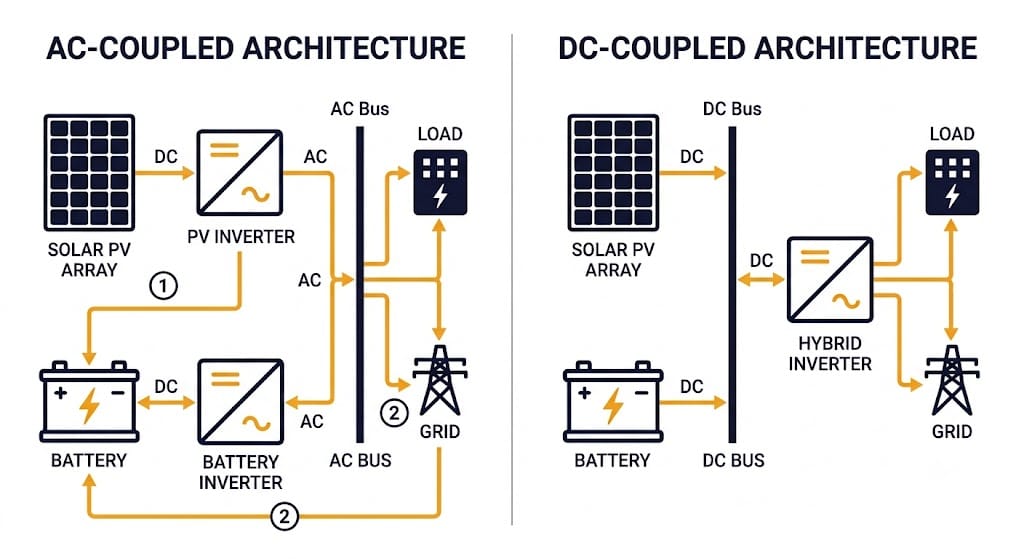
An AC-coupled BESS connects the battery to the grid through its own dedicated inverter. This component sits separate from the solar PV inverter. Power from PV and power from the battery meet on the AC side of the system rather than sharing a DC bus. This makes AC-coupled storage the more common choice when you’re adding a battery to solar you already have running. For the full breakdown of components and operation, see What is AC Coupled BESS?.
What Is DC-Coupled BESS?
A DC-coupled BESS connects the battery and the solar PV array on the same DC bus, ahead of a single shared inverter. Because both share one conversion path, DC-coupled systems typically post better round-trip efficiency and lower equipment costs, at the expense of retrofit flexibility. For the full architecture and step-by-step operation, see What is DC Coupled BESS?.
AC-Coupled vs DC-Coupled BESS: Side-by-Side Comparison
Here’s the AC-coupled vs. DC-coupled BESS comparison at a glance — the factors that matter most when you design a solar-plus-storage system:
Factor
AC-Coupled BESS
DC-Coupled BESS
Connection point
Battery connects via its own inverter on the AC side
Battery and PV share one DC bus, ahead of a single inverter
Inverters required
Two — one for PV, one for battery
One shared hybrid inverter
Conversion stages
Multiple DC-AC-DC conversions on some charge paths
Single DC-to-AC conversion for grid/load power
Round-trip efficiency
Lower — extra conversion stages add losses
Higher — fewer conversion losses
Balance-of-system cost
Lower than standalone, but higher than DC-coupled (separate inverters, switchgear)
Lowest of the three — shared inverter and BOS hardware
Best for
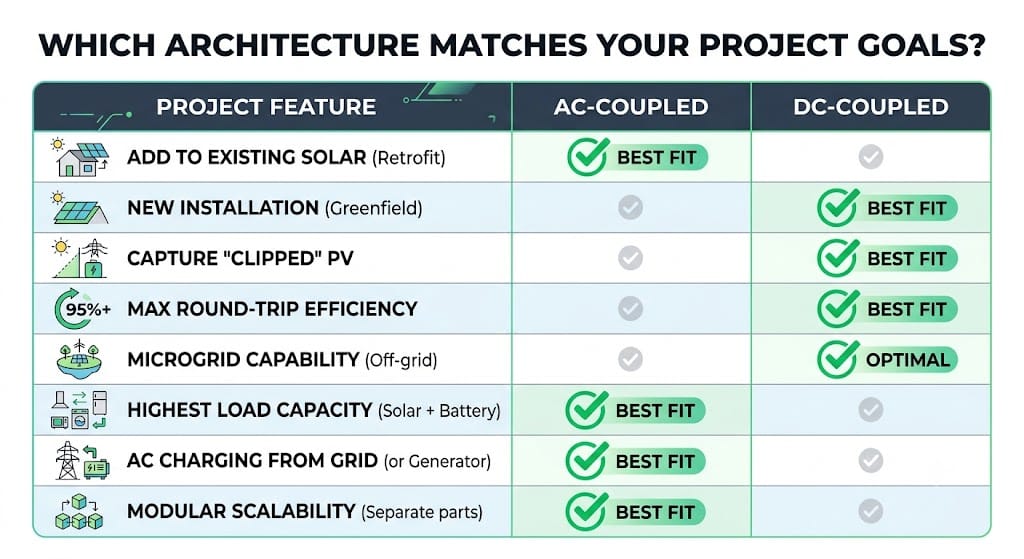
Retrofitting storage onto existing solar
New-build, greenfield solar-plus-storage projects
Solar charging during outage
Depends on inverter design; may need extra hardware
Typically yes, in most configurations
Curtailment / clipping capture
Limited — PV inverter still governs PV output
Can capture otherwise-clipped PV energy behind a higher-ILR array
Grid response speed
Slower — control system coordinates multiple inverters
Faster — single inverter, more direct control path
Future expansion
Easier — PV and storage can be sized/upgraded independently
Harder — added battery capacity must match existing DC bus voltage
No single architecture wins on every factor. The right choice depends on your project type and how much you weigh upfront cost against long-term efficiency.
AC-Coupled vs DC-Coupled BESS: Efficiency Compared
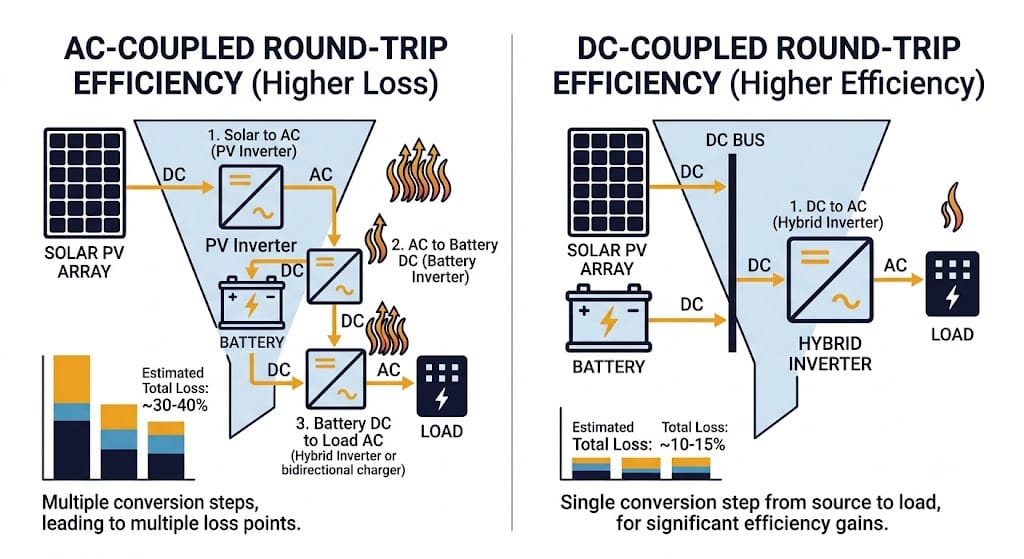
Every DC-to-AC conversion wastes some energy as heat. An AC-coupled system can convert PV energy to AC, then back to DC to charge the battery, then to AC again when you use it. That’s up to three conversion stages on some charge paths.
A DC-coupled system skips most of that. It charges the battery straight from the DC bus and converts to AC only once, when you actually need AC power. This is the core reason DC-coupled architectures tend to post higher round-trip efficiency in side-by-side testing.
Both architectures cost less than siting solar and storage separately. DC-coupled systems generally cost less than AC-coupled ones on new-build projects, too.
The U.S. Department of Energy’s Solar-Plus-Storage 101 resource confirms this pattern: co-locating PV and storage on the same site cuts system cost compared to siting them separately, whether you choose AC-coupled or DC-coupled. Most of the savings come from shared balance-of-plant infrastructure.
DC-coupled designs push those savings further. They eliminate a full second inverter and its switchgear. That said, retrofit constraints can narrow this advantage — if AC-coupling is your only practical option, the smaller cost gap may not matter much.
Retrofit vs. Greenfield: Matching Architecture to Project Stage
Project stage often decides the outcome before cost or efficiency even enter the conversation.
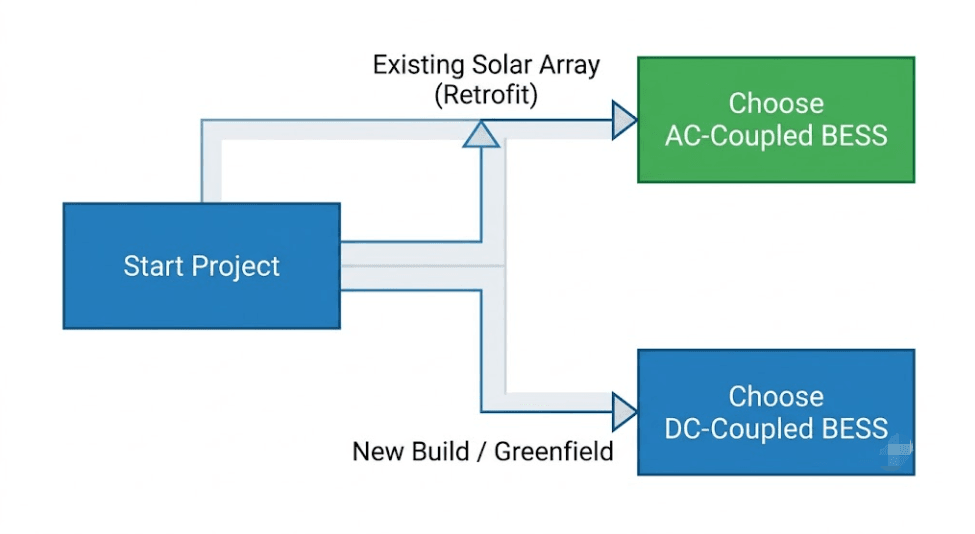
If you already run solar, adding a DC-coupled battery means tying into the existing DC bus and matching its voltage. That’s technically possible, but it usually means replacing or reconfiguring your existing inverter. AC-coupled storage sidesteps that problem entirely — the battery gets its own inverter and connects on the AC side, so your existing solar installation stays untouched.
New-build, greenfield projects don’t face that constraint, since you design PV and storage together from day one. That’s why DC-coupled architectures dominate new utility-scale and C&I builds. In the end, this AC-coupled vs. DC-coupled BESS decision usually comes down to one question: are you retrofitting, or building new?
When to Choose AC-Coupled BESS
Adding storage to solar you already have running
Projects where you need to size, optimize, or replace PV and battery independently
Sites where minimizing changes to existing PV wiring and permits matters
Phased projects that add storage well after the solar installation
Systems needing simpler expansion of storage capacity over time
When to Choose DC-Coupled BESS
New solar-plus-storage builds where you design PV and storage together from the start
Utility-scale and C&I projects prioritizing round-trip efficiency
Microgrid and off-grid systems needing solar charging during outages
High inverter-loading-ratio PV arrays looking to capture otherwise-clipped energy
Projects where minimizing equipment count and balance-of-system cost is a priority
AC-Coupled vs DC-Coupled BESS: Trade-offs to Weigh
Efficiency and cost aren’t the only variables to weigh.
DC-coupled systems can be harder to expand later. Additional battery capacity generally needs to match the voltage of your existing DC bus. The tighter integration between PV and storage also means a fault on one side can affect the other.
AC-coupled systems avoid that coupling risk and expand more easily. You pay for that flexibility with two inverters, two sets of switchgear, and a somewhat slower response to fast grid commands like frequency regulation, since the control system has to coordinate multiple inverters instead of one.
Weigh these trade-offs against your project’s timeline, budget, and growth plans. That usually beats picking the ‘better’ architecture in the abstract.
Can You Combine AC-Coupled and DC-Coupled BESS?
Some projects don’t have to choose only one. A hybrid architecture can pair DC-coupled storage on a new PV block with an existing AC-coupled asset elsewhere on-site. Or it can phase in DC-coupled storage over multiple project stages. You’ll see this more often on larger utility-scale sites with modular BESS designs. For a broader look at how AC-coupled, DC-coupled, modular, and hybrid designs fit together, see our guide to Understanding Energy Storage System BESS Architectures.
Frequently Asked Questions
Here are quick answers to the AC-coupled vs DC-coupled BESS questions we hear most often:
What is the main difference between AC-coupled and DC-coupled BESS?
AC-coupled systems use two separate inverters — one for solar PV and one for the battery. DC-coupled systems share a single inverter. PV and battery connect to the same DC bus before the system converts power to AC.
Which is more efficient, AC-coupled or DC-coupled BESS?
DC-coupled BESS is generally more efficient because energy converts from DC to AC only once. AC-coupled systems often involve extra conversion stages, especially when charging the battery from solar, and that raises round-trip losses.
Is AC-coupled or DC-coupled BESS cheaper?
DC-coupled systems typically cost less on the balance-of-system side, since they need only one inverter and one set of switchgear. AC-coupled systems cost more upfront, but you can add them incrementally, which sometimes offsets the gap on retrofit projects.
Can I add a DC-coupled battery to an existing solar system?
You can, but it’s more complex than AC-coupling. The battery must connect to the existing DC bus and match its voltage. For most retrofits, AC-coupled storage is the simpler, more common approach.
Does DC-coupled BESS work off-grid?
Yes. DC-coupled architectures generally support off-grid and islanded operation. They can keep charging from solar during a grid outage, which makes them a common choice for microgrid and remote projects.
Why do DC-coupled systems capture more solar energy?
In a DC-coupled system, the battery can charge directly from PV output that would otherwise get clipped when the inverter loading ratio exceeds 1. That’s because the battery sits on the DC side, before the inverter’s AC output limit applies.
Is there a hybrid option that combines AC and DC coupling?
Yes. Some larger projects use a hybrid architecture that pairs DC-coupled storage with an existing AC-coupled asset, or phases DC-coupled storage in over time. You’ll see this more often on utility-scale sites with modular BESS designs.
AC-Coupled vs DC-Coupled BESS: Final Verdict
AC-coupled and DC-coupled BESS both store solar energy for later use, but they get there differently. That difference shows up in efficiency, cost, and how easily the system grows over time.
AC-coupled storage stays the more flexible choice for retrofits and phased projects. DC-coupled architectures tend to win on efficiency and cost for new-build solar-plus-storage systems. The right call comes down to where your project starts, not which architecture is objectively ‘better’.
Whichever direction fits your project, the Sunlith Energy team can help size and specify the right BESS architecture, PCS, and battery configuration for your site.
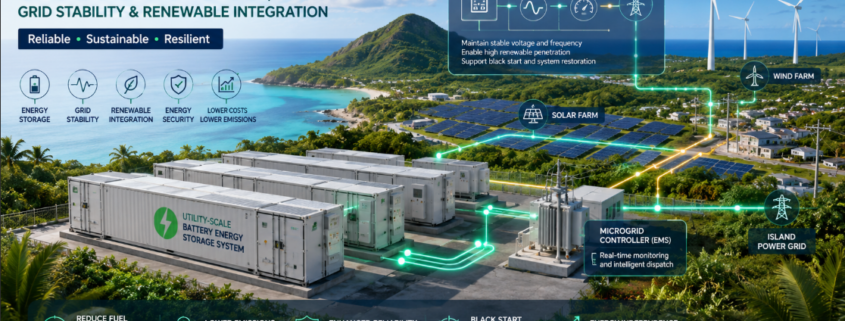
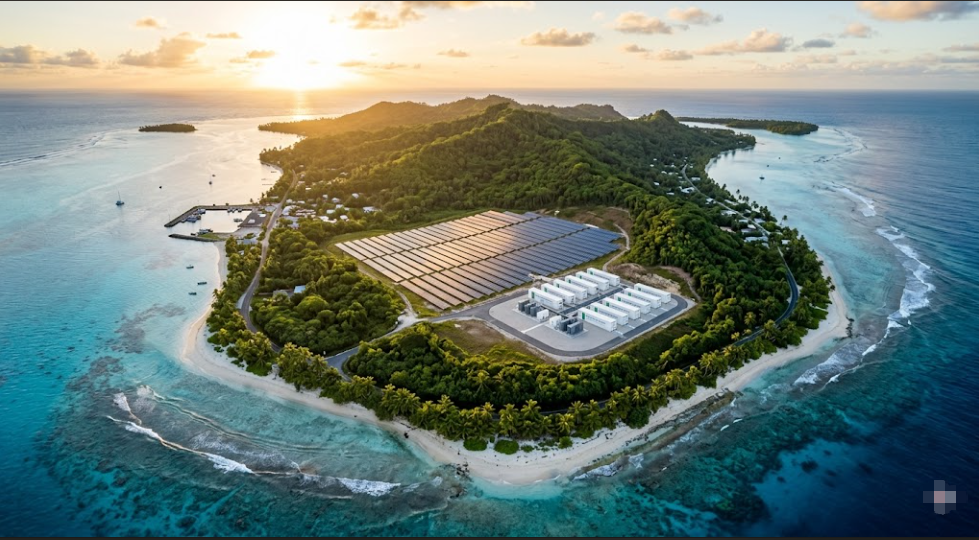
Deploying an Island Grid BESS is the definitive technology fixing one of the most overlooked power problems in the world. More than 10,000 inhabited islands still run on diesel generators. Add remote mining camps, offshore platforms, and rural areas with no grid access — and the scale of the challenge becomes clear.
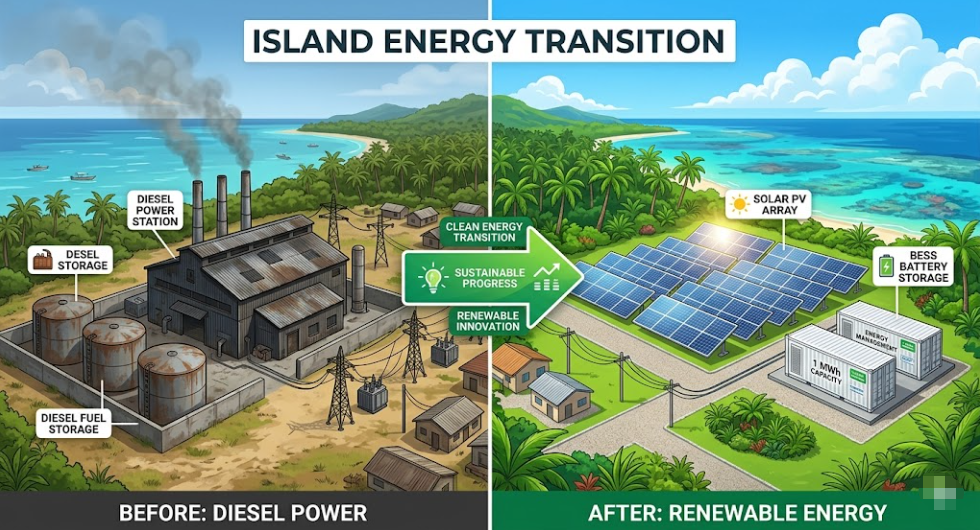
All of these locations share the same problem. They need a stable, reliable grid, but they have no utility to rely on. For decades, diesel was the only answer. Today, in 2026, Island Grid BESS is replacing diesel as the backbone technology. It does so faster, more reliably, and at a lower lifetime cost.
This guide covers everything you need. It explains how Island Grid BESS works and how it differs from standard storage. It also shows you how to size a system, which control architecture to pick, and how to build a strong financial case.
📌 QUICK DEFINITION
What is Island Grid BESS?
Island Grid BESS is a Battery Energy Storage System that acts as the main voltage and frequency source on an isolated network. It has no connection to a utility grid. Unlike a grid-connected BESS that follows an existing grid signal, an Island Grid BESS creates the grid itself. It keeps power stable for all loads using stored energy, renewables, or both.
01 — Why Island Grids Are a Different Engineering Problem
A standard grid-connected BESS has a utility grid behind it as backup. If renewable generation drops or demand spikes, the utility absorbs the imbalance. Frequency and voltage stay stable because thousands of generators share the load.
Island grids, however, have none of that.
No Backup, No Room for Error
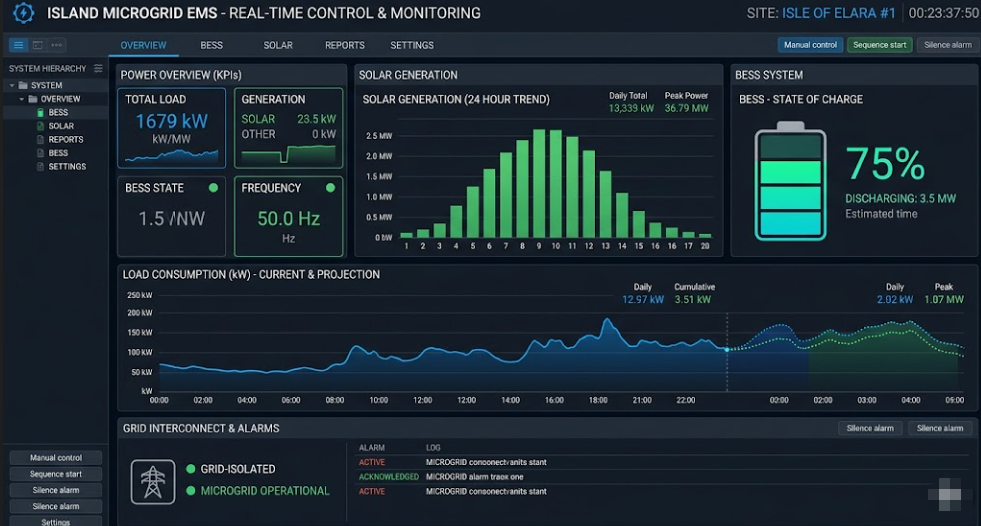
On an island grid, every watt consumed must be generated or discharged locally. There is no utility to fill the gap. When a cloud shadow crosses a solar array, the BESS must respond in milliseconds. When a pump starts, the island grid must match that load instantly.
This is why Island Grid BESS is a different engineering discipline. The physics are harder. The control requirements are stricter. Also, the cost of failure is much higher — a blackout means the entire island or facility loses power.
The Good News: The Technology Has Matured Fast
Despite those challenges, Island Grid BESS technology has improved a great deal since 2022. Systems now running on remote islands in Australia, the Pacific, and Scandinavia are hitting 99.98% availability. That figure is better than the diesel generators they replaced.
02 — Island Grid BESS vs Grid-Connected BESS: Core Differences
The difference between these two systems matters greatly for engineering and procurement. The table below shows the ten most important distinctions.
Dimension
Grid-Connected BESS
Island Grid BESS
Voltage reference
Utility grid provides it
BESS creates it internally
Inverter control mode
Grid-following (GFL)
Grid-forming (GFM) required
Frequency regulation
Supports grid frequency
IS the frequency — no backup
Black start
Not typically required
Mandatory
Fault current
Utility provides it
BESS must supply it
Spinning reserve
Not required
Required at all times
Load sensitivity
Low — utility absorbs swings
High — every load step must be matched
Renewable integration
Flexible
Precise EMS essential
Comms loss tolerance
High
Low — latency affects stability
Design complexity
Moderate
High — full power system design needed
In short: a grid-connected BESS follows the grid. An Island Grid BESS is the grid.
03 — The Four Critical Functions of Island Grid BESS
A well-designed Island Grid BESS must carry out four functions at the same time. These are not extras — they are core requirements.
Function 1 — Voltage and Frequency Formation
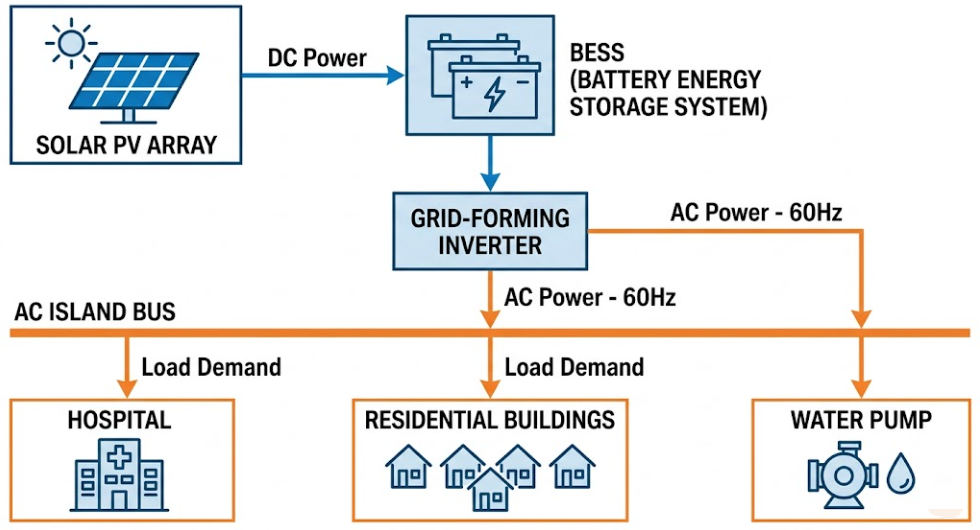
The BESS inverter must create a stable AC voltage — typically 50 Hz or 60 Hz — with no external signal to copy. This is the grid-forming function. Without it, nothing on the island can run. That is why grid-forming BESS technology is the baseline spec for any Island Grid BESS project.
Function 2 — Real-Time Power Balance
At every moment, generation must equal consumption. When solar output falls due to cloud, the BESS must discharge the difference right away. When a load switches off, the BESS must absorb the surplus. Otherwise, frequency drifts and the grid becomes unstable.
Function 3 — Energy Shifting and Overnight Supply
Beyond second-by-second balancing, the BESS must also store enough energy to carry the island through long periods of zero generation. In a solar-only system, that means overnight. In a wind-heavy setup, it can mean multi-day low-wind periods. This need drives the MWh capacity spec — which is separate from the MW power spec.
Function 4 — Black Start and Grid Restoration
If the island grid goes down — due to a fault, a protection trip, or a battery shutdown — the BESS must restart the entire network with no outside help. This black start capability is a must-have for Island Grid BESS. A standard grid-following inverter cannot do it.
04 — Control Architecture: Why Island Grids Need Grid-Forming BESS
This is the area where most Island Grid BESS projects go wrong. The mistake often shows up late — at commissioning — and it is expensive to fix.
Why Grid-Following Inverters Fail Alone on an Island
A grid-following BESS uses a Phase-Locked Loop (PLL) to lock onto an existing grid voltage signal. If there is no grid signal — which is always the case at black start — the PLL has nothing to lock to. As a result, the inverter shuts down.
For a grid-connected project, this is fine. The utility is always there as a backup. For an Island Grid BESS, however, there is no utility. The battery is the only power source. So a grid-following inverter alone is not suitable.
Grid-Forming Control: The Right Architecture for Island BESS
A grid-forming inverter creates its own internal voltage and frequency reference. Everything else on the network — loads, other inverters, generators — then syncs to that reference. Because of this, it can:
Black-start a fully de-energised island network
Hold stable frequency with no external signal
Respond to load steps in milliseconds — far faster than a PLL-based inverter
Keep running during faults that would trip a grid-following inverter
Three Control Strategies: Which One to Specify?
Choosing the right strategy depends on your island’s size, renewable mix, and load profile. Here is how the three main options compare.
Droop Control is the simplest option. It mimics a generator’s governor — it adjusts power output in line with frequency changes. Droop control works well for smaller islands with stable loads and modest renewable penetration.
Virtual Synchronous Generator (VSG) goes further. It copies the inertial response of a real synchronous generator. It reacts to both frequency deviation and Rate of Change of Frequency (ROCOF). Because of this, it works best on islands with high renewable penetration, where frequency can shift fast. Moreover, it replicates the behaviour that protection systems were designed around when diesel was the primary source.
Power Synchronisation Control (PSC) is the most advanced option. Instead of using frequency as the sync signal, it uses active power. This makes it the most stable choice for very weak or very small island grids — especially where the Short Circuit Ratio (SCR) falls below 1.5.
For most Island Grid BESS projects, VSG mode is the best default. It mimics diesel generator behaviour closely, so commissioning and protection coordination are simpler.
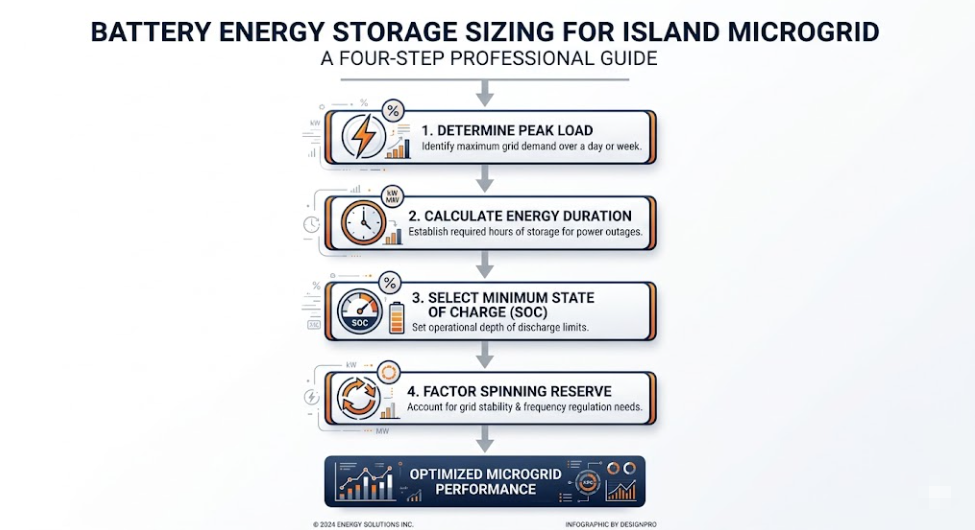
05 — Island Grid BESS Sizing: A Four-Step Method
Sizing an Island Grid BESS involves two dimensions: power capacity (MW or kW) and energy duration (MWh or kWh). Getting either one wrong causes serious operational and financial problems down the line.
Step 1 — Establish Peak Load and Load Profile
First, the BESS must meet peak demand with room to spare. A standard design rule is to size BESS power at 120–130% of peak island load. That extra headroom is your spinning reserve — the buffer that stops frequency from collapsing when demand spikes.
Example: An island with 500 kW peak demand needs a BESS rated at 600–650 kW minimum.
Step 2 — Determine Energy Duration Requirements
Next, consider how long the BESS must run on stored energy alone. For a solar-only island, that is typically 10–14 hours overnight. For a mixed solar-wind island, it can stretch to 48–72 hours during low-generation periods.
Design rule: Size the BESS to carry 100% of average island load through the worst-case zero-generation window. Then add a 20% safety margin on top.
Worked example — solar-only island, 200 kW average load, 12-hour overnight period:
Unlike a grid-connected BESS, Island Grid BESS has no utility backup if the battery runs low. SoC management must therefore be strict:
Minimum SoC: 20% — load shedding starts below this point
Maximum SoC: 95% — renewable generation is curtailed above this level
Normal cycling band: 20–95%
Emergency reserve: Keep 10% SoC set aside exclusively for black-start restoration
Step 4 — Define Spinning Reserve Allocation
Finally, set your spinning reserve. This is the share of BESS capacity that stays ready but does not discharge. It must be large enough to cover the biggest single generation loss on the island without letting frequency fall below relay trip thresholds.
Rule of thumb: Spinning reserve ≥ the rated output of the largest single renewable unit on the island.
06 — Battery Chemistry: Why LFP Dominates Island Grid BESS in 2026
Battery chemistry for Island Grid BESS has largely settled on one answer. As of 2026, Lithium Iron Phosphate (LFP) accounts for about 95% of new island grid BESS procurement globally. That figure comes from BloombergNEF and IEA tracking data. The reasons make sense for island grid conditions specifically.
Why LFP Wins for Island Grid BESS
Thermal stability is the top reason. Many island grid sites sit in tropical climates where ambient temperatures exceed 40°C. LFP cells have a thermal runaway threshold of around 270°C. NMC cells, by contrast, run into trouble at 150–180°C. Furthermore, LFP releases far less heat if a cell does fail. In a remote location where fire response is slow, that difference is critical.
Cycle life is the second major factor. Island Grid BESS systems cycle daily, often deeply. LFP cells rated for 4,000–6,000 full cycles at 80% DoD give 10–15 years of service before capacity augmentation is needed. NMC degrades faster under the same conditions.
Cost per cycle has also shifted in LFP’s favour. LFP manufacturing capacity expanded a great deal between 2022 and 2025. As a result, prices dropped, and the per-cycle economics are now clearly better for high-cycle island grid use.
Simpler thermal management is a practical bonus. LFP is less sensitive to temperature than NMC. Therefore, the HVAC system can be simpler — an advantage on remote islands where air conditioning maintenance is hard to schedule.
The one exception: very space-constrained sites, such as offshore platforms, may justify NMC for its higher energy density per cubic metre. In all other island grid cases, however, LFP is the correct default.
07 — Solar-Plus-BESS Island Grid Architecture
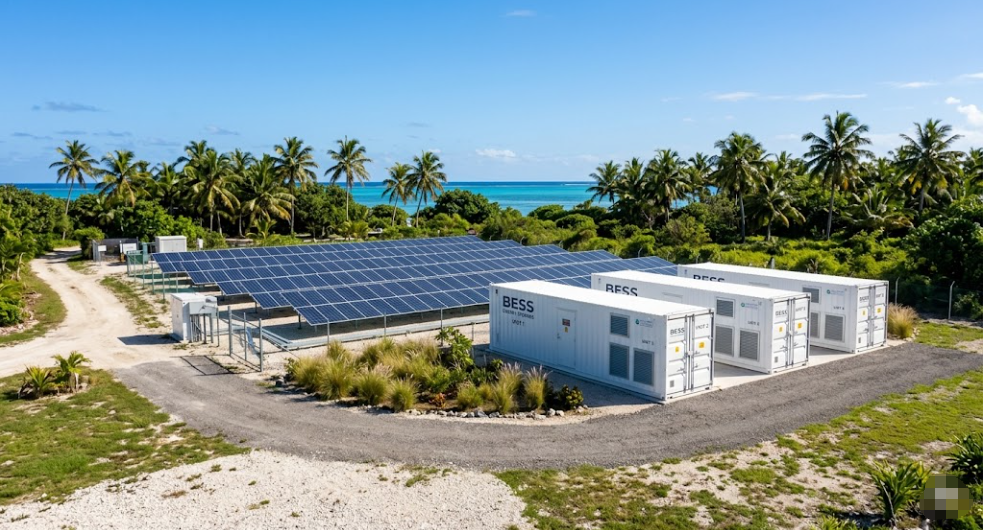
Solar-plus-BESS is the most common Island Grid BESS setup. It also has the longest track record in the field. Solar PV replaces diesel as the primary energy source. The BESS then provides grid stability and overnight energy supply.
AC-Coupled vs DC-Coupled: Which Is Right for Your Project?
DC-coupled architecture links the solar array directly to the BESS DC bus via a charge controller. The solar array and battery share the same inverter. This approach captures energy before conversion losses. It also uses solar power that would otherwise be clipped and wasted. As a result, DC-coupled systems typically cut installed cost by 5–8% and improve overall round-trip efficiency.
AC-coupled architecture connects the solar inverter to the island AC bus. The BESS connects to the same bus through a separate inverter. This setup is more flexible. Existing diesel generators integrate more easily because they simply plug into the same AC bus. For this reason, AC-coupled is usually the better choice for retrofit projects.
In summary: use DC-coupled for greenfield Island Grid BESS projects with high solar penetration. Use AC-coupled when you are transitioning away from diesel and need to keep the generators running during the process.
Renewable Penetration Targets by Project Stage
Renewable Penetration
BESS Configuration
Diesel Role
Up to 50%
BESS supports frequency; diesel is primary
Diesel runs continuously
50–80%
BESS is primary; diesel backs up
Diesel starts on demand
80–100%
BESS is sole grid-forming source
Diesel on emergency standby
100% + storage
Full diesel replacement
Diesel removed or cold standby
At 80–100% renewable penetration, grid-forming BESS technology becomes operationally essential. At that point, the diesel generator can no longer serve as the frequency reference.
08 — Wind-Plus-BESS Island Grid Architecture
Wind-plus-BESS island grids work differently from solar setups. In many island locations, they also perform better. Wind is not limited to daylight hours. Moreover, many islands have steady trade winds that deliver higher annual capacity factors than solar PV.
Three Unique Challenges of Wind-Plus-BESS Island Grids
Rapid generation variability is the first challenge. Wind output can shift a great deal within seconds due to gusts or direction changes. Consequently, the BESS must respond faster to wind variability than it typically does to solar variability. Solar output changes more gradually, except during sudden cloud shadow events.
Frequency interaction with wind turbines is the second challenge. Modern variable-speed wind turbines use power electronics interfaces. This makes them inverter-based resources (IBR) — not rotating machines with physical inertia. Therefore, when every generation source on the island is IBR, the Island Grid BESS must provide all synthetic inertia on its own. That is a harder job than in systems where some diesel generation is still running.
Extended low-wind periods are the third challenge. Unlike solar droughts, which reset each morning, wind droughts can run for multiple days. As a result, energy duration sizing for wind-plus-BESS island grids must account for multi-day low-generation periods. This pushes BESS capacity much higher than in equivalent solar designs.
09 — Diesel Hybrid Island Grids: The Three-Phase Transition Path
Most Island Grid BESS projects in 2026 are not greenfield builds. Rather, they are retrofits of existing diesel-dependent island grids. Understanding the three phases of transition is therefore essential for developers and asset owners.
Phase 1 — Diesel-Dominant with BESS Support (0–40% Renewable)
In this first phase, diesel generators still provide the voltage and frequency reference. The BESS operates in grid-following mode. It handles peak shaving, frequency regulation, and spinning reserve. As a result, diesel runtime drops, fuel costs fall, and maintenance intervals lengthen. This phase only needs a grid-following BESS. It is also the simplest and cheapest entry point.
Phase 2 — Diesel-Backup with BESS Primary (40–80% Renewable)
In this second phase, solar or wind capacity grows. The BESS then takes over as the main generation source for larger parts of each day. Diesel generators shift from continuous running to demand-start mode. At this stage, the BESS inverter must also be able to switch into grid-forming mode whenever the diesel is offline. This requires either a grid-forming capable inverter or a static transfer switch.
Typical outcomes: 50–70% diesel fuel reduction; diesel-on to diesel-off transitions in under 10 seconds.
Phase 3 — Full Diesel Replacement (80–100% Renewable)
In this third and final phase, diesel generators move to emergency-only standby or are removed. The Island Grid BESS runs continuously as the sole grid-forming source. Before commercial operation, the system needs full grid-forming BESS specification and comprehensive black start testing.
Typical outcomes: 85–95% diesel fuel reduction; full energy independence with diesel as last-resort backup only.
10 — Real-World Island Grid BESS Case Studies
Case Study 1 — El Hierro, Canary Islands (Spain)
El Hierro has run a wind-hydro-BESS hybrid island grid since 2014. Since then, it has steadily raised renewable penetration to above 90% for extended periods. The BESS absorbs wind variability and manages the link between turbines and pumped hydro storage. Peak demand on the island is about 7 MW. In short, El Hierro shows that 100% renewable island grids are viable at community scale.
Key results: Over 90% renewable penetration sustained over multiple consecutive days; diesel fuel use cut by more than 60%.
Flinders Island in Tasmania installed a solar-plus-BESS system that has cut diesel dependency sharply. The Island Grid BESS runs in grid-forming mode. Diesel generators have moved to demand-start backup. The Horizon Power-managed grid shows that grid-forming BESS can serve as the primary voltage and frequency source for a real remote community.
Key results: Diesel use down roughly 55%; Island Grid BESS availability above 99.5% since commissioning.
Case Study 3 — Hospital Microgrid, Lombok (Indonesia)
Research published in Energy and Buildings (2025) modelled a PV-BESS microgrid for a hospital on Lombok Island. The study tested a 3-day outage scenario. A correctly sized Island Grid BESS — supplying 7 MWh per day of critical load — maintained 100% hospital reliability with no diesel. The findings highlight the life-critical value of Island Grid BESS beyond day-to-day economics.
Case Study 4 — Mining Operation, Western Australia
A remote mining site replaced three diesel gensets with a solar Island Grid BESS. The system uses VSG grid-forming control. Droop settings were calibrated to match the frequency response that the mining equipment’s protection relays were designed around. In year one, diesel use fell by 78%. By year two, after a solar expansion, diesel was phased out entirely.
11 — Island Grid BESS Sizing Reference Table
Use the table below as a starting point for project scoping. All figures assume LFP chemistry, 90% depth of discharge, 10% spinning reserve headroom, and a solar-plus-BESS setup with 12-hour overnight supply duration.
Island Peak Load
Min BESS Power
Min BESS Energy
Typical Solar PV
Target Renewable %
50 kW
65 kW
400 kWh
80 kWp
80%
100 kW
130 kW
800 kWh
150 kWp
80%
250 kW
325 kW
2,000 kWh
380 kWp
80%
500 kW
650 kW
4,000 kWh
750 kWp
80%
1 MW
1.3 MW
8 MWh
1.5 MWp
80%
5 MW
6.5 MW
40 MWh
7.5 MWp
80%
10 MW
13 MW
80 MWh
15 MWp
80%
These are indicative scoping figures only. Final sizing must be based on measured load profiles, site-specific resource data, and full power systems modelling. Contact SunLith Energy for a project-specific Island Grid BESS analysis.
12 — Financial Case: Island Grid BESS vs Diesel Over 25 Years
The financial case for Island Grid BESS has shifted a great deal since 2022. LFP battery costs have fallen to $90–130/kWh installed in competitive markets. Meanwhile, diesel delivery costs to remote islands have risen — when you include logistics, shipping, and storage. Together, these trends make Island Grid BESS the economically dominant choice in almost every isolated grid context.
The Diesel Costs That Most Analyses Miss
Simple comparisons often undercount the true cost of diesel on island grids. A full cost assessment must include all of the following:
Fuel logistics: Diesel price plus shipping, handling, and on-island storage
Generator replacement: Diesel gensets need full replacement every 15,000–25,000 running hours
Maintenance and travel: Regular servicing requires technicians to travel by air or sea to remote sites
Environmental liability: Diesel storage creates spill risk, especially in ecologically sensitive island areas
Carbon costs: Where carbon pricing applies, diesel grids face costs that grow each year
Why Island Grid BESS Wins on Lifetime Cost
Island Grid BESS offers several clear cost advantages over diesel. First, there is no ongoing fuel cost — solar and wind energy have zero marginal cost. Second, LFP BESS have no moving parts, so maintenance is far cheaper than for diesel generators. Third, modern LFP BESS are built for 20–25-year project life. Battery capacity augmentation at year 10–12 is the main lifecycle cost event. Finally, for islands weighing a submarine cable connection against Island Grid BESS, the battery solution is typically cheaper at scales below 10 MW peak demand.
Indicative 25-Year Cost Comparison: 500 kW Island Grid
Cost Item
Diesel Island Grid
Solar + Island Grid BESS
Fuel cost per year (Year 1)
$350,000–500,000
$0
Annual maintenance
$80,000–120,000
$15,000–25,000
Capital replacement at Year 10
$400,000–600,000 (gensets)
$150,000–250,000 (augmentation)
Carbon cost exposure
High and rising
None
25-year NPV advantage
Baseline
$3–6 million in BESS’s favour
These figures are indicative, based on 2026 market pricing. Site-specific financial modelling is required before any investment decision.
13 — Key Technical Challenges and Practical Solutions
Challenge 1 — Protection Coordination
Standard relay settings are built around the fault current that synchronous generators produce. Island Grid BESS inverters, however, typically produce lower fault currents — around 1.0–1.2 per-unit versus 5–10 per-unit for a generator. As a result, relay settings must be reconfigured to match the BESS fault current range.
Solution: Run a full protection coordination study before specifying relay settings. Some grid-forming BESS inverters now offer fault current up to 1.5–2.0 per-unit. That helps improve protection discrimination and simplifies the relay setup.
Challenge 2 — Large Load Steps on Small Island Grids
On a small Island Grid BESS under 500 kW, a single large motor — a pump, an air conditioner, a welding set — can represent a large share of total load. Each start is a sudden demand that the BESS must absorb without letting frequency collapse.
Solution: Specify VSG mode with tight droop settings and a low-pass filter on the load measurement. For large motors, add soft starters or variable frequency drives. These reduce inrush current sharply and make each load step manageable.
Challenge 3 — Battery Degradation in Hot Climates
Island Grid BESS sites in tropical areas face high ambient temperatures. Without good thermal management, LFP cell ageing speeds up significantly.
Solution: Use active thermal management to keep cells between 20–30°C. Do not rely on passive cooling alone in any tropical installation. Size the HVAC system for the worst-case ambient temperature — not the annual average.
Challenge 4 — Energy Management System Latency
On an island grid, the delay between a measured grid event and the BESS response directly affects frequency stability. Grid-connected BESS systems can tolerate 500–1,000 ms EMS response times. Island Grid BESS, however, needs inverter-level response within 20–50 ms. The EMS should only handle the slower strategic scheduling.
Solution: Specify inverter-integrated droop and VSG control that runs autonomously at the hardware level. The EMS then updates set-points on a scheduling cycle measured in minutes — not milliseconds.
14 — Frequently Asked Questions
What is Island Grid BESS and how does it differ from standard BESS?
Island Grid BESS must act as the sole voltage and frequency reference on an isolated network. There is no utility grid as backup. This requires grid-forming inverter control, black start capability, and continuous power balance management. In contrast, a standard grid-connected BESS needs none of these. The engineering scope is therefore much broader. For the full inverter control comparison, see our guide on grid-forming vs grid-following BESS.
Can a grid-following BESS be used on an island grid?
Not as the sole power source. A grid-following inverter needs an existing voltage reference to operate. On an island grid with no diesel generator running, that reference does not exist. However, a grid-following BESS can participate in an island grid if a diesel generator or grid-forming BESS is already providing the reference voltage. For the full technical details, see our guide to grid-following BESS.
How many hours of storage does an Island Grid BESS need?
The minimum is typically 4 hours for a solar-heavy island with a strong, consistent solar resource. However, 8–16 hours is more common for reliable overnight supply. Furthermore, systems in high-latitude or wind-heavy locations may need 24–72 hours to cover extended low-generation periods. Sizing must always be based on site-specific load profiles and measured generation data.
What battery chemistry is best for Island Grid BESS?
LFP (Lithium Iron Phosphate) is the right choice for almost all Island Grid BESS projects in 2026. Its thermal stability, 4,000–8,000 cycle life, and safety profile make it clearly better than NMC for remote island sites where fire response and maintenance access are limited.
How does Island Grid BESS handle a complete power failure?
Through black start. A correctly specified grid-forming Island Grid BESS can energise the island AC network from a fully dead state using stored battery energy alone. The inverter creates a stable AC voltage and then reconnects loads in a controlled sequence — starting with critical loads first. Diesel generators, if retained, can then sync to the re-established BESS reference.
Can renewable energy cover 100% of an island’s power needs with Island Grid BESS?
Yes — and real-world projects already prove it. Island grids are operating at 90–100% renewable penetration today. However, the remaining challenge is cost. Storing enough energy to cover extended zero-generation periods requires a large BESS. For most islands, 80–90% renewable penetration is the economically optimal starting point. Full diesel elimination follows as storage costs continue to fall.
What does an Island Grid BESS project typically cost?
Turnkey 4-hour LFP Island Grid BESS systems were priced at about $180–260/kWh installed in European and Pacific markets in 2026. Therefore, a 500 kW / 4,000 kWh system represents a BESS capital cost of $720,000–$1,040,000, before solar, civil works, and EMS. In high diesel-cost island markets, payback typically falls within 5–8 years.
15 — Related Articles on SunLith Energy
The following SunLith Energy guides provide the deeper technical detail that supports Island Grid BESS design and procurement:
SunLith Energy provides technical guidance, project development support, and commercial BESS solutions for island grid, microgrid, and utility-scale energy storage projects. Contact our engineering team for project-specific Island Grid BESS sizing and design support.
Introduction: Why Talk About the Advantages of Battery Energy Storage System (BESS)?
The advantages of Battery Energy Storage System (BESS) are shaping the future of clean energy. As renewable adoption accelerates, the need for reliable, flexible, and scalable energy storage has never been greater. From utilities struggling with grid fluctuations to businesses facing high demand charges, BESS offers a transformative solution.
At Sunlith Energy, we help industries, communities, and utilities realize the full advantages of Battery Energy Storage System (BESS) by providing solutions designed for safety, scalability, and sustainability. This article explores over 10 detailed advantages, supported with practical examples, financial impacts, and future trends.
What is a Battery Energy Storage System (BESS)?
Before diving into the advantages of Battery Energy Storage System (BESS), it’s important to understand what it is.
2. Renewable Energy Integration: Unlocking the Advantages of Battery Energy Storage System (BESS)
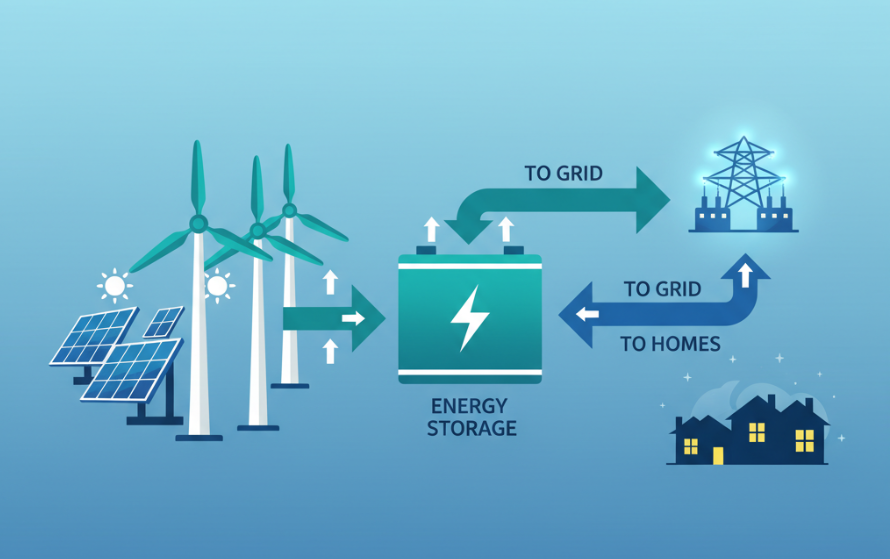
Solar and wind power are intermittent, which can cause reliability issues. One of the clear advantages of Battery Energy Storage System (BESS) is renewable integration.
Store midday solar surplus → release in evening peaks.
Smooth wind ramp-ups and sudden drops.
Reduce renewable curtailment by capturing excess generation.
👉 At Sunlith Energy, we deploy hybrid systems combining solar/wind with BESS for firm, round-the-clock renewable power.
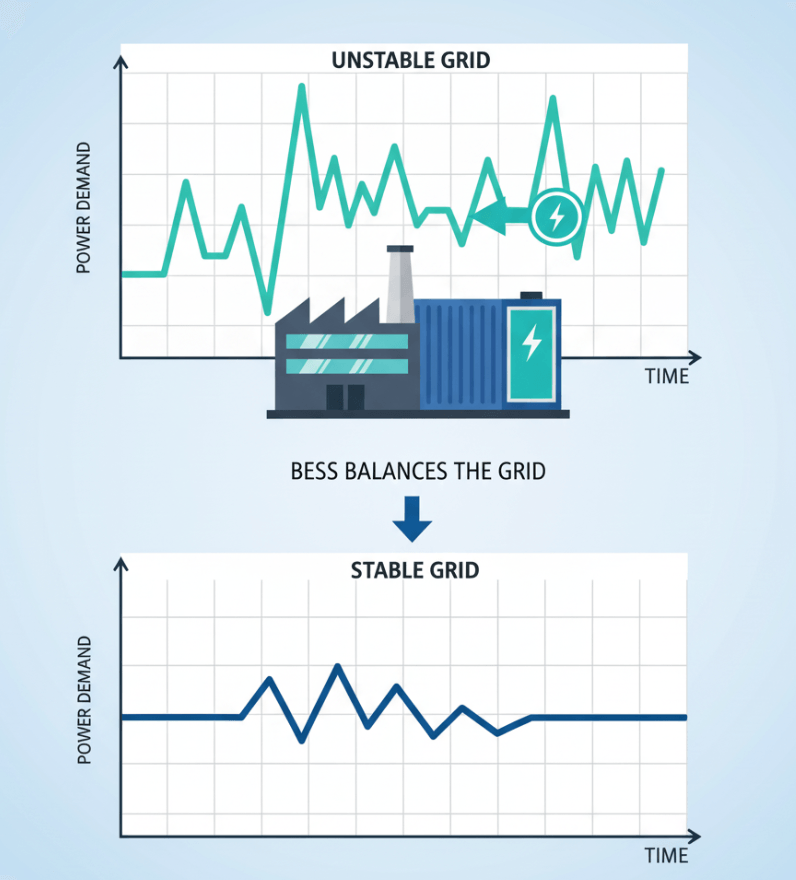
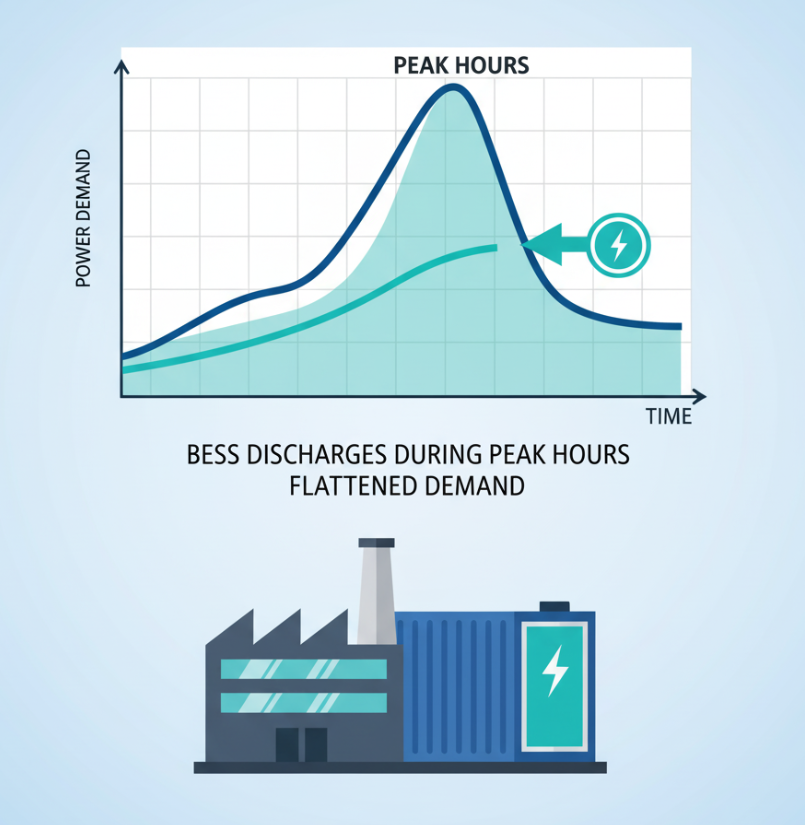
3. Peak Shaving: A Cost-Saving Advantage of Battery Energy Storage System (BESS)
For businesses, one of the most direct advantages of Battery Energy Storage System (BESS) is lowering electricity costs through peak shaving.
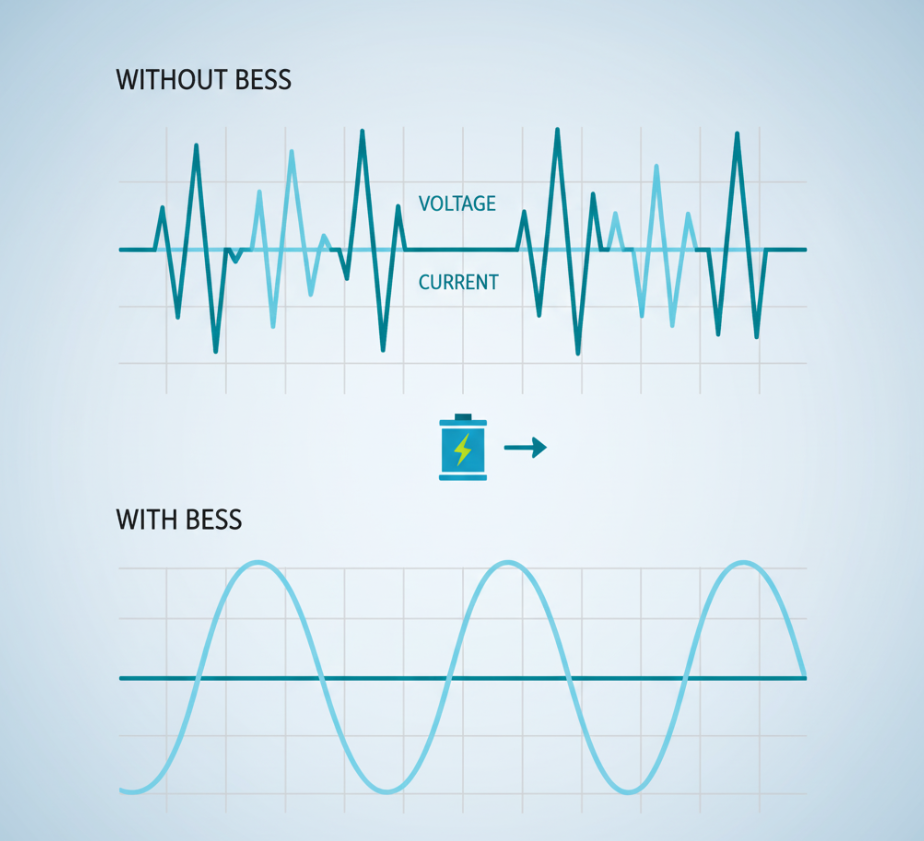
7. Power Quality: Technical Advantages of Battery Energy Storage System (BESS)
Power quality issues cause downtime and equipment damage. The advantages of Battery Energy Storage System (BESS) also include better power quality.
Harmonic filtering.
Reactive power support.
Voltage stabilization.
For industries with sensitive equipment (like semiconductor manufacturing), this is a game-changing advantage.
8. Synthetic Inertia: A Modern Advantage of Battery Energy Storage System (BESS)
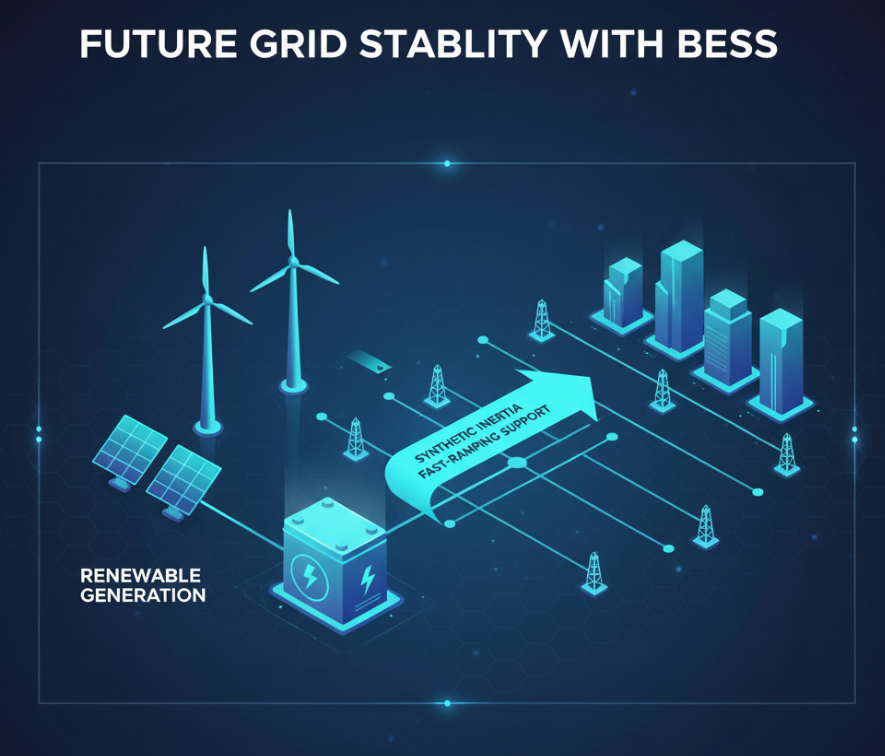
Traditional power plants provided inertia to stabilize the grid. One of the modern advantages of Battery Energy Storage System (BESS) is providing synthetic inertia.
Advanced inverters mimic inertia.
Fast ramping balances renewable fluctuations.
Supports reliable, renewable-heavy grids.
9. Environmental Advantages of Battery Energy Storage System (BESS)
Beyond economics, the advantages of Battery Energy Storage System (BESS) extend to sustainability.
Q1: What are the main advantages of Battery Energy Storage System (BESS)?
A: The main advantages of Battery Energy Storage System (BESS) are grid stability, renewable integration, peak shaving, energy arbitrage, backup power, improved power quality, and scalability.
Q2: How does BESS save money for businesses?
A: By reducing demand charges, enabling energy arbitrage, and improving power reliability, BESS lowers operational costs.
Q3: How long do the advantages of Battery Energy Storage System (BESS) last?
A: A typical BESS lasts 8–15 years, depending on usage cycles, chemistry, and maintenance.
Q5: Who benefits most from the advantages of Battery Energy Storage System (BESS)?
A: Utilities, C&I facilities, renewable developers, EV charging hubs, and critical infrastructure.
Conclusion: Why the Advantages of Battery Energy Storage System (BESS) Matter
The advantages of Battery Energy Storage System (BESS) are multi-dimensional—economic, technical, and environmental. From stabilizing grids and enabling renewables to saving costs and enhancing resilience, BESS is the backbone of the future energy system.
At Sunlith Energy, we deliver tailored BESS solutions that unlock these benefits while ensuring safety, scalability, and sustainability.
👉 Ready to experience the full advantages of Battery Energy Storage System (BESS)? Visit our Contact Page today.
C&I BESS case studies provide powerful proof of how energy storage systems deliver measurable benefits in commercial and industrial settings. By examining successful deployments, businesses can see real-world evidence of cost savings, resilience improvements, and renewable energy integration. This article showcases real-life examples across industries, linking back to applications of BESS and the economic benefits of deployment.
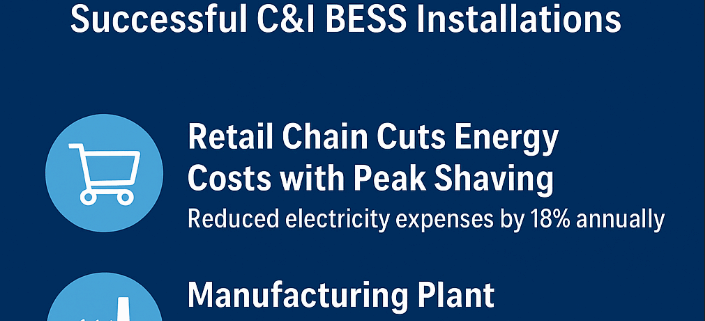
Case Study 1: Retail Chain Cuts Energy Costs with Peak Shaving
A large retail chain in the U.S. adopted a C&I BESS to manage demand charges. By reducing peak load, the business cut electricity expenses by 18% annually. The system also provided backup power during outages, improving reliability.
Key Outcome: Cost savings + resilience.
Case Study 2: Manufacturing Plant Improves Power Quality
An industrial manufacturer in Germany faced frequent voltage fluctuations, disrupting operations. A 5 MWh BESS was deployed to stabilize the grid connection and smooth load profiles. The plant saw reduced downtime and higher operational efficiency.
Key Outcome: Enhanced power quality + productivity.
Case Study 3: Data Center Achieves 24/7 Uptime
Data centers require uninterrupted power. A Singapore-based data center installed a C&I BESS as part of its microgrid. The system ensured seamless switchover during grid disturbances, protecting sensitive equipment and avoiding costly downtime.
Key Outcome: Reliability + continuous operations.
Case Study 4: Winery Integrates Solar with Storage
Case Study 5: Hospital Increases Energy Resilience
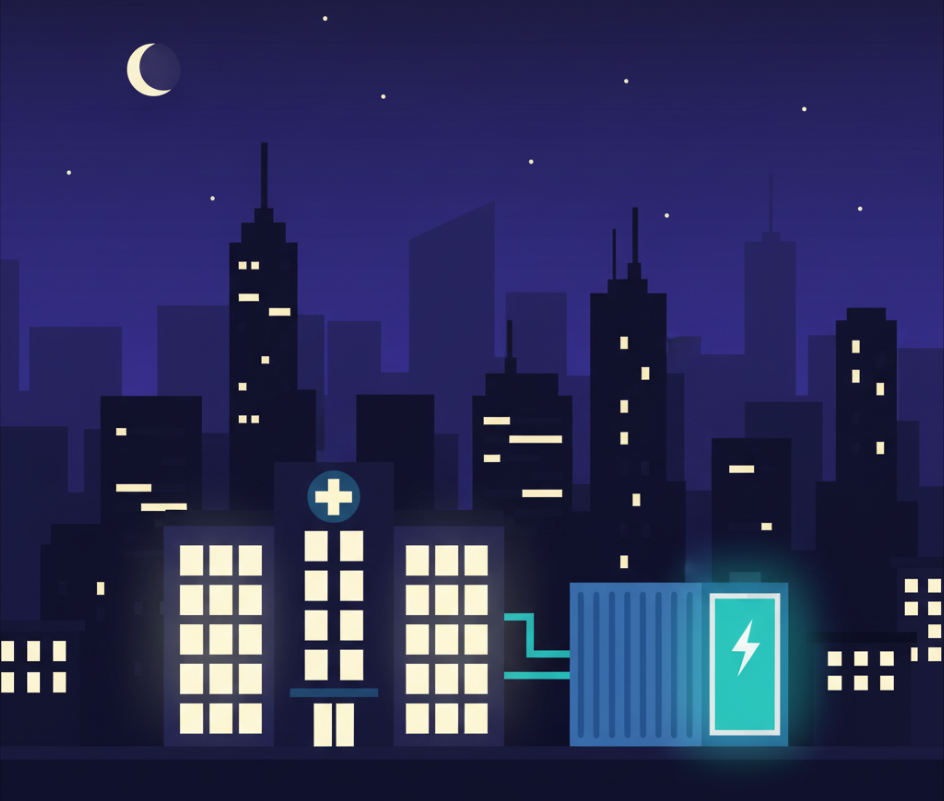
Hospitals must prioritize uninterrupted energy supply. A hospital in Australia deployed BESS alongside diesel generators. The hybrid system provided critical backup, reduced fuel costs, and aligned with green initiatives.
Key Outcome: Energy security + reduced emissions.
Lessons Learned from C&I BESS Case Studies
Across these case studies, common success factors emerge:
Peak shaving and demand charge reduction directly improve the bottom line.
Improved resilience and power quality safeguard operations.
Integration with renewables aligns with sustainability and ESG goals.
Scalability and flexibility make BESS suitable across diverse industries.
Conclusion
Real-world C&I BESS case studies demonstrate the versatility and value of energy storage. From retail and manufacturing to data centers and healthcare, businesses are achieving cost savings, operational resilience, and sustainable energy strategies. Companies evaluating storage can learn from these successes and explore how C&I BESS can strengthen their operations.
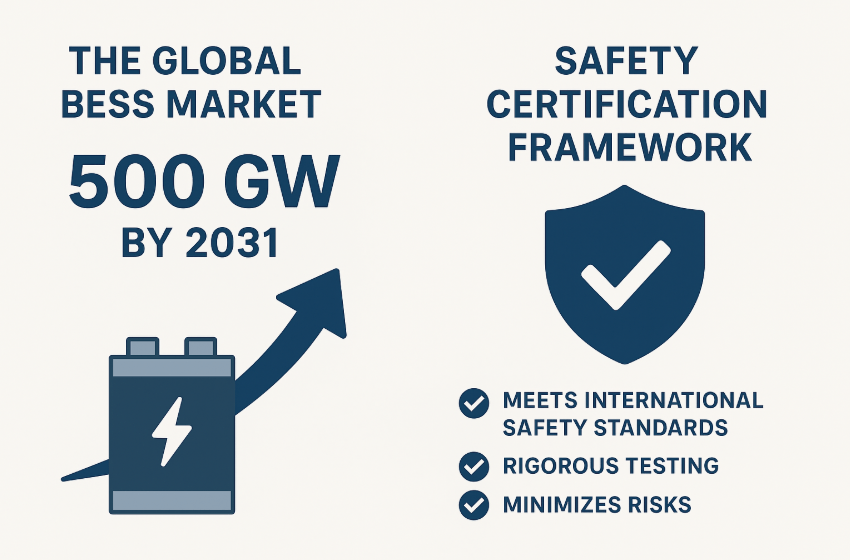
The global BESS market is projected to grow exponentially, reaching 500 GW by 2031. This forecast is a reflection of the world’s transition toward clean energy, electrification, and grid modernization. Battery Energy Storage Systems (BESS) are no longer niche technologies—they are becoming central to the stability and flexibility of modern energy networks.
But with such rapid deployment, BESS safety certification has emerged as a critical factor. Without strong certification standards, the risks of fire, explosion, or system failure increase. These risks not only threaten energy reliability but also create challenges for regulators, insurers, and investors.
In this article, we explore the drivers of global BESS market growth, the importance of safety certification, and the frameworks shaping the future of energy storage systems.
Why the Global BESS Market Is Growing So Fast
The energy storage systems projected 500 GW growth is being driven by a combination of technical, economic, and policy-related factors.
1. Renewable Energy Integration
Wind and solar are now the cheapest forms of new power generation worldwide. However, their variability creates challenges for grid operators. Battery energy storage systems solve this problem by storing excess energy and releasing it when demand rises.
2. Grid Modernization and Stability
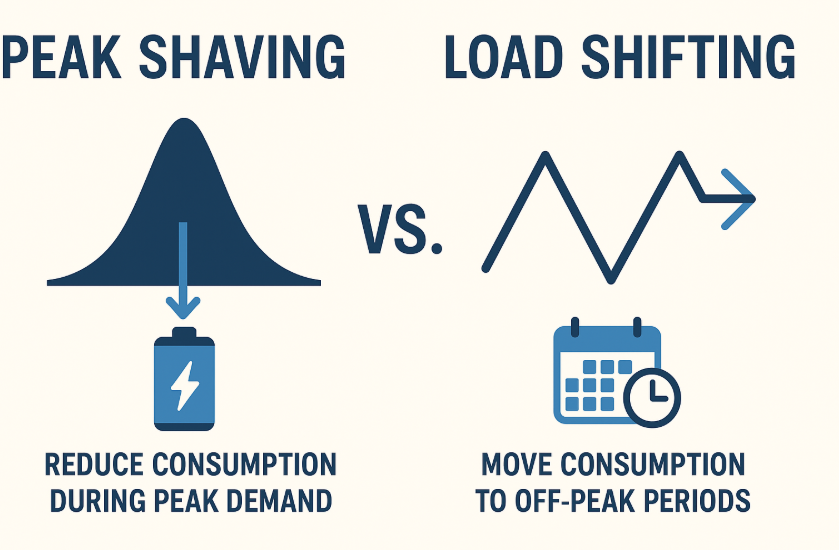
Utilities are increasingly deploying BESS for peak shaving and load shifting, frequency regulation, and emergency backup. These applications make the grid more stable and resilient.
3. Commercial and Industrial Adoption
The C&I sector is also embracing storage. Businesses use BESS to cut peak demand charges, integrate renewable energy, and secure backup power through certified BESS installations.
4. Policy Support and Incentives
Governments are backing storage projects through subsidies, tax credits, and regulatory frameworks. For example, the U.S. Inflation Reduction Act provides tax benefits for energy storage projects, while the EU Green Deal is pushing for accelerated deployment.
The Risks of Rapid Expansion Without Certification
The market opportunity in certified BESS installations is immense. Yet, expansion without robust certification frameworks introduces serious risks.
Thermal Runaway – Poorly tested systems can overheat and cause chain-reaction fires.
Fire Hazards – Uncertified systems lack the proven ability to prevent or contain fires.
Grid Instability – Unsafe or poorly integrated BESS may destabilize the grid.
Investor Concerns – How certification improves investor confidence in BESS is by ensuring long-term reliability. Without it, projects face financing barriers.
These risks highlight why safety risks of battery energy storage without certification cannot be ignored.
Why Safety Certification Matters for BESS
As the global BESS market forecast to 2031 shows explosive growth, safety must be at the forefront. Certification ensures that BESS systems:
Meet UL 9540 certification for large-scale BESS to prove safe system integration.
Beyond safety, certification also drives global BESS market growth by creating trust.
How Certification Improves Investor Confidence in BESS
Reduces liability risks by ensuring compliance.
Streamlines project permitting and regulatory approval.
Enhances access to financing, as banks prefer certified projects.
Demonstrates compliance with regulatory requirements for battery energy storage systems 2031.
Without certification, large-scale projects could face costly delays, stricter insurance requirements, or outright rejection.
Global Trends in Energy Storage Certification and Testing
The global trends in energy storage certification and testing point toward stricter, more harmonized standards. Several developments are shaping the industry:
Harmonization of IEC and UL standards to reduce duplication.
Performance-based testing to reflect real-world conditions.
AI and digital twins for predictive safety assessments.
Third-party testing labs expanding capacity to handle growing demand.
As the market scales toward 500 GW energy storage forecast, these certification trends will define how quickly projects come online.
Looking Ahead: Balancing Growth With Safety
The global BESS market forecast to 2031 highlights a future of rapid scaling, but it comes with responsibility. The industry must prioritize best practices for BESS fire and explosion prevention to protect communities and maintain market trust.
Future growth will depend on:
Stronger collaboration between regulators and manufacturers.
By aligning market expansion with robust safety certification, the BESS industry can deliver safe, reliable, and sustainable storage solutions that support the global clean energy transition.
As renewable energy adoption grows, energy storage systems (ESS) have become critical for balancing supply and demand, improving reliability, and supporting grid resilience. To ensure safety, performance, and interoperability, the International Electrotechnical Commission (IEC) developed the IEC 62933 series, a set of globally recognized standards.
These standards guide manufacturers, developers, and policymakers in designing and deploying safe, efficient, and sustainable storage solutions.
Focuses on environmental assessment of energy storage technologies.
Considers carbon footprint, material use, and recycling practices.
Encourages sustainable deployment of large-scale ESS.
7. IEC 62933-4-4 – End-of-Life Management
Provides guidelines for decommissioning, recycling, and disposal of EES.
Promotes circular economy practices in the storage industry.
Reduces environmental risks associated with battery waste.
8. IEC 62933-5-1 – General Safety Considerations
Covers general safety requirements for stationary energy storage.
Includes electrical, chemical, mechanical, and fire safety aspects.
Ensures system safety across all technologies (batteries, flywheels, etc.).
9. IEC 62933-5-2 – Safety for Large-Scale EES
Focuses specifically on large battery energy storage systems (BESS).
Addresses thermal runaway prevention, emergency response, and system protection.
Critical for utility-scale storage projects.
10. IEC 62933-5-3 – Grid Integration Safety
Examines safety aspects during grid connection and operation.
Ensures ESS does not destabilize or endanger grid infrastructure.
Supports secure deployment in smart grids and microgrids.
Importance of IEC 62933 for the Industry
The IEC 62933 series provides:
Global Standardization – unifies practices worldwide.
Risk Reduction – prevents failures in high-risk ESS installations.
Sustainability – ensures safe end-of-life handling.
Investor Confidence – promotes compliance and long-term reliability.
Innovation Support – enables safe integration of emerging technologies like solid-state and hybrid storage.
Conclusion
The IEC62933 standard family is the backbone of global energy storage deployment. From general guidelines (IEC62933-1) to detailed safety (IEC62933-5-2) and environmental sustainability (IEC62933-4-4), it ensures storage systems are safe, efficient, and future-ready.
Adopting these standards is essential for manufacturers, developers, and regulators who aim to accelerate the clean energy transition while ensuring safety and reliability.
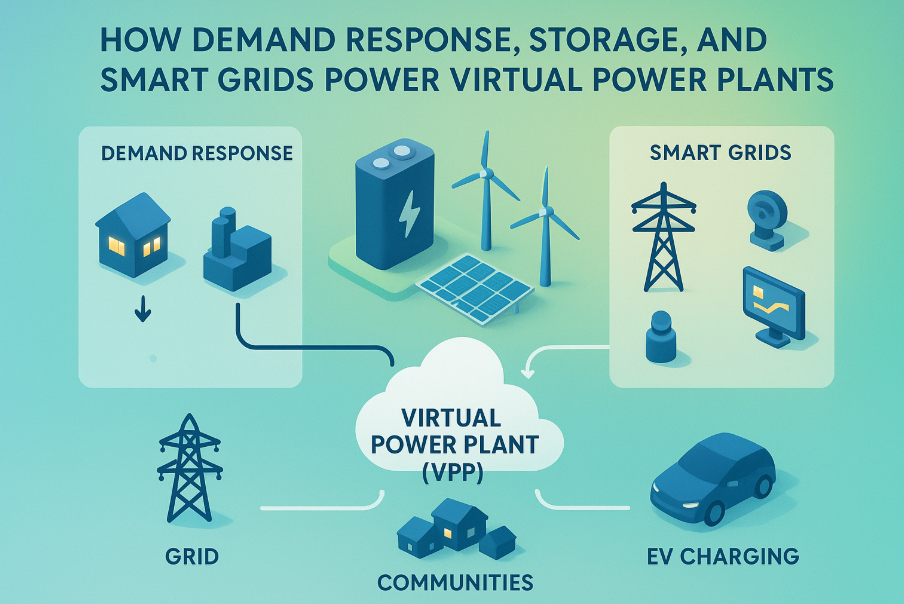
In today’s energy landscape, flexibility is just as important as generation. As renewable energy adoption grows, balancing supply and demand has become a major challenge. Demand Response (DR), when integrated into Virtual Power Plants (VPPs), offers a powerful solution to achieve this balance. By intelligently shifting or reducing electricity usage during peak hours, demand response ensures a more resilient, affordable, and sustainable energy system.
What Is Demand Response?
Demand Response is an energy management strategy where consumers adjust their electricity usage in response to grid conditions, price signals, or incentives. Instead of relying solely on power plants to ramp up supply, DR helps reduce stress on the grid by adjusting demand.
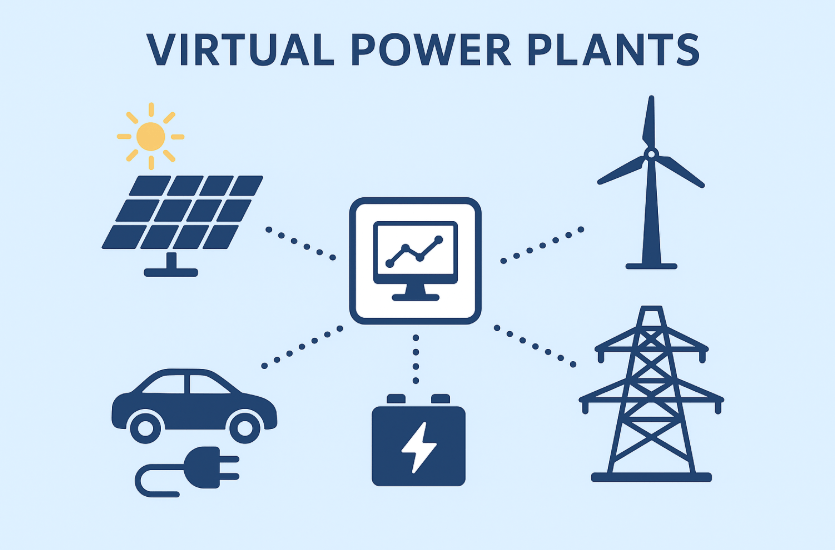
When this capability is connected to a Virtual Power Plant, thousands of distributed assets — from smart appliances to EV chargers — can collectively act as a flexible energy resource.
How Demand Response Works in Virtual Power Plants
Real-Time Monitoring: Smart meters and IoT devices track consumption patterns.
Automated Control: Appliances, batteries, and HVAC systems adjust based on grid signals.
Aggregated Flexibility: Small changes across households and businesses add up to major load reductions.
Bidirectional Benefits: Consumers earn incentives, while grid operators reduce stress on infrastructure.
Decarbonization – Maximizes the integration of renewable energy by reducing reliance on fossil-fuel backup plants.
Resilience – Communities gain more reliable access to electricity during extreme demand peaks.
Real-World Applications
United States: California’s Flex Alert program rewards consumers for reducing usage during peak times, and when tied into VPPs, it supports grid resilience during heatwaves.
Europe: Germany and the UK are experimenting with large-scale DR programs integrated into VPP platforms to balance wind and solar fluctuations.
Asia: Japan’s utilities use DR to manage peak demand from air conditioning loads in summer while leveraging VPP networks.
Demand Response + Smart Grids + Storage
Demand Response becomes even more effective when combined with:
Demand Response is the hidden power of Virtual Power Plants. By engaging consumers and leveraging automation, it transforms passive energy users into active participants in grid management. The result is a system that is smarter, cleaner, and more resilient for everyone.
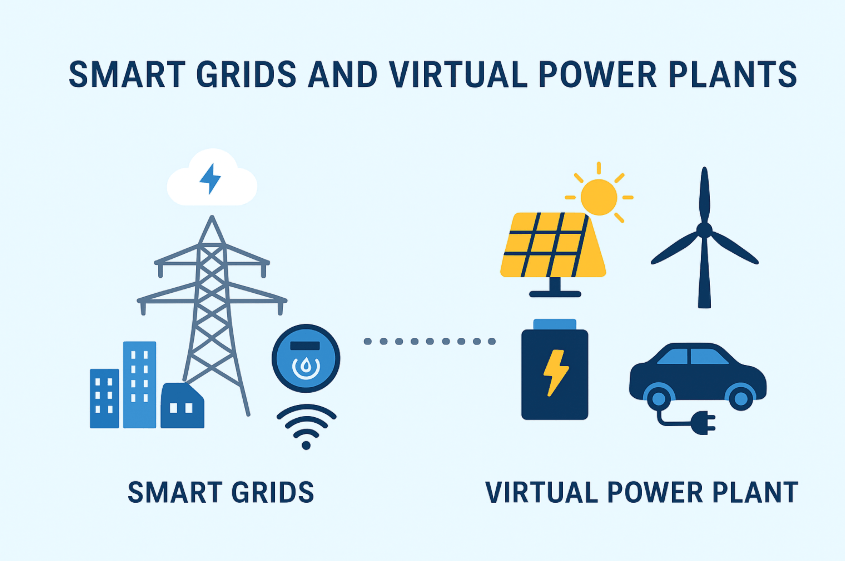
But VPPs cannot function effectively without the digital infrastructure that allows millions of devices to communicate, share data, and respond instantly to grid conditions. That infrastructure is the Smart Grid.
In this article, we explore how smart grids serve as the backbone of Virtual Power Plants, enabling greater efficiency, flexibility, and resilience in modern energy systems. We will dive into the technology, benefits, challenges, and future potential of this synergy — and why it represents a cornerstone of the clean energy future.
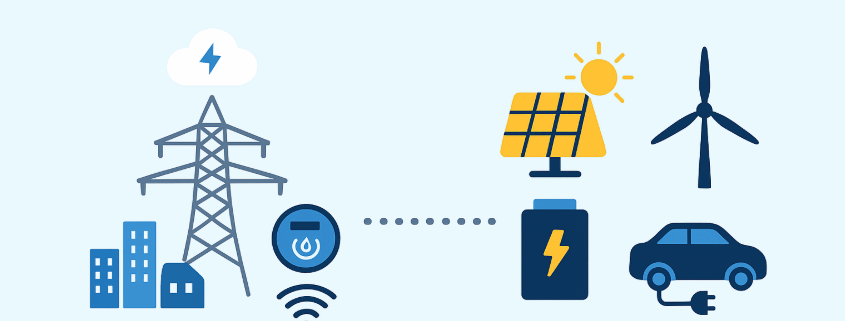
A Smart Grid is an advanced electrical grid that uses digital communication technology, sensors, and automation to manage the flow of electricity more intelligently. Unlike traditional power grids, which were designed for one-way electricity delivery from central power plants to consumers, smart grids enable two-way communication between utilities and consumers.
Key Features of Smart Grids:
Advanced Metering Infrastructure (AMI): Smart meters that provide real-time data on energy usage.
Automation and Control: Systems that automatically detect faults, reroute electricity, and balance supply and demand.
IoT Integration: Devices and sensors that communicate across the grid.
Data-Driven Operations: Predictive analytics and AI-based forecasting for better grid planning.
These innovations make smart grids not just more efficient, but also essential for integrating distributed and variable energy sources.
Why Smart Grids Matter for Virtual Power Plants
Virtual Power Plants aggregate thousands of distributed assets — rooftop solar panels, home batteries, EV chargers, and even smart appliances. Managing such a diverse ecosystem requires a grid that is flexible, intelligent, and responsive. This is exactly where SG come into play.
Real-Time Monitoring and Control Smart grids continuously collect data from sensors and smart meters, feeding it into centralized platforms that allow utilities to monitor conditions and make adjustments instantly. This real-time oversight is critical for VPPs, which rely on quick responses to stabilize grid frequency and voltage.
Integration of Renewable Energy Renewables like solar and wind are intermittent. Smart grids enable the smooth integration of these resources by forecasting production, managing variability, and distributing energy where it’s needed most.
By leveraging automation and predictive analytics, smart grids reduce outages and enable quicker recovery during disturbances. VPPs, supported by smart grids, can instantly dispatch distributed resources to fill supply gaps.
2. Greater Flexibility
Smart grids give VPPs the agility to scale up or down depending on real-time conditions, ensuring that renewable integration does not compromise grid stability.
3. Lower Operational Costs
Through automation and reduced transmission losses, smart grids reduce overall operational expenses. Consumers also benefit from dynamic pricing models enabled by smart meters.
Smart grids turn passive consumers into active prosumers. With rooftop solar, home batteries, and EVs, households can not only consume energy but also produce and trade it.
Real-World Case Studies
Case Study 1: Europe’s Smart Grid-VPP Integration
In Germany, one of the leaders in renewable adoption, smart grids are enabling VPP operators to aggregate thousands of residential solar and storage units. These resources are orchestrated in real-time to stabilize the grid and provide balancing services to transmission operators.
Case Study 2: United States – Smart Grids with Battery Storage
In California, utilities are deploying smart grids integrated with VPPs to reduce strain during peak summer demand. By combining smart meters, automated demand response, and residential battery systems, the state avoids rolling blackouts and reduces reliance on fossil fuel peaker plants.
Challenges and Future Outlook
1. Cybersecurity Risks
As more devices connect to the grid, the potential attack surface grows. Cybersecurity will be critical to protect smart grids and VPPs from malicious threats.
2. High Initial Investment
Building smart grids requires substantial capital for sensors, meters, communication infrastructure, and software platforms. However, the long-term savings often outweigh the upfront costs.
3. Regulatory Framework
Policymakers must adapt regulations to enable smart grid investments, incentivize demand response, and allow for energy trading within VPPs.
4. Data Privacy
With vast amounts of data being collected from consumers, utilities must ensure strong protections for privacy and data ownership.
Conclusion
Smart grids are more than just an upgrade to our existing power infrastructure. They are the foundation that enables Virtual Power Plants to function at scale, making renewable integration seamless, improving grid reliability, and empowering communities to take control of their energy.
As the world accelerates toward a clean energy future, the synergy between smart grids and VPPs will become increasingly indispensable. Together, they represent not just technological innovation, but also a pathway to resilience, sustainability, and shared prosperity.
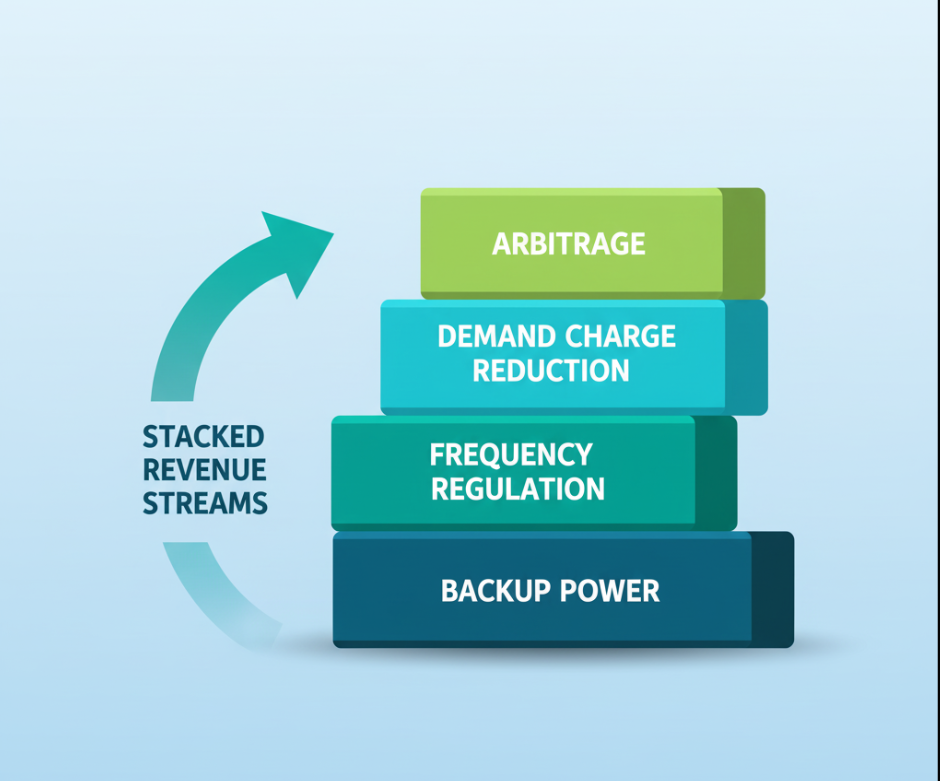
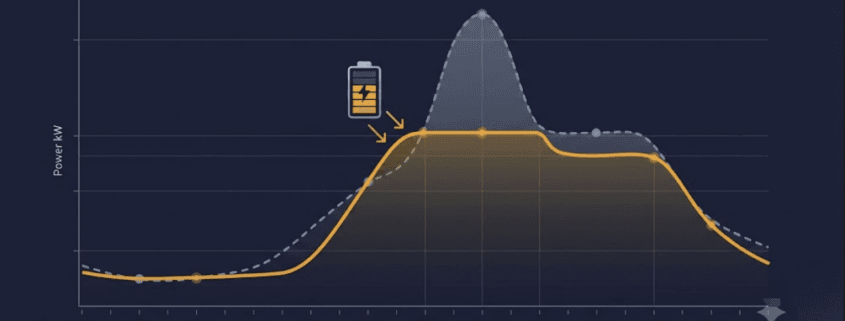
Peak shaving with a battery energy storage system typically cuts demand charges by 20–40%. That range depends on two things: your load profile, and your local utility’s tariff structure. So what does this look like in dollars? For a commercial site paying $15/kW in demand charges with a 500 kW peak, that’s often $1,500–$3,000 in monthly savings. In other words, a mid-size BESS can pay for itself in 4–7 years, even before you add other revenue streams on top.
This guide walks through exactly how those savings are calculated. First, we’ll cover what drives the range up or down. Then, we’ll work through a real example you can adapt to your own utility bill. If you’re new to the concept itself, start with our full peak shaving vs. load shifting guide — this page focuses specifically on the dollars.
How Demand Charges Work
Most commercial and industrial tariffs bill two separate components. First, energy charges (¢/kWh) are based on total consumption. Second, demand charges ($/kW) are based on your single highest usage spike in the billing period, usually measured over a 15- or 30-minute window. As a result, demand charges can account for 30–70% of a commercial electric bill. Unlike energy charges, one short spike sets the rate for the entire month, regardless of how briefly it occurred. For a deeper look at how utilities structure these rates, the EIA’s guide to electricity pricing factors is a useful primer. For the full mechanics of how demand is measured and billed for BESS applications specifically, see our complete peak shaving guide.
How Much Can Peak Shaving Actually Save?
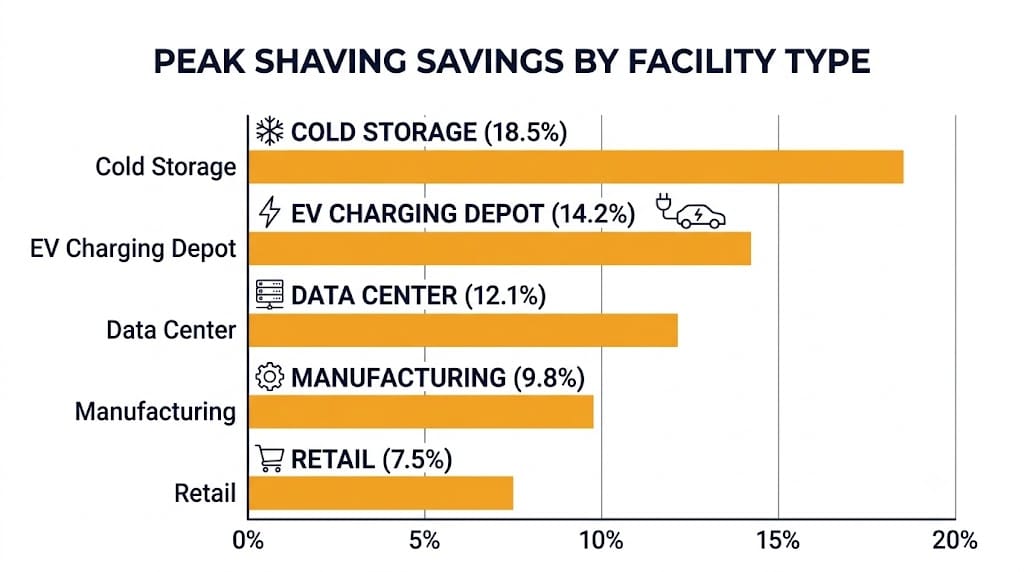
Savings scale with two factors: how “peaky” your load is, and how aggressive your local demand charge rate is. Specifically, sites with a high peak-to-average ratio see the largest percentage reduction. Why? Because a BESS only needs to shave the top of the curve, not carry the full load.
Facility Type
Typical Peak-to-Average Ratio
Typical Demand Charge Reduction
Retail / light commercial
1.3 – 1.6x
15–25%
Manufacturing (batch processes)
1.8 – 2.5x
30–45%
Data center / server room
1.1 – 1.3x
10–15%
EV charging depot
2.5 – 4x+
40–60%
Cold storage / refrigeration
1.6 – 2.2x
25–35%
Manufacturing and EV charging sites tend to see the largest savings. That’s because their load spikes are sharp, short, and predictable — exactly the profile a BESS handles best. Data centers, on the other hand, run a comparatively flat load around the clock. Consequently, there’s simply less peak to shave.
Worked Example: Calculating Your Peak Shaving Savings
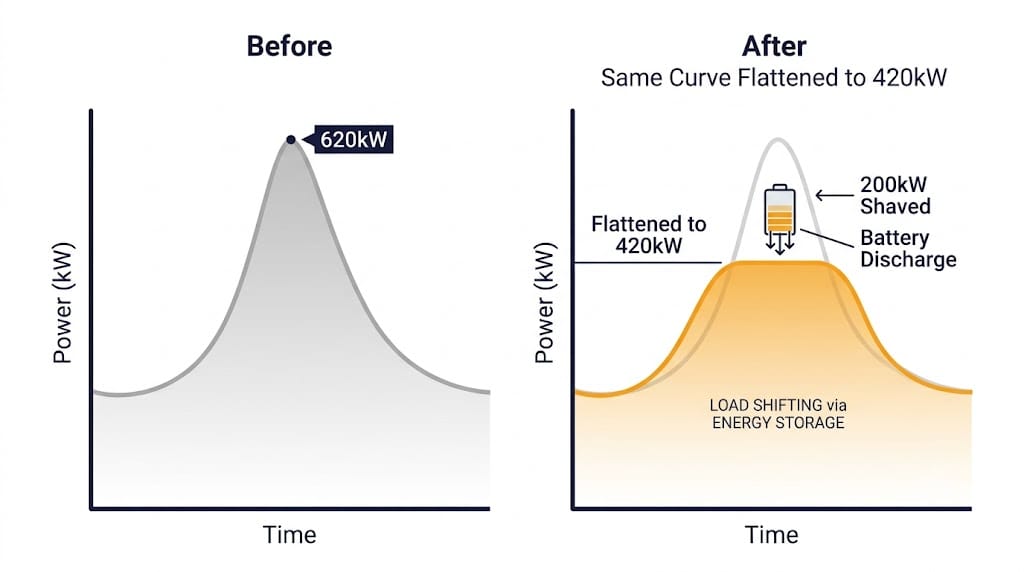
Here’s how that plays out for a manufacturing site on a typical tariff. First, the site starts with a 620 kW peak demand and a $14.50/kW demand charge rate. Next, a 200 kW BESS shaves the peak down to 420 kW. As a result, the monthly savings come to 200 kW × $14.50 = $2,900. Over a year, that’s $34,800 in demand charge savings alone.
It’s worth noting this example doesn’t include energy arbitrage — charging during off-peak rates and discharging during on-peak ones. Nor does it include any grid services revenue. Both stack on top of pure demand charge savings; see our energy arbitrage guide for that math.
Payback Period and ROI
Payback period depends on three things: system cost per kWh, financing structure, and how many revenue streams the BESS is stacking. As a rough guide, here’s what demand-charge-only paybacks typically look like:
BESS Size
Typical Installed Cost
Monthly Savings (demand only)
Simple Payback
100 kWh / 50 kW
$35,000 – $50,000
$700 – $1,000
4 – 6 years
400 kWh / 200 kW
$140,000 – $190,000
$2,500 – $3,200
4.5 – 6.5 years
1 MWh / 500 kW
$320,000 – $420,000
$6,000 – $8,500
4 – 5.5 years
Installed cost ranges reflect LFP BESS pricing; see our BESS cost per kWh breakdown for the full cost model.
Layering in energy arbitrage or frequency regulation typically shortens payback by 20–35%, compared to demand-charge-only savings. For the full revenue-stacking model, see our C&I BESS economics guide.
What Affects Your Specific Savings
Utility tariff structure. Flat demand rates and time-of-use (TOU) demand rates produce very different math. As a result, TOU sites often see larger savings, since their peaks align with the highest-priced windows. You can check your own utility’s rate structure using the DOE’s Utility Rate Database.
Load profile predictability. Predictable, repeating peaks — like manufacturing shifts or EV charging schedules — are easier to shave accurately than erratic, one-off spikes.
Battery sizing accuracy. An undersized BESS shaves less of the peak than needed. Conversely, an oversized one adds unnecessary capital cost without proportional savings. For this reason, proper sizing requires 12 months of interval data, not a single bill.
Existing power factor correction. Sites without PF correction sometimes see apparent demand charge inflation that a BESS alone won’t fully resolve.
Ratchet clauses. Some utilities set your demand charge based on the highest peak in the past 11–12 months, not just the current month. Therefore, this changes the payback calculation, and usually favors more aggressive peak shaving.
Frequently Asked Questions
How much does peak shaving save on electricity bills?
Most sites see 20–40% reductions in demand charges, which typically make up 30–70% of the total bill. However, actual savings depend on your peak-to-average load ratio and local demand charge rate.
What size battery do I need for peak shaving?
Size the power rating (kW) to your target peak reduction, and the energy capacity (kWh) to cover your typical peak duration — usually 1–3 hours for commercial sites. That said, a proper sizing study needs 12 months of 15-minute interval data.
Is peak shaving worth it for small commercial sites?
It depends. Sites with demand charges above $10/kW and a peak-to-average ratio over 1.5x generally see paybacks under 6 years. On the other hand, flatter-load sites — like most data centers — see smaller percentage savings.
Does peak shaving pay back faster with revenue stacking?
Yes. Adding energy arbitrage or grid services typically cuts payback by 20–35%, since the same battery capacity earns value in multiple ways across the day.
Next Steps
Ready to model your own savings? Start by pulling 12 months of interval data from your utility bill. Then, use our BESS cost per kWh guide to estimate installed cost, and apply the formula above to project payback. For the broader strategic picture, including how peak shaving compares to load shifting, see our complete peak shaving vs. load shifting guide.
LiFePO₄ batteries are known for their long lifespan, stable chemistry, and safety. However, like all lithium-based chemistries, their cycle life is highly influenced by operating temperature.
If you want your LiFePO₄ battery to last thousands of cycles, understanding the impact of temperature is critical.
Example: If a LiFePO₄ battery starts at 100 Ah capacity and is considered “end-of-life” at 80 Ah, the number of cycles to reach this point is its cycle life.
Why Temperature Matters
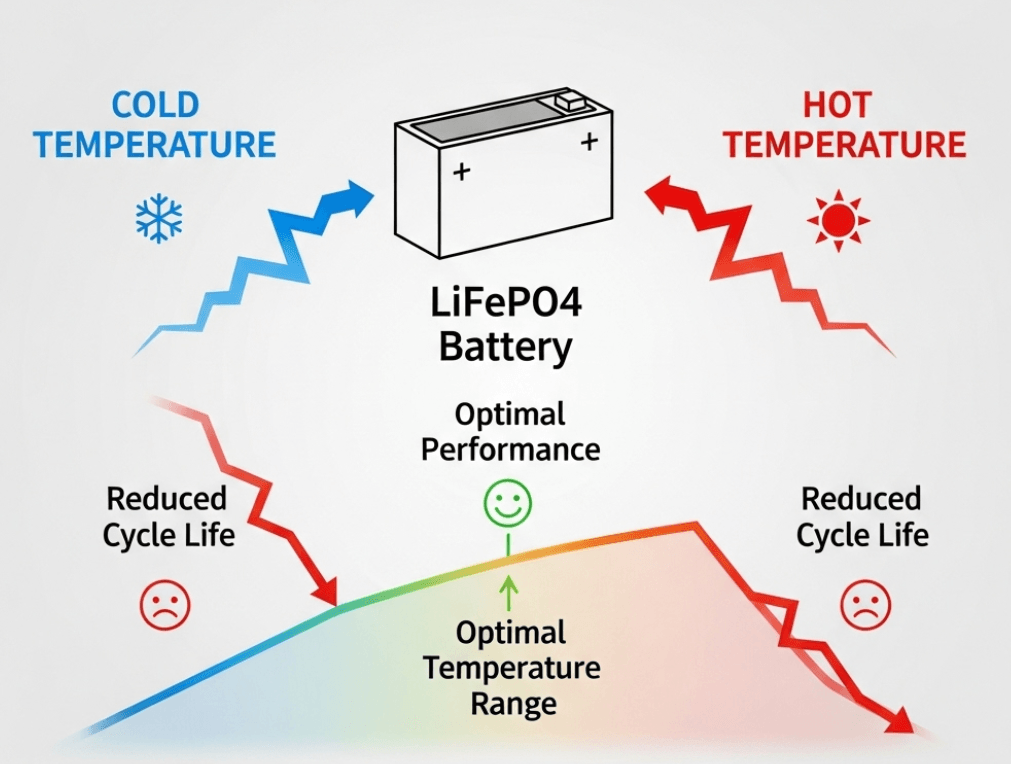
Temperature affects the electrochemical reactions, internal resistance, and degradation rate of LiFePO₄ cells:
High Temperatures (>40 °C)
Speeds up electrolyte decomposition.
Causes lithium plating and faster SEI (Solid Electrolyte Interface) growth.
Shortens cycle life drastically.
Low Temperatures (<0 °C)
Reduces ionic mobility.
Increases internal resistance.
May cause lithium plating during charging.
Optimal Range (15 °C – 30 °C)
Best balance between performance and longevity.
Minimal degradation rate.
Cycle Life at Different Temperatures – Datasheet Example
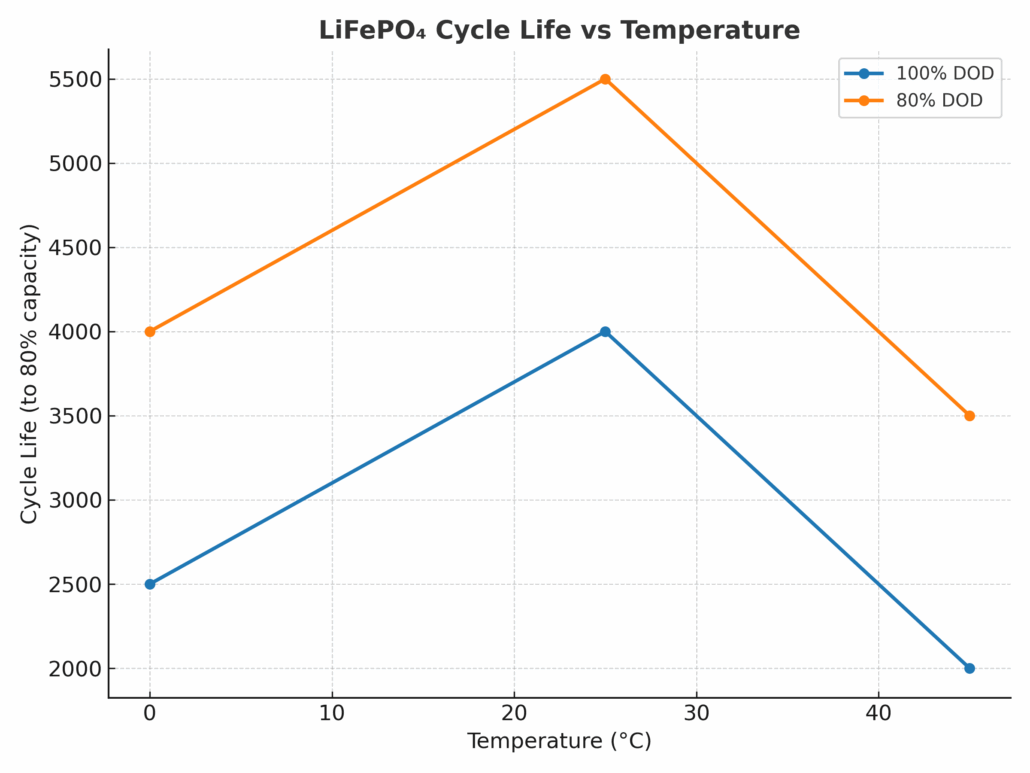
Let’s take an example from a typical LiFePO₄ cell datasheet (values are representative of many commercial cells):
Temperature
Depth of Discharge (DOD)
Cycle Life (to 80% capacity)
25 °C
100% DOD
3,500 – 4,000 cycles
25 °C
80% DOD
5,000 – 6,000 cycles
45 °C
100% DOD
~2,000 cycles
45 °C
80% DOD
~3,500 cycles
0 °C
100% DOD
~2,500 cycles
0 °C
80% DOD
~4,000 cycles
Key Takeaways from the Table:
Going from 25 °C to 45 °C can cut cycle life almost in half.
Shallower depth of discharge (DOD) greatly extends life at any temperature.
Low temperatures reduce cycle life but not as severely as high heat.
Formula – Estimating Temperature Impact on Cycle Life
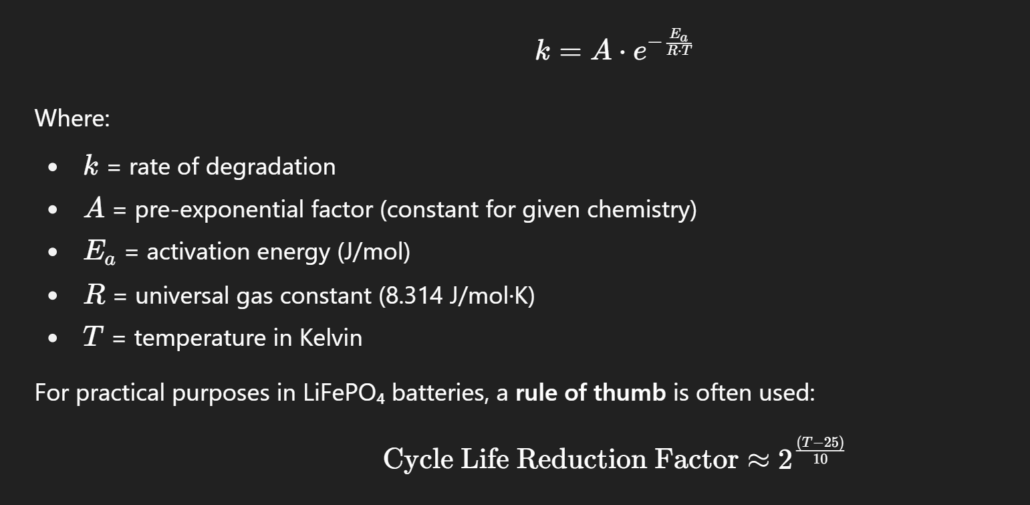
Many battery engineers use a simplified Arrhenius equation to estimate how temperature affects degradation:
Meaning:
Every 10 °C increase above 25 °C halves the cycle life.
Every 10 °C decrease below 25 °C increases life slightly, but at the cost of lower performance.
Ensures cells are operated within safe voltage and temperature limits.
Final Thoughts
Temperature has a direct, measurable impact on LiFePO₄ cycle life. While the chemistry is far more temperature-tolerant than other lithium-ion types, excessive heat is still the fastest way to kill a battery.
By keeping your batteries in the optimal range, using a good BMS, and managing DOD, you can achieve 5,000+ cycles and over 10 years of reliable performance.