IEC 62619 is the international safety standard that most industrial and commercial BESS suppliers get asked for first. Cell datasheets cite it, and procurement checklists demand it. But the standard rarely gets explained beyond a single bullet point in a longer certifications guide. So this article breaks down what it tests. It also covers what changed in the current edition, and how it fits alongside UL 1973 and IEC 63056.
Quick Answer IEC 62619:2022 is the international safety standard for rechargeable lithium cells and batteries in industrial applications. It covers stationary uses like BESS, UPS, and telecom backup, plus motive uses like forklifts and AGVs, but excludes road vehicles and consumer devices. The current edition added mandatory thermal runaway propagation testing, a formal BMS safety analysis, EMC testing, and overcurrent protection checks.
What Is IEC 62619?
IEC 62619 is published by the International Electrotechnical Commission’s Subcommittee 21A. Its full title is long, but in short: safety rules for lithium cells and batteries used in industry. The standard sets out the tests needed to show a lithium cell or battery is safe. This applies under both normal use and fault conditions.
The scope is industrial, not consumer. So it covers two broad groups:
Stationary applications — telecom power, uninterruptible power supplies (UPS), electrical energy storage systems, utility switching, and emergency power
Road vehicles are excluded. Where a conflict exists, standards written for automotive traction batteries take precedence instead (the IEC 62660 series). Consumer and portable devices sit under a separate standard, IEC 62133-2, rather than this one. For electrical energy storage systems, suppliers often pair IEC 62619 with a companion standard, IEC 63056. That standard adds rules built for EESS use. More on that distinction below.
The current edition is IEC 62619:2022 (Edition 2.0, published 24 May 2022). It replaced the original 2017 first edition. Europe adopts it through the EN and BS EN routes. Companies also often use the standard alongside CE marking for industrial battery systems.
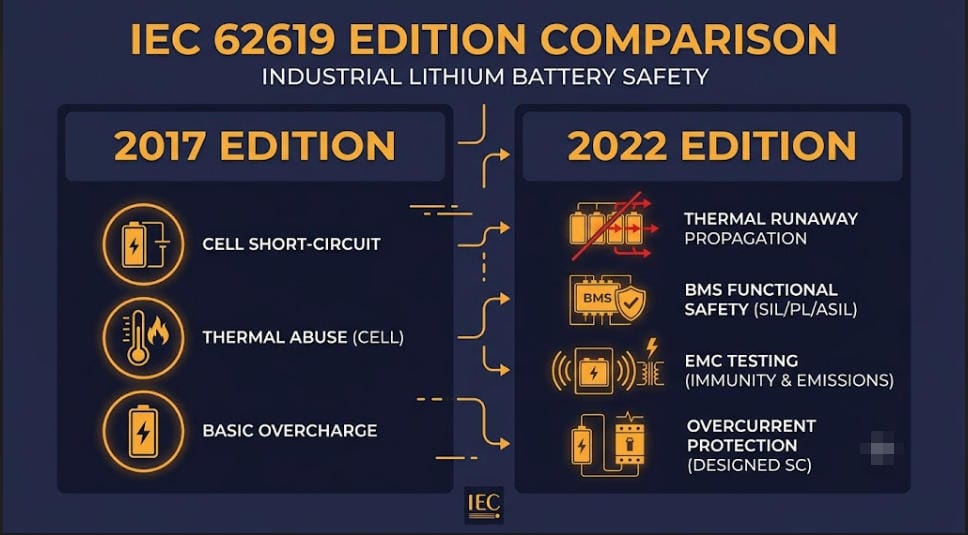
What Changed Between the 2017 and 2022 Editions
The second edition of IEC 62619 is a meaningfully stricter document. It is not a light refresh. Instead, the main additions concern system-level safety, not cell chemistry. This shift reflects how the industry moved from single-cell risk toward large multi-cell BESS deployments between 2017 and 2022.
Area
What Changed in the 2022 Edition
Thermal runaway propagation
Became a mandatory test. It was present informally since 2017 but is now formalized and expanded. A new laser-ignition method was added as an alternative trigger.
BMS functional safety
New rule for a formal safety analysis of the BMS. This references frameworks such as IEC 61508 (targeting SIL-2) or ISO 13849.
Overcurrent protection
New test checking that circuit protection triggers correctly under abnormal charge or discharge current.
Electromagnetic compatibility (EMC)
New rule showing BMS protection functions aren’t disrupted by outside electromagnetic interference.
System locks / fail-safe states
Clarified rules for preventing an unsafe automatic restart after a fault.
What the Standard Actually Tests
IEC 62619 testing runs across four categories: electrical, mechanical, environmental, and system-level. First, cell-level tests confirm the chemistry and build are safe. Then, system-level tests take over — newer and heavier in the 2022 edition. Together, they confirm the battery and its BMS respond correctly when something goes wrong.
Electrical Safety Tests
Overcharge — the test charges the cell or battery to roughly 1.5x rated voltage for an extended hold. No fire or explosion may occur. This shows the protection circuit or BMS cuts off correctly.
External short circuit — the test shorts the terminals through a low-resistance path. Surface temperature must stay well below thermal-runaway onset.
Forced discharge — the test discharges the battery below its minimum voltage, then checks for safe behaviour and a minimum capacity recovery on recharge.
Overcurrent protection (2022 addition) — shows the protection circuit activates correctly under abnormal charge or discharge current.
Mechanical and Environmental Tests
Crush — the test applies a defined force to the battery face. No fire or explosion may occur.
Free fall — drop testing across several orientations onto a hard surface. Checks for electrolyte leakage, fire, or explosion.
Vibration and shock — simulates transport and in-service stress without loss of function.
Temperature cycling — repeated cycling across a wide temperature band. A minimum capacity retention threshold applies at the end.
Thermal abuse — external heating beyond the maximum rated temperature. Evaluates the failure response.
System-Level Safety Tests
This is where the 2022 edition diverges most from 2017. Instead of behaving like a cell-safety spec, the standard now reads more like a system-safety framework.
Thermal runaway propagation — the test deliberately drives a single cell into thermal runaway, then checks the failure doesn’t spread to neighbouring cells. This test matters most for large-format BESS design, since isolated cell failures inside a multi-megawatt-hour system count as a near-certainty over a 15-20 year service life. The goal is a contained, graceful failure, not zero failures.
BMS functional safety analysis — the test checks the BMS against a recognised safety framework. Triple monitoring of voltage, current, and temperature is typical at cell or module level, plus fast auto-disconnect on fault.
Communication fault handling — the system must enter a safe state if it loses BMS-to-host communication.
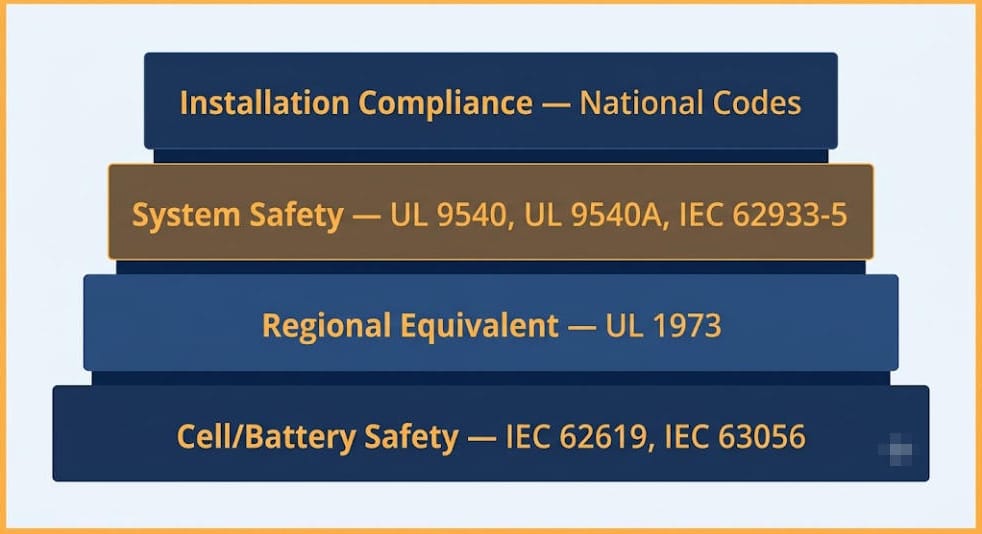
IEC 62619 rarely sits alone on a certification checklist. It’s one layer in a stack. That stack spans cell chemistry, system safety, installation, and transport. Here’s how it maps against the standards it’s most often confused with. This comparison draws on the IECEE CB Scheme documentation that governs how these certificates get issued and recognised worldwide.
US stationary and motive auxiliary power battery safety
Regional equivalent for the US market. Most North American stationary ESS installs require UL 1973 specifically, so global suppliers often hold both UL 1973 and this standard.
IEC 63056
Safety rules for secondary lithium batteries used in electrical energy storage systems
A companion standard, not a substitute. This standard sets the general industrial baseline, while IEC 63056 layers on EESS-specific rules. So ESS suppliers are often asked for both.
System- and grid-level safety for electrical energy storage systems
Sits above IEC 62619 in the stack. This standard certifies the cell or battery product, then IEC 62933-5 covers safety once that battery joins a full grid-connected system.
Safety of power converters (PCS/inverters) used in PV and ESS
Covers the inverter side, not the battery. This standard and IEC 62109 are complementary, since a full system needs certified batteries and a certified PCS.
Certification vs. Installation Compliance
One point worth remembering: this standard tests the battery product itself. It says nothing about whether an installation is legal in a given country. In Australia, for example, a certified battery module still has to separately satisfy AS/NZS 5139 for installation safety, AS/NZS 4777.2 for inverter compliance, and AS/NZS 3008.1.1 for cable sizing. So, product certification and installation compliance are two different layers. See our full breakdown in Australia’s New Battery Rules: The 2026 Compliance Stack.
Who Needs IEC 62619 Certification
Commercial & industrial (C&I) BESS makers and integrators
Utility-scale energy storage suppliers
Telecom backup power and UPS system makers
Industrial motive power — forklifts, AGVs, and similar equipment
Residential/home ESS suppliers — this standard is often part of the certification stack here too, though household rules sometimes point to IEC 60335 or IEC 63056 instead
Buyers should ask for cell-and-pack-level certification specifically. A component-level test report from one sub-supplier is not enough, since system integration, BMS logic, and enclosure design all affect whether certified parts stay safe once assembled.
Regional Recognition
Region
How It Is Recognised
International (CB Scheme)
50+ member countries accept test reports and certificates issued under the IECEE CB Scheme. This avoids duplicate testing when entering multiple markets.
Europe
Europe uses EN IEC 62619:2022 / BS EN IEC 62619:2022. Manufacturers commonly cite it for CE marking under the Low Voltage Directive.
India
IS 17855:2022 aligns closely with this standard. Large utility and industrial BESS tenders require it. Testing must happen at BIS-approved labs or accredited labs with a BIS agreement.
China
GB/T 36276 is the primary domestic standard for lithium-ion energy storage batteries. This standard is used as the international equivalent instead, for export-facing products.
Australia & New Zealand
One of the battery certifications commonly requested, alongside UL 1973 and UN 38.3. But it does not replace AS/NZS 5139 installation compliance — see our Australia battery rules hub for the full stack.
The Certification Process, in Brief
IEC 62619 certification typically runs through the IECEE CB Scheme:
Submit the application to an IECEE-recognised National Certification Body (NCB) with product docs, cell/battery specs, and BMS design details
The lab tests samples at an accredited CB Test Laboratory (CBTL) against the full test matrix
The lab issues a CB Test Report (CBTR) and CB Test Certificate (CBTC) on success
The CB certificate then converts into national certificates (CE, KC, SAA, and others). This is usually faster than a fresh national bid, since it draws on the existing CB test report
Timelines vary by scope and lab backlog. Full testing commonly runs several weeks to a few months. This depends on sample availability and whether early testing surfaces issues that need a redesign. So, ask suppliers for the CB Test Certificate itself and the full test report. Also confirm which edition, 2017 or 2022, it references. The 2022 edition is now the one expected for new product submissions.
IEC 62619 Compliance Checklist
Check the certificate references IEC 62619:2022, not the superseded 2017 edition
Request the full CB Test Report, not just the summary certificate
Verify the submission includes thermal runaway propagation results — this test matters most for multi-cell BESS safety
Check the BMS has a functional safety analysis (IEC 61508 SIL-2 or ISO 13849) in the submission
Check whether the application also needs IEC 63056 certification for the specific EESS use
For the US market, confirm whether the market requires UL 1973 too
Don’t treat this standard as a stand-in for system-level or installation rules. Check UL 9540/9540A, IEC 62933-5, or the local installation code separately
For transport, confirm the supplier holds UN 38.3 certification separately — this standard doesn’t cover it
Frequently Asked Questions
Is IEC 62619 mandatory?
IEC 62619 is a voluntary international standard, not a law. But it’s mandatory in practice across most industrial and utility-scale BESS procurement. Buyers, insurers, and financiers routinely list it as a minimum requirement, and some national tenders, including large BESS tenders in India, name it directly as mandatory.
Does IEC 62619 cover the whole BESS system or just the battery?
It covers the cell and battery product, including its BMS. But it does not cover the full assembled system. Enclosure design, fire suppression, inverter safety (IEC 62109), and grid-level integration (IEC 62933-5) all sit outside its scope.
What’s the difference between IEC 62619 and IEC 63056?
IEC 62619 sets general industrial safety rules for lithium cells and batteries. IEC 63056, meanwhile, is a companion standard with rules specific to electrical energy storage use. So suppliers commonly hold both together, not as alternatives.
Do I need both IEC 62619 and UL 1973?
Only if the product sells into both international and US markets. UL 1973 is what US utilities, AHJs, and insurers expect for stationary ESS, while IEC 62619 is the equivalent almost everywhere else. So global suppliers commonly hold both.
What was the biggest change in the 2022 edition?
The mandatory thermal runaway propagation test, plus the new rule for a documented BMS safety analysis. Both reflect the shift from single-cell risk thinking toward large, multi-cell stationary BESS.
The 20/80 rule for batteries is one of the most repeated tips in battery care. It is also one of the most misunderstood. Open any EV forum or BESS manual, and you will read the same line. Keep the battery between 20% and 80% state of charge.
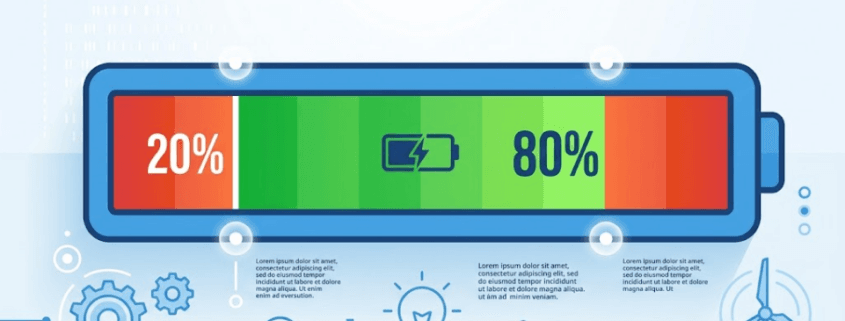
For lithium-ion batteries, the 20/80 rule sets a charging window. It avoids the two extremes of state of charge (SoC) that speed up wear. Stay above 20% SoC. Stay below 80% SoC. Do that, and the battery lasts longer. This applies to a phone, an EV, or a multi-megawatt BESS alike.
But for BESS buyers, the 20/80 rule raises a hard question. If 60% of capacity is the “safe zone,” what happens to the rest? Is 40% just stranded capital, sitting idle in a container? And does a rule built for phones and EVs even fit a grid-connected LFP system, built for daily cycling over 15 to 20 years?
This guide answers that question from first principles. First, we cover the electrochemistry behind the rule. Next, we compare it with other SoC windows. Then, we look at how chemistry and BMS design change the picture. Most importantly, we ask whether the cycle life gains are worth the lost capacity in real BESS projects.
1. What Is the 20/80 Rule for Batteries?
The Basic Definition
State of charge (SoC) measures how much energy a battery holds right now. It is shown as a percentage of usable capacity. A battery at 100% SoC is full. A battery at 0% SoC has hit its lower cutoff. That cutoff is not zero volts, though. The BMS always keeps a safety margin below it.
In short, the 20/80 rule means one thing. Keep charging and discharging inside the 20% to 80% SoC band. Do not let the battery swing from empty to full on every cycle. As a result, the operating window equals 60% of usable capacity.
Here is the formula, stated plainly:
Formula — the 20/80 rule for batteries: Effective Depth of Discharge (DoD) = Upper SoC limit − Lower SoC limit 20/80 rule → Effective DoD = 80% − 20% = 60% A battery cycled strictly within 20–80% SoC never exceeds a 60% depth of discharge on any single cycle, regardless of nameplate capacity.
The 20/80 Rule Is Not a Safety Limit
It helps to separate the 20/80 rule from the absolute safety limits set by the Battery Management System (BMS). The BMS hard cutoffs sit close to 0% and 100%, on the cell’s true voltage range. These exist for one reason: to stop over-charge and over-discharge events that cause safety failures.
Those safety limits are not arbitrary, either. They trace back to formal standards such as IEC 62619, which sets safety requirements for industrial lithium battery systems. The 20/80 rule, by contrast, operates well inside those hard limits. It is simply a usage strategy for longevity, not a safety boundary.
The table below shows how SoC windows map to depth of discharge. This is the same language used on every BESS datasheet.
2. The Science Behind the 20/80 Rule for Batteries
Why does the 20/80 rule exist at all? The answer sits inside the cell. Specifically, it comes down to what happens physically at the extremes of state of charge.
Why High SoC (Above 80%) Speeds Up Degradation
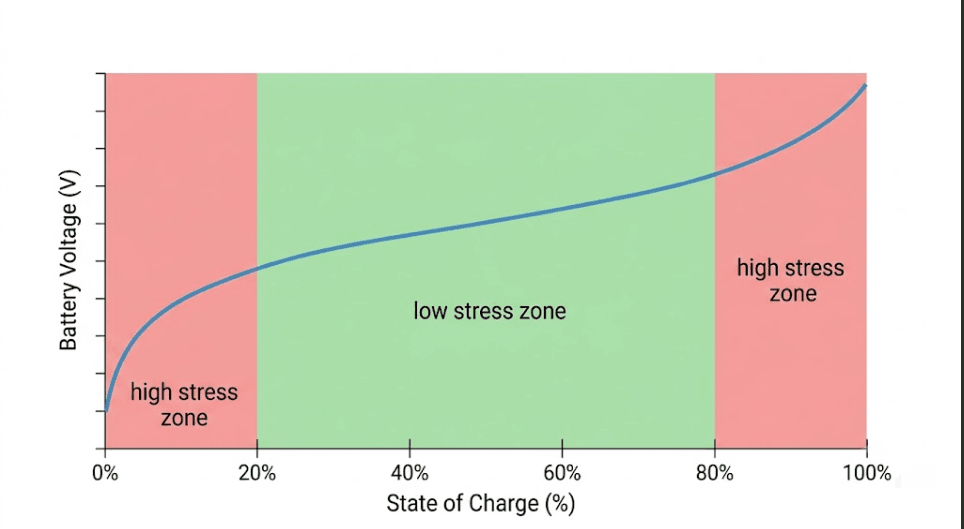
As a cell nears full charge, the cathode reaches peak lithium depletion. Voltage peaks too. As a result, this high-voltage state strains the cathode’s crystal lattice. Over many cycles, that strain adds up to real structural wear.
At the same time, the electrolyte faces its highest oxidative stress near full charge. This, in turn, speeds up electrolyte breakdown. It also drives further growth of the solid electrolyte interphase (SEI) layer on the anode.
The SEI layer is a thin film that forms naturally on the anode. In small amounts, it is actually useful. It protects the anode from further reaction with the electrolyte. However, SEI growth consumes active lithium over time. It also raises internal resistance. Because SEI growth depends heavily on voltage and temperature, both factors climb when a cell sits near 100% SoC, especially during storage.
Why Low SoC (Below 20%) Also Speeds Up Degradation
At the other extreme, very low SoC pushes the cell close to its minimum voltage cutoff. This raises the risk of copper dissolution from the anode’s current collector. The risk grows further still if the cell drifts below its minimum voltage during storage, through normal self-discharge.
Repeated deep discharges add a different kind of stress, too. On the next charge, lithium ions must fully repopulate the lattice. This places real mechanical strain on the cathode. This places real mechanical strain on the cathode. For the full mechanism behind that strain — including why deep cycling causes particle cracking over time — see our guide on Why Deep Discharge and High C-Rate Stress LFP Cells.
This is not just theory. A widely cited 2023 study on Tesla lithium-ion cells tested several SoC windows. The pattern was clear. Cells held at very high or very low SoC degraded faster than cells held at moderate SoC. Notably, the shortest service life showed up in cells cycled below 25% SoC.
The Electrochemical “Sweet Spot” in the Middle
Between these two extremes sits a calmer stretch of the voltage curve. Here, both electrodes face comparatively low stress. This, in fact, is the electrochemical basis for the 20/80 rule. By skipping the top and bottom 20% of the SoC range, a battery spends its life in the zone where SEI growth, electrode strain, and electrolyte oxidation all move slowest.
Separately, research into partial state of charge (PSoC) cycling backs this up further. Cycle life improves when a fixed amount of charge is cycled from a partial state, rather than from full charge. One widely referenced study confirmed this directly. The effect grew stronger still when depth of discharge was also reduced. In effect, this is the scientific backbone of the 20/80 rule, applied right at the cell level.
3. The 20/80 Rule for Batteries vs Other SoC Windows
The 20/80 rule is the most common SoC window in consumer guidance. But it is not the only one in use. BESS specs, EV guidance, and standby power systems each favour slightly different windows. The right choice depends on how usable capacity and cycle life get weighted for that specific application.
How the 20/80 Rule for Batteries Compares to Other SoC Windows
SoC Window
Effective DoD
Relative Cycle Life Impact
Usable Capacity Retained
Typical Use Case
0–100%
100%
Baseline (shortest cycle life)
100%
Maximum-capacity applications; rarely recommended for daily cycling
10–90%
80%
Moderate improvement over 0–100%
80%
Grid-scale LFP BESS, EV daily-use presets
20–80%
60%
Significant improvement; the 20/80 rule for batteries
60%
Consumer EV/phone guidance, residential storage
30–70%
40%
Maximum improvement for calendar aging
40%
Long-term standby SoC, seasonal storage, shipping
Two Patterns Worth Noting
First, SoC window width and cycle life do not scale in a straight line. The jump from 0–100% to 10–90% brings a meaningful gain. But the next jump, from 10–90% to 20–80%, brings a smaller gain. This holds true even though both moves cut DoD by 20 points.
Second, the 30/70 window rarely gets used for daily cycling. It simply gives up too much usable capacity. Instead, it works best as a storage SoC — the level a battery should sit at when idle for weeks or months. During storage, calendar aging drives degradation, not cycling.
Why BESS Often Defaults to 10–90% Instead
For BESS specifically, the 10–90% window has become the common middle ground for LFP systems. Here is why. LFP’s flat voltage curve, covered in Section 5, makes the gain from 10–90% to 20–80% quite small. Meanwhile, that extra 10% of usable capacity carries real commercial value.
4. How the 20/80 Rule for Batteries Affects BESS Sizing
Every BESS datasheet draws a line between two figures. Nameplate capacity is the total rated energy storage of the system. Usable energy is nameplate capacity multiplied by the operating depth of discharge. The SoC window sets this usable energy figure directly. As a result, it becomes one of the most consequential decisions in BESS sizing.
For more on how DoD interacts with other specs, see our guide to BESS specifications.
A Worked Sizing Example
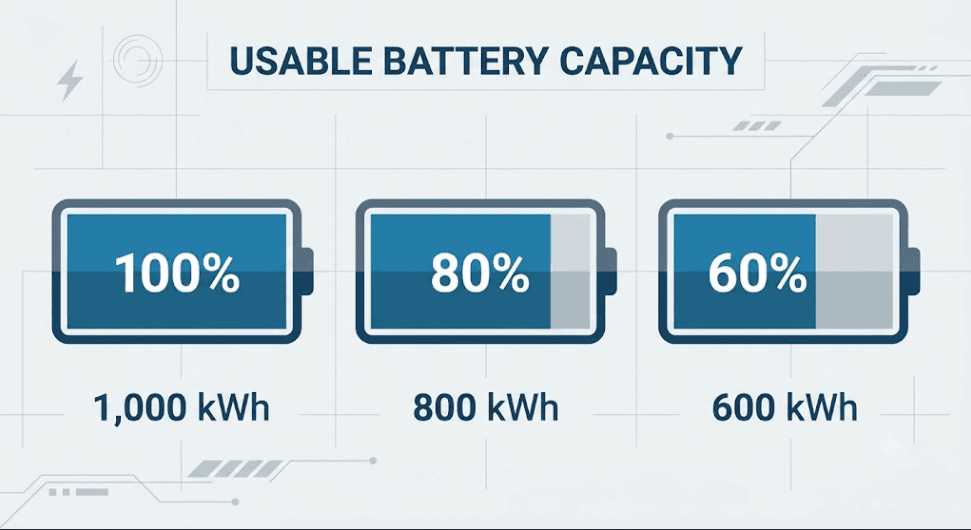
Consider a 1 MWh nameplate BESS under three SoC strategies:
SoC Window
Effective DoD
Usable Energy (1 MWh nameplate)
“Lost” Capacity
0–100%
100%
1,000 kWh
0 kWh
10–90%
80%
800 kWh
200 kWh
20–80% (20/80 rule)
60%
600 kWh
400 kWh
On paper, the 20/80 rule strands 400 kWh out of every cycle. That is 40% of the installed asset. In practice, however, BESS designers handle this two ways.
The first approach is to oversize the nameplate capacity. This way, usable energy under the chosen SoC window still meets the project’s requirement. For example, a project needing 600 kWh of usable energy, under a 20/80 window, must size the nameplate capacity near 1 MWh, not 600 kWh.
The second approach is to accept the narrower usable energy figure instead. From day one, the dispatch strategy, tariff arbitrage, or backup duration gets designed around that smaller number. Both approaches work. The right choice depends on whether capital cost or long-term degradation is the binding constraint for that project.
Sizing Formula and Worked Example
Sizing rule of thumb: Required nameplate capacity = Required usable energy ÷ Effective DoD Example: a site needs 600 kWh of usable energy and will operate at 20/80 (60% DoD). Required nameplate capacity = 600 kWh ÷ 0.60 = 1,000 kWh (1 MWh) By comparison, the same 600 kWh requirement under a 10/90 window (80% DoD) needs only 750 kWh nameplate — a smaller, lower-cost system.
Why Warranty Terms Matter Just as Much
Warranty terms matter just as much as the SoC window itself. A BESS warranted for a set cycle count at 90% DoD reaches end-of-life on a different timeline than the same cell warranted at 60% DoD. So, always confirm which DoD figure the warranty’s cycle-life guarantee assumes. Manufacturers calculate end-of-life projections against one specific operating window, not whatever SoC range the system ends up running in practice.
5. The 20/80 Rule for Batteries by Chemistry: LFP vs NMC vs NCA vs LTO
Why NMC and NCA Are More Sensitive to SoC Extremes
The 20/80 rule did not start in the BESS industry. Instead, it became popular through consumer electronics and EV guidance, where NMC and NCA cathode chemistries dominate. These chemistries carry a steep voltage curve across the SoC range. So, small changes in SoC produce larger changes in cell voltage. That, in turn, means larger swings in the electrochemical stress covered in Section 2.
Why LFP Tolerates a Much Wider Window
LFP (Lithium Iron Phosphate) behaves quite differently. It is now the leading chemistry for stationary BESS. LFP has a notably flat voltage curve across most of its range. As a result, the voltage gap between 30% SoC and 70% SoC stays small. Compare that to an NMC cell, where the same gap is much larger. Consequently, LFP cells care less about exactly where the SoC window sits. They also tolerate the top and bottom of the range far better than NMC or NCA.
Chemistry Comparison Table
Chemistry
Voltage Curve Shape
Sensitivity to SoC Extremes
Typical Recommended Window
Common BESS DoD Spec
LFP
Flat across most of range
Low — tolerant of wide windows
5–95% (or wider)
90–95% DoD
NMC
Steep, especially at high SoC
High — benefits significantly from 20/80
20–80%
50–80% DoD
NCA
Steep, similar to NMC
High — most sensitive to high SoC
20–80%
50–80% DoD
LTO
Very flat, stable anode
Very low — minimal benefit from narrowing
0–100% viable
95–100% DoD
Why This Matters for Buyers
This is exactly why DoD specifications on commercial LFP BESS datasheets sit at 90–95%. Meanwhile, consumer guidance for NMC-based phones and EVs sticks with the much narrower 20/80 window. After all, forcing a strict 20/80 rule onto a grid-scale LFP system would strand a large slice of installed capacity. Given LFP’s flat curve, the degradation benefit simply would not justify it.
Chemistry is not the only factor that shapes how hard a cell can be pushed, though. Charge and discharge rate matters too, which we cover in our guide to BESS C-rate.
That said, the underlying principle still applies to LFP. Avoid long dwell time at very high or very low SoC, especially during idle storage. The difference is one of degree, not of kind. LFP systems can run much closer to the 0% and 100% extremes during active cycling, without the same penalty NMC or NCA cells would face.
6. How the BMS and EMS Enforce the 20/80 Rule for Batteries
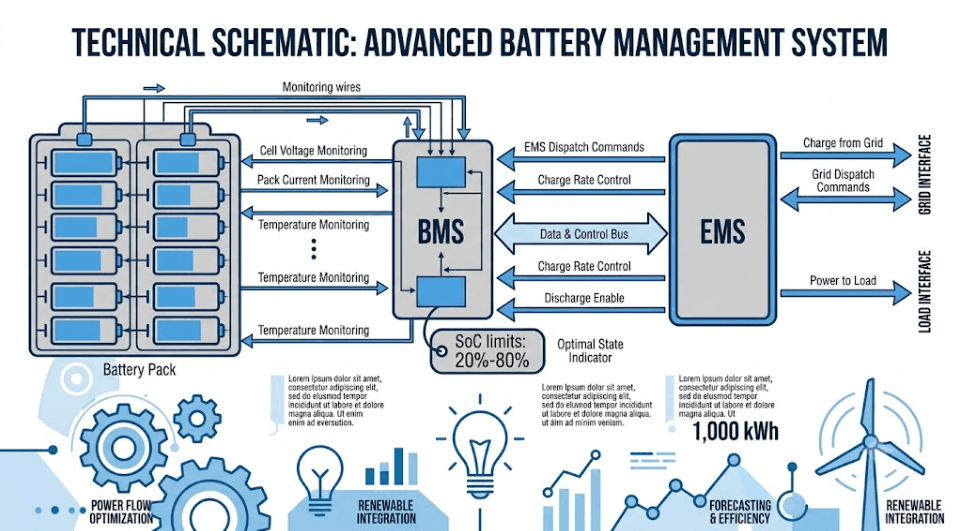
In a real BESS, the 20/80 rule — or whichever SoC window applies — is not left to chance. Instead, it gets enforced through two systems working together. The Battery Management System (BMS) handles cell and pack-level protection. The Energy Management System (EMS) handles dispatch planning.
BMS-Level Enforcement: Translating SoC Limits Into Voltage Cutoffs
The BMS does not directly “see” SoC as a clean percentage. Instead, it measures cell voltage and current. From there, it estimates SoC using coulomb counting, which tracks current flow over time. This estimate then gets cross-checked against the cell’s open-circuit voltage (OCV) curve. To enforce a 20/80 window, the BMS applies soft limits. These limits map to the voltage levels tied to 20% and 80% SoC, for that specific chemistry. So, when the pack nears either limit, the BMS signals the EMS to stop charging or discharging in that direction.
Why SoC Estimation Drifts — and Why Occasional Full Cycles Matter
Coulomb counting builds up small errors over time. As a result, the BMS’s SoC estimate slowly drifts from the cell’s true SoC. The fix is simple, though. Periodically, the cell gets allowed to reach a known reference point on its voltage curve, typically near full charge. There, SoC can be recalibrated with high confidence.
This creates a practical tension with the 20/80 rule. A system run permanently within 20–80% SoC may see growing estimation error over months. Without occasional full-range calibration cycles, that drift only gets worse.
Fortunately, most commercial BMS platforms handle this automatically. They schedule a periodic calibration charge to a higher SoC, during a low-demand period. Then, they return to the configured operating window. This is simply a normal part of long-term SoC accuracy. It is not a violation of the SoC window strategy.
EMS-Level Enforcement: Dispatch Planning Within the Window
The BMS protects the cells from exceeding configured SoC limits. The EMS, meanwhile, plans dispatch so the battery rarely needs to hit those limits at all. A well-tuned EMS schedules charge and discharge events carefully. So, the battery’s SoC trajectory stays comfortably inside the operating window throughout a typical day. In this way, the BMS’s hard limits remain a safety backstop, not a routine operating boundary.
7. The 20/80 Rule for Batteries Across Different BESS Applications
The 20/80 rule often gets presented as a universal recommendation. In reality, though, the best SoC strategy varies a lot by application. The table below summarises how SoC strategy typically shifts, depending on use case.
Application
Typical SoC Strategy
Rationale
Residential solar + storage (NMC)
20–80% to 10–90%
Balances cycle life with daily self-consumption value; NMC benefits most from narrower windows
C&I peak shaving (LFP)
5–95% (90% DoD)
LFP’s flat voltage curve and high cycle life tolerate wide windows; ROI favours maximum usable energy
Grid-scale arbitrage (LFP)
5–95% to 0–100%
Revenue per cycle often outweighs marginal degradation cost at LFP’s cycle-life scale
Frequency regulation
Centred near 50% SoC
Symmetrical headroom needed to inject or absorb power in either direction at short notice
Backup / UPS standby
Held near 50–60% SoC
Minimises calendar aging during long idle periods between discharge events
Second-life EV battery packs (NMC)
20–80%
Already-degraded cells benefit most from the gentlest possible operating window
Frequency Regulation: Why the Middle of the Range Matters Most
Frequency regulation systems sit deliberately near the middle of their SoC range, often close to 50%. This is not really about the 20/80 rule. Instead, it is about headroom. The system must absorb or inject power within milliseconds of a frequency deviation, in either direction. A battery at 95% SoC has little room left to absorb more charge. One at 5% SoC has little room left to discharge. So, the middle of the range maximises bidirectional response capability.
Backup and UPS: A Different Kind of SoC Challenge
Backup and UPS systems face the opposite challenge. Long idle periods at a fixed SoC get punctuated only occasionally by discharge events. For these systems, the relevant guidance is less about the 20/80 rule. It is more about storage SoC — holding the battery at a moderate level, commonly 50–60%, during idle periods. This approach limits the calendar aging effects covered in Section 2. Both very high and very low storage SoC accelerate SEI growth, even when the battery just sits unused.
Off-grid and islanded systems face a related challenge, since they cannot fall back on the wider grid during a SoC excursion. For more on how that changes BESS design, see our Island Grid BESS engineering guide.
8. Quantifying the 20/80 Rule for Batteries: Cycle Life vs Capacity
Here is the central question for any BESS operator. Does the cycle life gain from a narrower SoC window actually offset the lost usable energy per cycle? The best way to compare strategies is not cycle count alone. Instead, look at total lifetime energy throughput — the cumulative kWh the system delivers before reaching end-of-life capacity.
Illustrative Throughput Comparison
The table below illustrates this trade-off for an NMC-type cell. The figures are illustrative, but they stay broadly consistent with partial state-of-charge cycling research.
SoC Window
Effective DoD
Illustrative Cycle Life (to 80% SoH)
Usable Energy per Cycle (1 MWh nameplate)
Approx. Lifetime Throughput
0–100%
100%
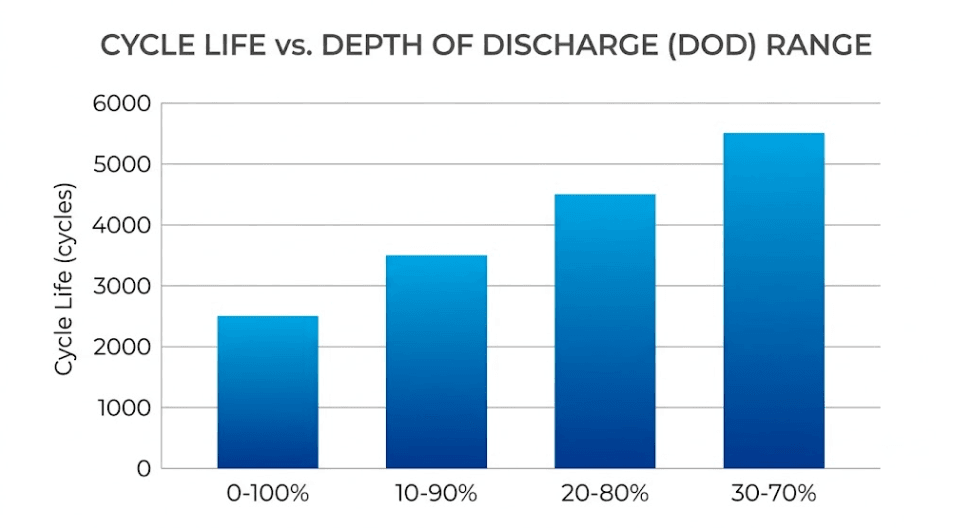
~2,500 cycles
1,000 kWh
~2,500 MWh
10–90%
80%
~4,000 cycles
800 kWh
~3,200 MWh
20–80% (20/80 rule)
60%
~6,000 cycles
600 kWh
~3,600 MWh
30–70%
40%
~9,000 cycles
400 kWh
~3,600 MWh
Two Things Stand Out
First, narrowing from 0–100% to 20–80% boosts lifetime throughput in a real way. In this example, the gain is roughly 44%. Second, that gain flattens out past a certain point. Moving from 20–80% to 30–70% adds many more cycles. Yet total throughput barely moves, because each extra cycle delivers proportionally less energy.
What This Means in Practice
The key insight on lifetime throughput: Total energy delivered ≈ Cycle life × Usable energy per cycle Narrowing the SoC window increases the first term and decreases the second. There is a point — often somewhere between 20/80 and 30/70 for NMC chemistries — beyond which the two effects roughly cancel out. Past that point, further narrowing mainly stretches the calendar timeline, not the total energy delivered.
This carries a direct, practical lesson. The 20/80 rule does not always mean more total energy over the system’s life. What it reliably does, instead, is spread that throughput over a longer calendar period, with lower peak stress per cycle. That matters most when calendar life, warranty terms, or thermal limits are the binding constraint, not total cycle count.
9. Is the 20/80 Rule for Batteries Worth It for BESS Buyers?
From a pure capital-cost view, every point of SoC window removed from the operating range costs something. Either more hardware gets installed to keep the same usable energy, or output gets sacrificed. At typical commercial LFP BESS costs of $220 to $320 per kWh, the math gets concrete fast.
Moving from a 90% DoD strategy to a strict 60% DoD (20/80) strategy, for the same usable energy, means installing roughly 33% more nameplate capacity. That is a substantial capex increase. And it is a steep price for a chemistry whose flat voltage curve already makes the degradation benefit fairly small.
Why LFP Buyers Should Look Beyond 20/80
The calculus changes for NMC and NCA-based systems, where the 20/80 rule’s degradation benefit runs largest. For these chemistries, the extra upfront cost of oversizing is more often worth it. The payoff is a real extension of warranty-covered service life. This matters most where replacement logistics are difficult, such as second-life EV packs or remote and offshore installations.
Tracking that degradation over time matters just as much as the SoC strategy itself. For more on how suppliers estimate remaining battery health, see our guide to DCIR-based State of Health estimation for BESS.
Three Reasons LFP Favours a Wider Window
For most grid-connected commercial and utility-scale LFP BESS, the economically optimal SoC window sits much closer to 5–95% or 10–90% than to 20/80. There are three clear reasons why:
LFP’s flat voltage curve means the marginal degradation cost of the additional 10–30% of usable energy is small.
Revenue-generating applications (arbitrage, demand charge reduction, frequency services) are typically valued per kWh cycled, so reduced usable energy directly reduces revenue.
LFP cycle life figures (3,000–8,000+ cycles to 80% SoH) already provide 10–15+ years of service even at high DoD for most daily-cycling applications.
Overall, the 20/80 rule still earns its place as a default heuristic for NMC/NCA-based systems. It also works well as a long-term storage SoC guideline, across all chemistries. And it remains a sensible starting point for buyers who do not yet have chemistry-specific degradation curves. But it should not be treated as a fixed engineering spec for LFP-dominated stationary storage. Instead, the right SoC window is chemistry-specific and application-specific, not a universal constant.
SoC strategy is just one input into overall project returns. Round-trip losses matter too, and we cover those in our guide to BESS round-trip efficiency (RTE).
10. Best Practices and Common Mistakes With the 20/80 Rule for Batteries
Best Practices
Request chemistry-specific degradation curves (cycle life vs DoD) from your cell supplier rather than relying on generic 20/80 guidance.
For LFP systems, evaluate the 5–95% or 10–90% range as the realistic operating window, reserving 20/80-style restrictions for long-term storage SoC rather than daily cycling.
For NMC/NCA-based systems — including residential storage and second-life EV packs — the 20/80 rule remains a reasonable and well-supported default.
Confirm which DoD value the manufacturer’s cycle-life warranty is based on, and ensure your operating SoC window matches that assumption.
If a system will be idle for extended periods (shipping, seasonal storage, commissioning delays), set the storage SoC to a moderate level — commonly 30–60% — regardless of the chemistry.
Allow the BMS to perform periodic full-range calibration cycles even if the operating SoC window is narrower; this maintains SoC estimation accuracy over the system’s life.
Common Mistakes
Applying consumer EV/phone-based 20/80 guidance directly to a grid-scale LFP BESS without accounting for the chemistry’s much flatter voltage curve.
Sizing a system’s nameplate capacity around a 0–100% assumption, then discovering that the operating SoC policy reduces usable energy below the project’s requirement.
Treating the 20/80 rule as a hard safety limit rather than a usage strategy — and consequently disabling BMS calibration cycles, leading to SoC estimation drift over time.
Ignoring the interaction between SoC window and temperature: high-SoC storage in hot climates compounds calendar aging far more than the same SoC window in a temperate climate.
Comparing two BESS quotes on nameplate capacity and price alone, without checking whether each supplier’s cycle-life warranty assumes a different operating DoD.
11. Frequently Asked Questions: The 20/80 Rule for Batteries
What is the 20/80 rule for batteries?
The 20/80 rule for batteries is a usage guideline. It calls for keeping a lithium-ion battery’s SoC between 20% and 80% during normal use, instead of cycling between 0% and 100%. This creates an effective depth of discharge of 60%. The goal is simple: reduce electrochemical stress at very high and very low SoC.
Does the 20/80 rule apply to LFP batteries used in BESS?
The underlying principle applies to all lithium-ion chemistries. However, LFP’s flat voltage curve makes it far less sensitive to SoC extremes than NMC or NCA. As a result, most commercial LFP BESS datasheets specify depth of discharge in the 90–95% range. That is far wider than the 60% implied by a strict 20/80 rule, with no proportional drop in cycle life.
What SoC should a battery be stored at long-term?
For extended idle periods, such as shipping, seasonal storage, or commissioning delays, most manufacturers recommend a storage SoC in the 30–60% range. This applies regardless of chemistry. Both very high and very low storage SoC speed up calendar aging mechanisms, such as SEI layer growth, even when the battery just sits unused.
Is the 20/80 rule the same as an 80% depth of discharge specification?
No, these are different specifications. An 80% DoD spec, for example a 10–90% SoC window, is a wider operating range than the 20/80 rule’s 60% effective DoD. The two get confused often, since both involve the number 80. But they describe different SoC windows, with different usable capacity implications.
Does charging a BESS to 100% damage the battery?
Generally, no. Occasional full charges are not harmful. In fact, they are often necessary for BMS SoC calibration. The real degradation concern is prolonged dwell time at or near 100% SoC, such as leaving a battery fully charged for extended idle periods. Briefly passing through 100% during normal cycling carries a much smaller risk.
How much usable capacity do I lose by following the 20/80 rule?
Following a strict 20/80 rule cuts usable energy to 60% of nameplate capacity. Compare that with 80% under a 10–90% window, or close to 100% under a 5–95% window. For a 1 MWh nameplate BESS, that is the gap between 600 kWh, 800 kWh, and roughly 950 kWh of usable energy per cycle. This is a real factor in system sizing and project economics.
Conclusion: The 20/80 Rule for Batteries Is a Useful Heuristic, Not a Universal Specification
In summary, the 20/80 rule for batteries captures something real. Lithium-ion cells degrade fastest at the extremes of state of charge. Operating within a narrower SoC window reduces that stress. For NMC and NCA-based systems, including most consumer electronics, EVs, and residential storage, the 20/80 rule remains a sound, evidence-backed default.
For commercial and utility-scale BESS built on LFP chemistry, though, the picture shifts. The same flat voltage curve that makes LFP so well-suited to daily cycling also makes a strict 20/80 window economically inefficient. So, the right approach is to treat the SoC window as a chemistry-specific design variable. Size it against the manufacturer’s cycle-life warranty, the application’s revenue model, and the project’s calendar-life needs, rather than importing a rule of thumb from an entirely different product category.
Need help defining the right SoC operating window, DoD specification, and BMS configuration for your next BESS project? Contact the SunLith Energy engineering team to work through the chemistry-specific trade-offs for your application.
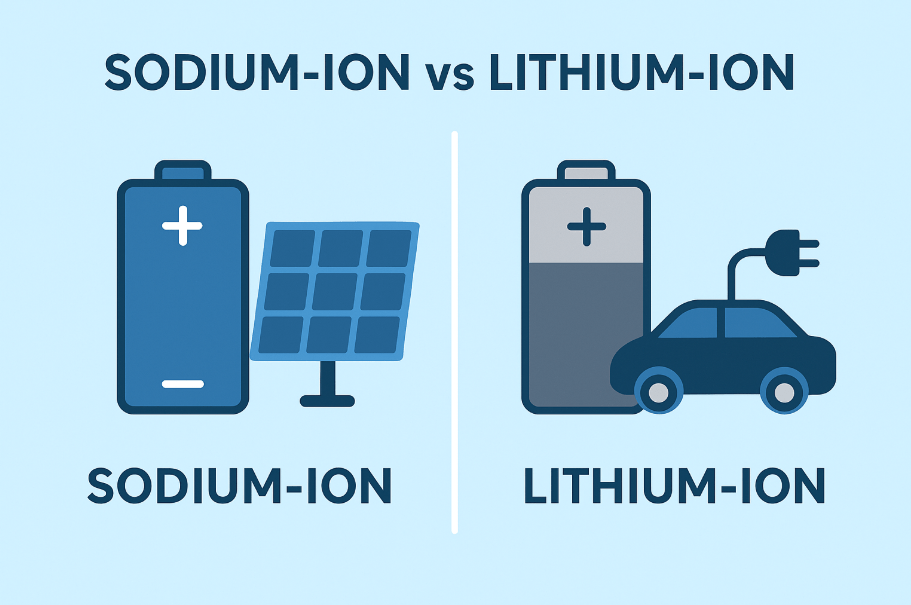
Sodium-Ion vs Lithium-Ion Batteries: As renewable energy adoption accelerates, demand for advanced battery energy storage systems (BESS) is rising. For years, lithium-ion batteries have dominated, powering everything from smartphones to large-scale grid storage. But today, a new contender—sodium-ion batteries—is gaining traction as a safer, cheaper, and more sustainable alternative.
In this post, we’ll explore how sodium-ion and lithium-ion batteries compare in performance, cost, safety, and future potential, and what this means for businesses and energy developers.
What Are Sodium-Ion and Lithium-Ion Batteries?
Lithium-Ion Batteries
Widely used in EVs, electronics, and BESS.
Offer high energy density and long cycle life.
Rely on lithium, a limited and costly resource, concentrated in a few countries.
Sodium-Ion Batteries
Emerging technology using sodium instead of lithium.
Sodium is abundant, low-cost, and evenly distributed worldwide.
Still in early commercialization stages but gaining momentum with companies like CATL and Faradion.
Key takeaway: Lithium-ion leads in maturity and energy density, while sodium-ion offers scalability and sustainability.
Performance Comparison: Energy Density and Efficiency
Lithium-Ion: Higher energy density (150–250 Wh/kg). Ideal for applications where space and weight matter, like EVs.
Sodium-Ion: Lower density (90–160 Wh/kg). Better suited for stationary energy storage where space is less critical.
Efficiency: Both achieve 85–95% round-trip efficiency in BESS applications.
👉 For residential and commercial storage, sodium-ion can deliver reliable performance without the premium cost of lithium.
Cost Advantage: Can Sodium-Ion Beat Lithium Prices?
Lithium-ion costs: Fluctuate due to limited supply of lithium, cobalt, and nickel.
Sodium-ion costs: Lower raw material prices (sodium is 1,000x more abundant than lithium).
Manufacturing: Sodium-ion cells can often use similar production lines as lithium-ion, reducing transition barriers.
Result: Sodium-ion is expected to become a cost-effective solution for large-scale BESS, especially as raw material scarcity drives lithium prices higher.
Safety Considerations
Lithium-Ion Risks: Thermal runaway, overheating, and fire hazards. Requires strict BMS (Battery Management Systems) and certifications.
Sodium: Widely available (seawater, salt deposits), eco-friendly extraction, reduces geopolitical risk.
👉 For businesses aiming to meet ESG and sustainability goals, sodium-ion offers a clear advantage.
Sodium-Ion vs Lithium-Ion Batteries Applications: Where Each Technology Shines
Lithium-Ion Best Fit:
Electric vehicles
Consumer electronics
High-density, mobile applications
Sodium-Ion Best Fit:
Grid-scale renewable energy storage
Residential and commercial BESS
Backup power in regions with strict safety standards
Sodium-Ion vs Lithium-Ion Batteries, Future Outlook: Instead of replacing lithium-ion, sodium-ion will likely complement it—dominating stationary storage while lithium retains the EV market.
Market Outlook for 2026 and Beyond
Major players like CATL, HiNa Battery, and Faradion are scaling sodium-ion production.
The EU Battery Regulation 2026 could accelerate adoption, as companies look for safer, sustainable, and compliant alternatives.
Analysts predict sodium-ion to capture a significant share of stationary BESS markets by 2030, especially in Asia and Europe.
Conclusion: (Sodium-Ion vs Lithium-Ion Batteries) The Future of Energy Storage
Both sodium-ion and lithium-ion batteries will play critical roles in the future of renewable energy and storage systems.
Lithium-ion remains the go-to for EVs and high-density needs.
Sodium-ion is set to become a cost-effective, safer, and more sustainable option for stationary BESS.
For businesses, utilities, and developers, the key is to choose the right battery technology for the right application. At SunLith Energy, we track these innovations to help our clients make informed decisions for reliable and future-proof energy storage.
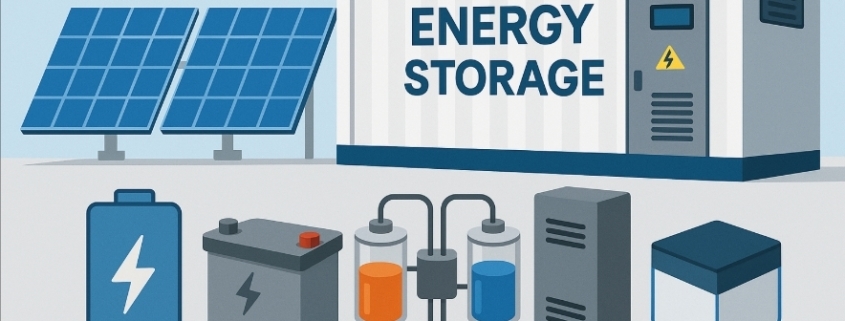
As the demand for reliable renewable energy grows, Battery Energy Storage Systems (BESS) have become an essential part of modern power infrastructure. But did you know that not all batteries are the same? In this post, we’ll break down the top 5 battery technologies used in BESS and help you understand their advantages, limitations, and typical applications.
1. Lithium-Ion Batteries: The Most Popular Choice
Lithium-ion batteries are by far the most common battery technology used in BESS today. Their high energy density, long cycle life, and declining costs make them ideal for everything from residential storage to utility-scale projects.
Pros:
High energy density
Long lifespan (up to 15 years or more)
Good round-trip efficiency (90%+)
Cons:
Sensitive to temperature
Fire risk if not properly managed
Where they fit: Perfect for grid balancing, renewable integration, and behind-the-meter storage.
2. Lead-Acid Batteries: Reliable and Cost-Effective
Although older than other battery technologies, lead-acid batteries are still widely used in BESS for their low upfront cost and proven track record.
Pros:
Low capital cost
Mature and well-understood technology
Easy to recycle
Cons:
Lower energy density
Shorter cycle life (typically 3–5 years)
Heavier and larger footprint
Where they fit: Best for backup power and applications where budget constraints are tight and space is not an issue.
3. Flow Batteries: Flexibility for Long-Duration Storage
Flow batteries (like vanadium redox) store energy in liquid electrolytes that flow through a cell stack. They’re gaining attention for large-scale, long-duration storage projects.
Sodium-sulfur batteries are high-temperature batteries that deliver large amounts of energy for longer durations. Utilities have used them for grid support and load leveling.
Pros:
High energy density
Suitable for large-scale, long-duration storage
Long cycle life
Cons:
Operate at high temperatures (300°C+)
Safety and material challenges
Where they fit: Best for utility-scale BESS applications where space and temperature control are manageable.
Where they fit: Promising for future BESS projects once commercialization and scalability improve.
How to Choose the Right Battery Technology for Your BESS
Choosing the best battery for your energy storage project depends on your goals: ✅ Do you need high energy density? → Lithium-ion or solid-state. ✅ Is low upfront cost key? → Lead-acid might work. ✅ Do you want long-duration storage? → Consider flow or sodium-sulfur batteries. ✅ Looking to future-proof? → Keep an eye on solid-state technology.
Always balance cost, safety, lifespan, efficiency, and your specific use case when selecting battery technologies for BESS.
It depends on the technology: lithium-ion can last 10–15 years, flow batteries up to 20 years, and lead-acid about 3–5 years.
Q4: What’s the safest battery for BESS?
Solid-state batteries promise enhanced safety because they have no flammable liquid, but they’re not yet widely available. Proper BMS (battery management systems) also play a big role in safety.
Q5: Can I mix different battery technologies in one BESS?
Technically, it’s possible but complex. Most projects stick with one type to simplify design, maintenance, and management.
Battery technology has become the beating heart of modern solar energy systems. Whether in residential rooftops, commercial facilities, or grid-scale storage projects, the ability to store energy efficiently defines both performance and cost-effectiveness. One of the most important performance metrics is battery energy density.
Put simply, energy density tells us how much energy a battery can store for its weight or volume.
For solar storage, higher energy density means more power in smaller, lighter systems. This is a total game-changer for homeowners with limited space or businesses looking to maximize efficiency.
In this guide, we’ll break down what energy density means, how different battery chemistries compare, and what the future holds for solar energy storage.
What Is Battery Energy Density?
Energy density measures how much energy a battery can hold in relation to its mass (Wh/kg) or volume (Wh/L). These two forms are known as:
Gravimetric energy density (Wh/kg): Energy per unit of mass.
Volumetric energy density (Wh/L): Energy per unit of volume.
For example:
A lithium-ion battery with 250 Wh/kg can deliver 250 watt-hours of energy for every kilogram of weight.
On the other hand, a higher-density battery, say 400 Wh/kg, could provide nearly double the energy at the same weight.
Therefore, both metrics matter in solar applications. Rooftop solar storage systems often care more about volume, whereas commercial solutions lean on mass efficiency for easier transport.
⚡ Battery Chemistry Density Comparator
Select a battery chemistry to view weight efficiency vs space requirements.
Weight Efficiency (Gravimetric):260 Wh/kg
Space Efficiency (Volumetric):650 Wh/L
*Values represent typical industry averages at the cell assembly level.
Current Energy Densities: Lithium-Ion Leads Today
Lithium-ion (Li-ion) batteries dominate the energy storage market today—and for good reason.
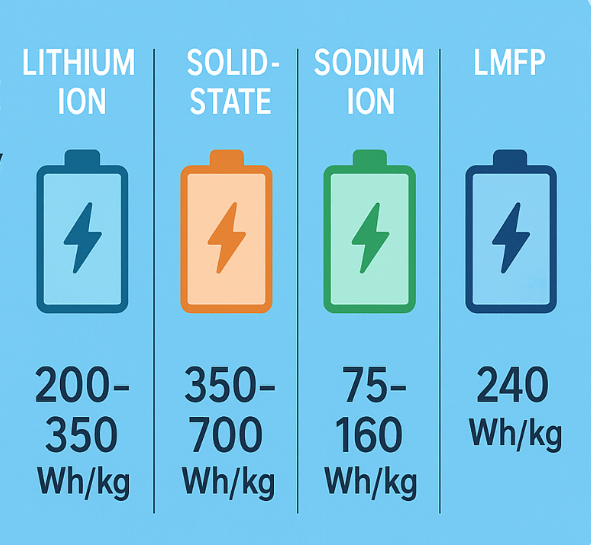
Typical range: 200–300 Wh/kg
High-performance versions: 300–350 Wh/kg
Theoretical limit: 400–500 Wh/kg
These performance values have been improving steadily over time. Thirty years ago, standard Li-ion cells were only around 80 Wh/kg.
Today, premium designs push past 300 Wh/kg. As a result, modern cells deliver more than triple the performance at dramatically lower costs.
For Sunlith Energy customers, this means that a modern lithium-based solar storage system can provide longer backup times, faster charging, and more compact designs compared to older technologies like lead-acid.
Beyond Lithium-Ion: New Chemistries on the Horizon
While lithium-ion dominates today, researchers and manufacturers are racing to improve energy density through new chemistries. Let’s explore some of the most promising options.
Challenges: Manufacturing complexity, high costs, scaling up.
Solid-state batteries are already moving from lab to pilot production, with companies like Toyota and Ion Storage Systems leading development. For solar storage, their promise lies in more compact, safer, and longer-lasting home and commercial systems.
Low-Cost Sodium-Ion Battery Energy Density
Energy Density: 75–160 Wh/kg
Advantages: Abundant raw materials, lower cost, better cold-weather performance.
Challenges: Lower density compared to lithium-ion.
Although sodium-ion cannot compete with lithium-ion in density, they shine in affordable large-scale storage and cold climates, making them ideal for certain solar projects.
Lithium Manganese Iron Phosphate (LMFP)
Energy Density: ~240 Wh/kg at cell level
Advantages: Safer and more affordable than high-density lithium chemistries.
Use Case: Perfect balance of cost, safety, and density for residential solar storage.
Semi-Solid and Sodium-Air Prototypes
Semi-solid: ~270 Wh/kg today; safer, more stable for EVs and solar systems.
Sodium-air: Theoretical >1,000 Wh/kg; still experimental, but could one day power long-duration off-grid solar or even electric aircraft.
Why Battery Energy Density Isn’t Everything
It might sound like higher energy density always equals better—but in real-world solar applications, balance matters. Consequently, we must evaluate several key trade-offs:
Safety: High-density chemistries often face overheating risks. For this reason, thermal stability may outweigh raw density in residential spaces.
Cost: A 700 Wh/kg solid-state battery may be incredible, but if it costs 10× more than today’s lithium-ion, then it won’t make sense for most solar projects.
Cycle Life: Batteries with slightly lower density but longer lifespan (like LFP or LMFP) can be more cost-effective in the long run.
Temperature Performance: Sodium-ion’s resilience in cold climates may be more valuable than high density for certain markets.
For Sunlith Energy, the real value lies in matching the right battery chemistry to each customer’s needs—whether residential, commercial, or utility-scale.
The Evolution of Battery Economics
The story of battery energy density is also a story of economics. Over the past 30 years, we have seen a massive transformation in energy storage markets.
Energy density has increased fivefold. This allows modern systems to offer significantly higher capacities without increasing physical footprints.
Battery costs have dropped by over 90%. Lower manufacturing costs make high-capacity setups commercially viable for mainstream consumers.
Global deployment has surged. Renewable storage integration is expanding exponentially across residential and utility grids.
This cost-density curve has transformed solar from a niche technology into a mainstream energy solution. Homeowners now enjoy affordable batteries that keep lights on during outages, while businesses leverage solar storage to cut peak demand costs.
What the Future Holds for Solar + Storage
Looking ahead, battery energy density will continue to shape solar energy adoption:
Compact, High-Power Home Systems – Future households may install sleek, wall-mounted systems delivering twice today’s storage in half the space.
Affordable Community Storage – Sodium-ion and LMFP could bring down costs, enabling microgrids and rural electrification.
Grid Flexibility – Higher density batteries will support longer-duration storage, balancing renewables at utility scale.
Sustainability First – Future solutions won’t just chase density; they’ll balance safety, recycling, and ethical sourcing.
For Sunlith Energy, this means staying at the forefront of new chemistries, while continuing to deliver reliable, efficient, and customer-focused solar storage solutions today.
Conclusion: Choosing the Right Battery for Your Solar Future
Battery energy density is a critical factor in designing solar + storage systems—but it’s not the only one. The best solution balances density with safety, cost, cycle life, and environmental fit.
At Sunlith Energy, we believe the future of solar storage lies in smart integration: pairing the right chemistry with each unique project. Whether it’s a compact lithium-ion battery for a city apartment, a cost-efficient sodium-ion solution for cold climates, or next-generation solid-state storage for commercial clients, our mission is to deliver power that works for your future.