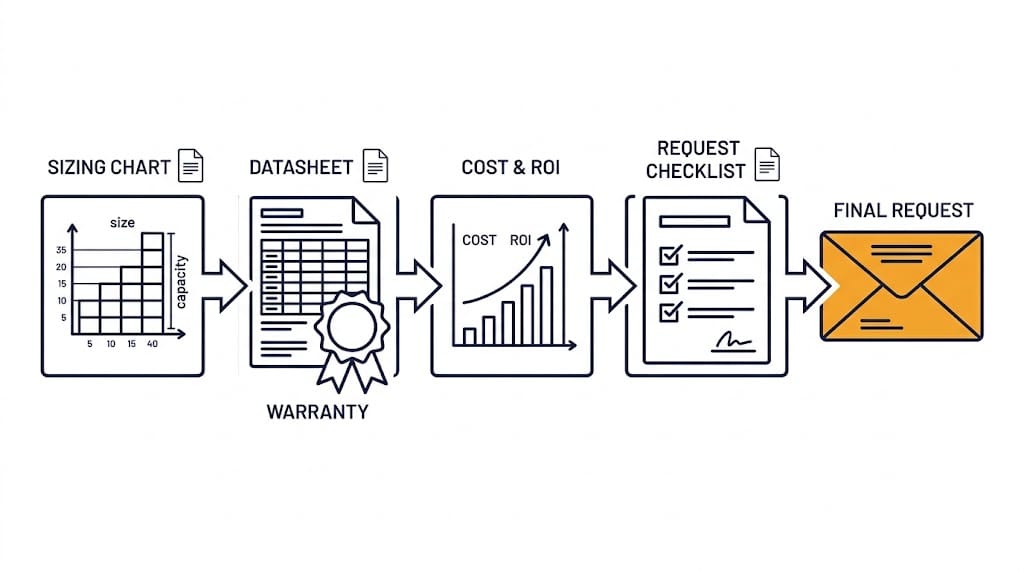
A C&I BESS quote is only as useful as the information behind it. In fact, a one-line request rarely supports reliable sizing or a comparable installed-price estimate.
Send your load data, tariff details, site facts, and main goal up front. Then every bidder answers the same question.
This guide covers the data, documents, and questions to prepare. Finally, it offers a request email you can copy and send.
Quick Answer: To request a C&I BESS quote, state your application, site location, target operating date, and available electrical and space details. Next, add interval load data and the tariff for savings-based projects, or critical loads and backup duration for resilience. Finally, share a single-line diagram if you have one.
Why a Generic C&I BESS Quote Is Not Enough
Asking what a 1 MWh system costs does not produce a project-ready C&I BESS quote. That is because installed cost depends on far more than battery size.
Energy duration and power rating
The application the battery must serve
Interconnection and controls
Site civil work and safety systems
Commissioning and warranty requirements
Each item changes the price. So a bare price request tells a supplier very little.
Quote preparation brings together the application, preliminary sizing, specifications, warranty requirements, and economic assumptions. However, you can refine these inputs with the supplier as the project develops.
Start Your C&I BESS Quote With the Application
Every C&I BESS quote starts with the job the battery must do. Because each job needs different data, the table below separates them.
If you have more than one goal, rank them. Otherwise, a system tuned for one job may perform poorly at another.
Prepare the Data Behind Your C&I BESS Quote
Three groups of information shape every C&I BESS quote request. Since each group answers a different supplier question, gather all three.
Energy and Tariff Information
For peak shaving and tariff-based savings analysis, aim for at least 12 consecutive months of interval data where available.
Use the utility’s demand-measurement interval, or finer data that can be aggregated to it. Also state the timestamps, time zone, units, and whether each reading is average kW or interval kWh.
Current utility bills
The full tariff or rate schedule
Demand charges, time-of-use windows, ratchets, and export compensation rules
Existing and planned solar generation data
Electrical and Site Information
Facility location and utility
Main-service voltage, transformer rating, and available capacity
Single-line diagram, where available
Existing switchgear, protection equipment, generator, and solar-inverter details
Proposed point of interconnection
Site plan, access route, usable footprint, setbacks, and fire-access constraints
Operational and Commercial Information
Main BESS use case and priority order
Target kW reduction, backup duration, or EV-charging demand
Typical operating schedule and seasonal changes
Expansion plans
Desired commercial-operation date
Budget range, procurement route, and financing preference, if you are willing to share them
Missing a document? Send what you have. Then the supplier can list the gaps and request the rest later.
What Suppliers Should Include in Their Reply
A budgetary estimate may give an indicative configuration, price range, scope, and assumptions without detailed engineering. In contrast, a developed proposal should add a more defined layout, electrical interface, commissioning scope, and itemized exclusions.
State which stage you are requesting. Also ask suppliers to flag anything that still depends on site investigation or engineering.
A strong C&I BESS quote does more than state a price. Next, ask each bidder to cover these items.
Proposed AC power rating, usable energy, and nominal energy
Stated duration at rated power
Assumed measurement boundary for capacity and efficiency
Scope of PCS, battery, BMS, EMS, HVAC, fire-safety, enclosure, and balance-of-system equipment
Interconnection and site-work assumptions
Conceptual layout and electrical-interface information, where available; more detailed drawings at the developed-proposal stage
Performance assumptions and dispatch limitations
Warranty scope, capacity retention, throughput limit, exclusions, and remedies
CAPEX breakdown, exclusions, O&M scope, and optional services
Schedule, commissioning plan, and commercial assumptions
Quote validity, currency, delivery basis, taxes or duties, payment milestones, and major price-adjustment conditions
Because unclear terms make bids hard to compare, read SunLith’s guide to understanding BESS specifications. It explains how vendors define capacity, power, and efficiency.
Also ask how the supplier plans for capacity loss over time. Our guide to BESS augmentation planning covers that topic.
Questions to Compare Across Every C&I BESS Quote
Use these questions to put every C&I BESS quote on the same footing. Ask for written answers as well, and have important assumptions, inclusions, and exclusions written into the proposal.
Capacity and Performance Questions
Is the energy rating nominal, usable DC, AC delivered, or measured at the point of interconnection?
What duration does the system provide at rated power?
Does the proposal assume one application or stacked value streams?
How are HVAC and auxiliary loads counted in efficiency and available-energy assumptions?
Scope and Ownership Questions
Which site upgrades, civil works, interconnection studies, permits, or fire-protection measures are excluded?
Who owns the EMS controls, performance monitoring, and data access?
What do commissioning, acceptance testing, training, remote monitoring, and maintenance include?
Warranty and Lifecycle Questions
Which warranty limits apply to DoD, throughput, C-rate, SOC, temperature, and dispatch?
What annual O&M and replacement costs are assumed?
What must happen for capacity augmentation, and who pays for it?
Because C-rate limits often sit inside warranty terms, see BESS C-rate explained for how those limits work.
Common Mistakes When Requesting a Quote
These errors often weaken a C&I BESS quote request. If you avoid them, your bids will be easier to compare.
Requesting price without an application: As a result, the supplier must make assumptions about the required kW, kWh, and controls.
Sharing one monthly utility bill: Because it hides peak shape, duration, and seasonal change, sizing stays uncertain.
Comparing nominal kWh with usable AC energy: Since the two numbers measure different things, the bids will not match.
Ignoring tariff and demand-charge rules: When you miss them, the value of every kW you cut is unclear.
Assuming extras are included: Unless stated, PCS, HVAC, fire protection, controls, and civil work may sit outside the price.
Comparing warranty years alone: Instead, check throughput and operating limits as well as the term.
Asking for a system sized for savings: Without sufficient load, tariff, and site information, savings-based sizing remains speculative.
Copy-and-Paste RFQ Email Template
Use this template to start your C&I BESS quote request. Replace each bracketed item with your own details before sending.
Subject: Request for preliminary C&I BESS assessment and budgetary quote
We are evaluating a battery energy storage system for [facility type] at [location]. Our primary objective is [peak shaving / backup / solar self-consumption / EV charging / other].
Attached are [interval load data / utility bills / tariff / single-line diagram / site plan].
Please provide a preliminary recommendation. Include proposed AC power, usable energy, expected duration, and key assumptions.
Also include required site or interconnection work, budgetary CAPEX, warranty summary, delivery schedule, and information needed for a detailed proposal.
Our target decision date is [date], and our target commercial-operation date is [date].
Send it to more than one supplier. Also use the same attachments each time.
Frequently Asked Questions About a C&I BESS Quote
When buyers prepare a C&I BESS quote request, the same questions come up often.
What data do I need for a C&I BESS quote?
Start with your application, site location, available electrical information, and target operating date. For peak shaving or tariff-based savings, include interval load data and the utility tariff.
For backup, provide critical-load requirements and the required backup duration. In addition, a single-line diagram and site plan help refine the proposal where available.
Can I get a C&I BESS quote with only one utility bill?
You may receive a budgetary estimate, but its sizing and savings assumptions will be limited. That is because one bill hides peak shape and seasonal change. Instead, interval data gives a far better basis.
Why do C&I BESS quotes differ so much?
Bids often use different definitions and scope. For example, one may quote nominal energy and another usable AC energy. Therefore, ask every bidder to state its assumptions.
Do I need a single-line diagram before I ask?
It helps, but it is not always required. If you lack one, send equipment nameplate details and photos of the main switchgear. As a result, the supplier can request more later.
Is a preliminary assessment the same as a final proposal?
No. A preliminary assessment gives budgetary figures and stated assumptions. However, a detailed proposal needs site-specific electrical, tariff, interconnection, and safety review.
Ready to Request a Preliminary Assessment?
Contact SunLith for a C&I BESS quote with your project objective, site location, and available load, tariff, and electrical information. If documents are missing, explain what you have so we can identify the next steps.
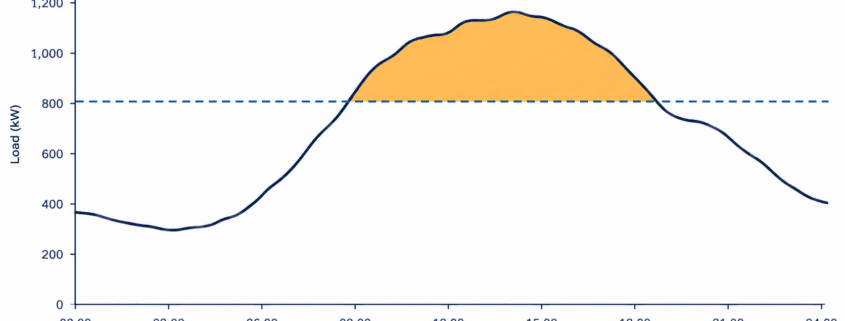
Peak shaving battery sizing starts with two questions. How much power must the battery discharge? For how long? First, choose the maximum grid demand you want your facility to draw. Then analyze your interval load data. The highest load above that target sets the discharge power, in kW. The area above the target sets the delivered energy, in kWh.
Quick Answer
Peak-shaving battery sizing starts by subtracting the selected grid-demand target from site load in each interval. The highest result is the preliminary battery discharge-power requirement in kW. Add the interval discharge energy to estimate delivered kWh, then adjust for defined discharge efficiency and permitted usable capacity.
Those two numbers are only a starting point, though. A workable design must also account for discharge losses and the battery’s allowed operating range. It also needs to handle repeated peaks, charging opportunities, and how your utility calculates billed demand. Peak shaving means discharging a battery to cut peak grid demand. That is different from shifting energy use to another time, or sizing a battery for outage backup.
The Peak Shaving Battery Sizing Formulas at a Glance
Peak shaving battery sizing follows four simple steps for each interval in your load data. Confirm the measurement boundary, such as battery DC terminals, PCS AC output, or site meter, before applying efficiency assumptions.
New to these units? SunLith’s Ah vs Wh battery capacity guide covers the Wh = Ah × voltage relationship behind every kWh figure below.
Key Sizing Formulas
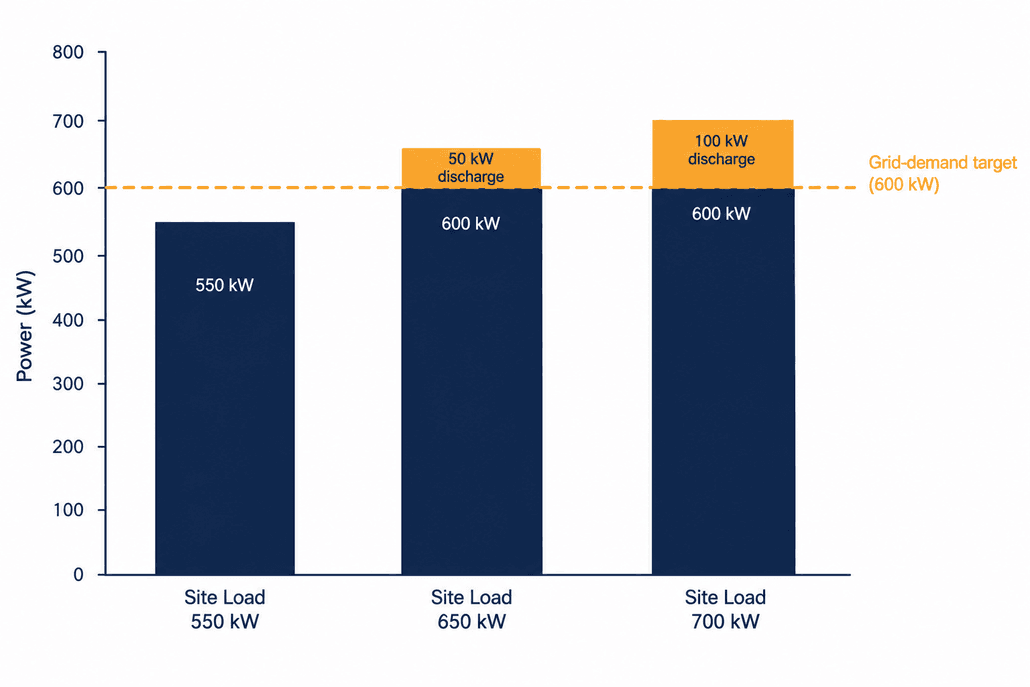
First, find the battery discharge required, in kW. Take site load, subtract the grid-demand target, and floor the result at zero. A 700 kW load against a 600 kW target needs 100 kW of discharge. A 550 kW load against the same target needs none.
Pbattery,i = max(0, Li − T)
Next, find the largest required discharge across every interval. That becomes your preliminary AC discharge-power requirement.
Prequired = maxi(Pbattery,i)
Then find the delivered energy, in kWh. Add up, across every interval in one peak event, the discharge required multiplied by the interval length in hours.
Edelivered = Σi(Pbattery,i × Δti)
Finally, estimate nominal battery capacity. Divide delivered energy by discharge efficiency, then by the usable fraction of nominal capacity. Discharge efficiency is the assumed efficiency from the battery’s energy boundary to the AC delivery point. The usable fraction is the share of nominal capacity available for this duty. Define both terms before you apply the formula, since this is only an event-level estimate. It is not a substitute for simulating state of charge over time.
Enominal = Edelivered ÷
(ηdischarge × fusable)
Where: Pbattery,i is the required battery discharge during interval i;
Li is site load; T is the selected grid-demand target;
Δti is interval duration in hours;
ηdischarge is defined one-way discharge-path efficiency; and
fusable is the permitted usable share of nominal capacity.
Step 1: Gather Load Data and the Tariff
First, ask your utility or metering provider for interval demand data covering representative operations and seasons. You need to see the shape of each peak, not just the highest number on a bill. A 100 kW exceedance lasting 15 minutes requires far less delivered energy than the same exceedance lasting three hours.
Also collect the tariff alongside the data. Identify the demand-measurement interval. Check which periods carry demand charges. Look for other billing provisions that affect the value of reducing a peak. The target should be based on how demand is measured and billed under the applicable tariff, not a generic assumption about demand charges.
One MDPI-published study of low-voltage commercial users evaluated battery energy capacity against measured customer-load data and the resulting peak reduction over time. The principle for a single facility is the same: use interval data rather than a monthly peak alone.
If the site has solar, use net demand at the relevant meter. Also model how solar output varies during likely peak events. A sunny-day profile alone may understate the battery needed on a cloudy day.
Step 2: Choose a Grid-Demand Target
Suppose a facility’s load sometimes reaches 700 kW. You could test targets of 650 kW, 600 kW, and 550 kW. Generally, a lower target asks the battery to provide more power, more energy, or both. However, whether that extra capacity pays off depends on the tariff and the full pattern of peaks.
Do not pick the target from the single highest reading alone. A battery might shave the largest peak successfully. Then it may exhaust its usable energy during a longer, lower peak later that day.
Step 3: Calculate Required Battery Power
For each interval, subtract the target from site load. If the result is negative, set the discharge requirement to zero. The table below shows this for a 600 kW target.
Example: discharge needed to hold a 600 kW target
Site load
Discharge needed to hold 600 kW
550 kW
0 kW
650 kW
50 kW
700 kW
100 kW
The preliminary requirement here is 100 kW of AC discharge power, measured at the point where the battery offsets meter demand. An engineer must then confirm that the chosen power conversion system and installation can sustain that output under real operating conditions.
Step 4: Calculate the Delivered Energy for Each Peak
Power tells you how fast the battery must discharge, while energy tells you how much it must deliver over the whole event.
For preliminary analysis, define a peak event as consecutive metering intervals where site demand stays above the selected grid-demand target. If demand drops below the target and the battery can begin recharging, treat the next exceedance as a separate event. Verify that the available recharge time and charging-power limit are sufficient.
Assume the facility stays at 700 kW for one hour. Then it drops to 650 kW for two hours, still against a 600 kW target. That gives 100 kW for one hour, plus 50 kW for two hours. The total is 200 kWh delivered.
So this event requires 100 kW of maximum discharge and 200 kWh of delivered AC energy. A battery rated for 100 kW but able to deliver only 100 kWh would not cover the whole event at this target.
Repeat this calculation for other days and seasons. The event with the highest instantaneous discharge sets one constraint. The event with the greatest delivered energy may set the energy-capacity requirement.
Step 5: Estimate Nominal Battery Capacity
The battery must store more energy than it ultimately delivers. Discharge is not lossless, and the full nominal capacity may not be available for the chosen operating strategy.
For illustration, assume 200 kWh of required delivered energy. Assume a 90% one-way discharge-path efficiency and an 80% permitted usable fraction of nominal capacity. Divide 200 by 0.90, then by 0.80. That gives roughly 278 kWh of nominal capacity.
That figure is only an initial estimate, not a recommended product size. First, check the vendor’s capacity definition. Then account for state-of-charge limits, expected end-of-life capacity, temperature effects, auxiliary consumption, warranty commitments, and the manufacturer’s defined AC or DC capacity boundary before choosing a product.
Accounting for Discharge Losses vs. Round-Trip Efficiency
Do not treat round-trip efficiency as one-way discharge efficiency. Round-trip efficiency includes losses across both charging and discharging. Applying it as a discharge factor, then adding separate discharge losses on top, counts losses twice. A preliminary sizing tool may use round-trip efficiency as a simplified assumption. Final peak shaving battery sizing should still call out discharge-path losses on their own.
SunLith’s guide to understanding BESS specifications explains how vendors actually define usable capacity and efficiency, both needed for this step.
Step 6: Test Repeated Peaks and Recharging
The example above assumes the battery has enough charge when the event begins. Real facilities may see several peaks a day, peaks on consecutive days, or an unusually long stretch above the target. Charging too aggressively can itself create a new metered peak.
Run the load profile forward, interval by interval, using these five steps.
Begin with an assumed battery state of charge.
Discharge whenever load would otherwise exceed the chosen target.
Track remaining energy and all applicable losses.
Allow charging only when it fits the tariff, site load, and equipment limits.
Check whether the battery is ready for the next event.
This simulation may reveal that a seemingly adequate 100 kW / 278 kWh preliminary configuration needs more capacity. Or it may show that a different demand target produces a better project. Model peak-shaving dispatch and resulting bill impacts together this way, instead of inferring them from a single peak value.
Sample Interval-Data Worksheet Columns
A simple spreadsheet makes this simulation easier to run and easier to hand to an engineer. Track these six columns for every interval in the load dataset.
Column
What it records
Timestamp
Date and interval start time
Site load (kW)
Measured or forecast demand for the interval
Target (kW)
The grid-demand target being tested
Discharge required (kW)
Site load minus target, floored at zero
Delivered energy (kWh)
Discharge required times interval hours
Simulated state of charge (%)
Running battery charge after each interval
Step 7: Check Whether the Battery Size Makes Financial Sense
A technically workable target is not always the most economical one, though. Compare several combinations of battery power, energy, and target demand against the real tariff and a no-storage baseline. Include the cost of charging, equipment and installation, operating costs, and expected capacity changes over the project life.
SunLith’s peak shaving vs load shifting guide explains the two strategies and where they overlap. Use it to understand the value stream, not as an interval-based sizing tool.
For the financial modeling itself, SunLith’s guide to calculating BESS ROI walks through the cash-flow side. Use it once the power and energy numbers from this sizing exercise are in hand.
Common Peak Shaving Battery Sizing Mistakes
Because these errors repeat across projects, they turn a sound peak shaving battery sizing exercise into an undersized or overpriced one.
Using only the monthly peak: It does not show how long or how often demand exceeds your target.
Confusing kW with kWh: The maximum exceedance sets discharge power. Duration and shape set delivered energy.
Sizing from one favorable day: Solar production, weather, occupancy, and operations can all change the peak profile.
Ignoring the next event: The battery may suit one peak but fail to recharge before another.
Assuming every kWh of nameplate capacity is usable: Operating limits and performance requirements must be checked against the proposed product.
Treating demand-charge savings as guaranteed: Actual savings depend on successful dispatch and the applicable tariff.
Frequently Asked Questions About Peak Shaving Battery Sizing
These questions come up often once a facility starts peak shaving battery sizing from its own interval data.
Can I size a peak shaving battery from a utility bill?
A bill shows billed demand and charges, but it usually will not show the full duration and shape of the peaks. First, use interval data for a credible power-and-energy estimate. Then apply the tariff to evaluate savings.
Is a 100 kW battery enough to reduce my peak by 100 kW?
Not necessarily. First, it must deliver that power at the relevant point in the electrical system. Also, it needs enough energy and state of charge for the whole event. Finally, it must stay available for other peaks that affect the bill.
How many hours of battery storage do I need for peak shaving?
There is no universal duration. First, calculate the energy above your chosen demand target across actual events. Then test whether the proposed power and energy ratings can meet those events repeatedly.
Is peak shaving battery sizing the same as backup sizing?
No. Peak shaving battery sizing follows measured site demand above a grid-import target. Backup sizing starts instead with the critical loads that must run during an outage, and the required backup duration. It is a different starting point and a different formula set. For preliminary outage-backup estimates, use SunLith’s C&I BESS sizing calculator. It uses critical-load and backup-duration inputs, so it should not be used to size a peak-shaving system.
This article gives a preliminary sizing method, not an equipment specification or a savings guarantee. Final selection still needs interval-data and tariff analysis, electrical design, and product-specific validation.
Need a Peak-Shaving BESS Assessment?
A preliminary battery size should be tested against your actual interval demand data, tariff rules, charging windows, and operating priorities. Send SunLith your site load profile and utility tariff for an initial C&I BESS assessment.
Quick Answer AI data centers strain power grids in two ways. First, they need massive amounts of power. Second, that power swings wildly, second to second. In practice, training a large GPU cluster can shift facility power by tens or hundreds of megawatts within milliseconds. AI data center BESS, battery storage deployed on-site, solves both problems. It absorbs these swings, bridges long grid connection delays, and cuts peak demand charges. As a result, it often costs far less than building new on-site generation.
1. The Power Problem Driving AI Data Center BESS
AI data center BESS has moved from a niche add-on to a core design requirement. Specifically, global data center electricity demand is set to top 1,000 TWh in 2026. That is roughly double the 2023 level. In the United States, data center power demand should climb by 400 TWh by 2030. That works out to about 23% growth each year. In fact, AI workloads alone could drive 30% to 40% of that new demand.
This growth has outpaced what utilities can build. Hyperscalers now sign gigawatt-scale power deals faster than new transmission lines can go up. As a result, a widening gap has formed. AI facilities need power on day one, but the grid often cannot deliver it on schedule. That is why AI data center BESS increasingly closes the gap, both on-site and in front of the meter.
2. Why Volatility Matters More Than Total Power
#image_title
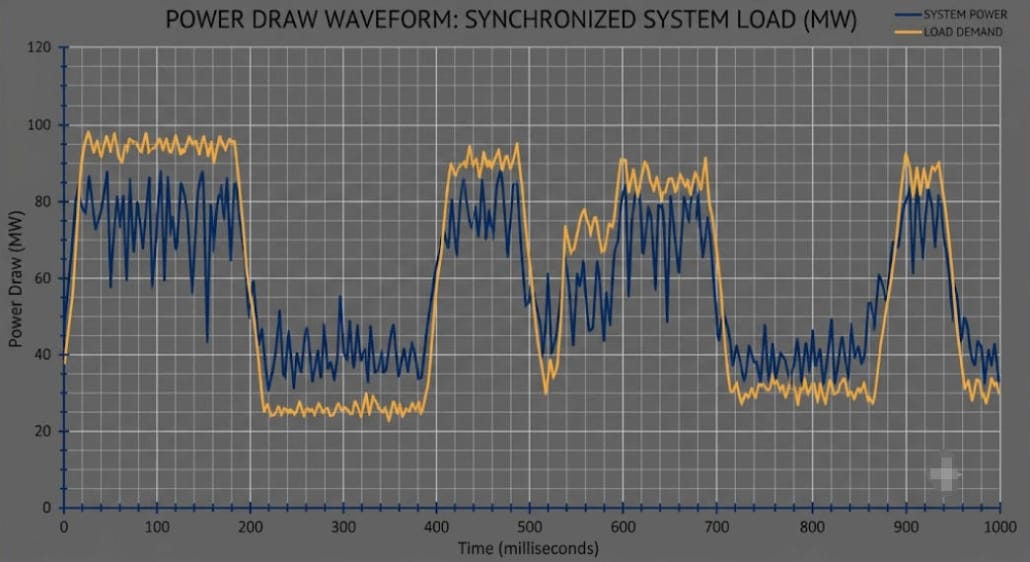
Consequently, most conversations about AI data centers focus on total megawatts. However, the harder problem is how unevenly that power arrives. For example, a traditional data center runs thousands of small, unrelated tasks. Therefore, those tasks average out into a fairly flat load. In contrast, an AI training cluster works quite differently. Specifically, tens of thousands of GPUs execute in lockstep. As a result, they synchronize computation and communication in cycles that last just milliseconds.
A large training job often pauses for a checkpoint or a data-sync step. When it does, GPU power can fall from full load to near idle in a split second. Then it snaps back just as fast. At scale, these swings can move tens or even hundreds of megawatts almost instantly. For example, Meta’s own engineers have described this exact problem on a 24,000-GPU cluster pulling roughly 30 MW. Notably, they say the problem only grows as clusters get bigger.
According to Uptime Institute, these swings can push AI compute clusters to about 150% of their normal power draw. That strains transformers, UPS units, and protection gear never built for this kind of stress. Left unmanaged, the swings can trip upstream protection or shake grid equipment through resonance. In response, fast-responding battery storage can absorb or release power within milliseconds. So, AI data center BESS is one of the few tools that can smooth these swings before they reach the utility line.
3. Interconnection Queues Are the Real Bottleneck
Even a fully funded data center still has to wait in line to connect to the grid. As of late 2025, about 2,600 GW of generation and storage capacity sat in U.S. interconnection queues. Today, the median project takes close to five years to reach commercial operation. Some PJM-area projects have waited more than eight. Meanwhile, ERCOT alone had 143.5 GW of data center load seeking connection as of October 2025. That is well above the grid operator’s all-time peak demand of 85.9 GW.
In short, only a small share of queued capacity ever gets built. In fact, Lawrence Berkeley National Laboratory found that just 13% of capacity that applied for interconnection between 2000 and 2019 had reached commercial operation by the end of 2024. For a developer who needs power within 18 to 24 months, a five-to-eight-year queue is not a delay. It is a dealbreaker. Because of this, an estimated 50 GW of behind-the-meter data center power capacity was announced in 2025 alone. Most of it pairs on-site generation with co-located battery storage. This is exactly the gap AI data center BESS is built to bridge, until the grid connection is ready.
4. Where AI Data Center BESS Fits: Four Key Roles
AI data center BESS is not a single application. Instead, it covers four distinct jobs. Often, all four stack on the same battery asset.
Sub-Second Power Smoothing
Specifically, rack-level and facility-level battery banks can absorb a sudden GPU load drop. Then they discharge just as fast when demand snaps back. This turns a millisecond-scale spike into a gradual ramp. As a result, grid equipment and on-site generators can actually keep up. Chipmakers now pair this storage with power capping and staged ramp-up controls. Together, these keep facility-wide swings within a range utilities can tolerate.
Bridge Power for AI Data Center BESS
A co-located BESS can start covering peak loads the day a facility opens. This happens long before a full grid connection is approved. So, it buys time for transmission upgrades to catch up. The project does not have to sit idle for years waiting on first power.
Peak Shaving and Demand Charge Management
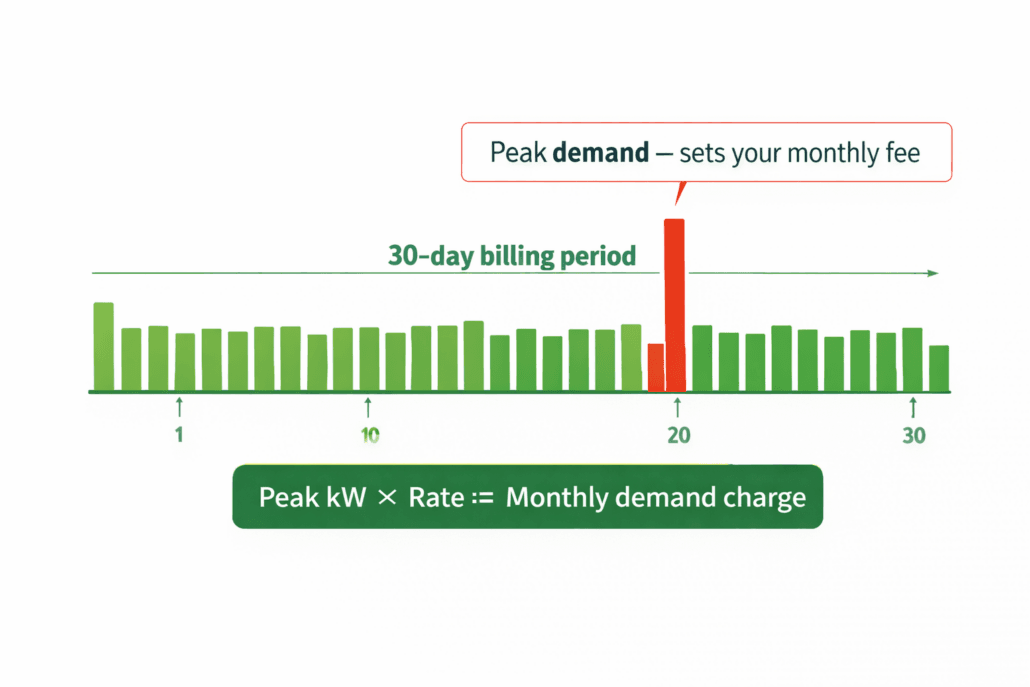
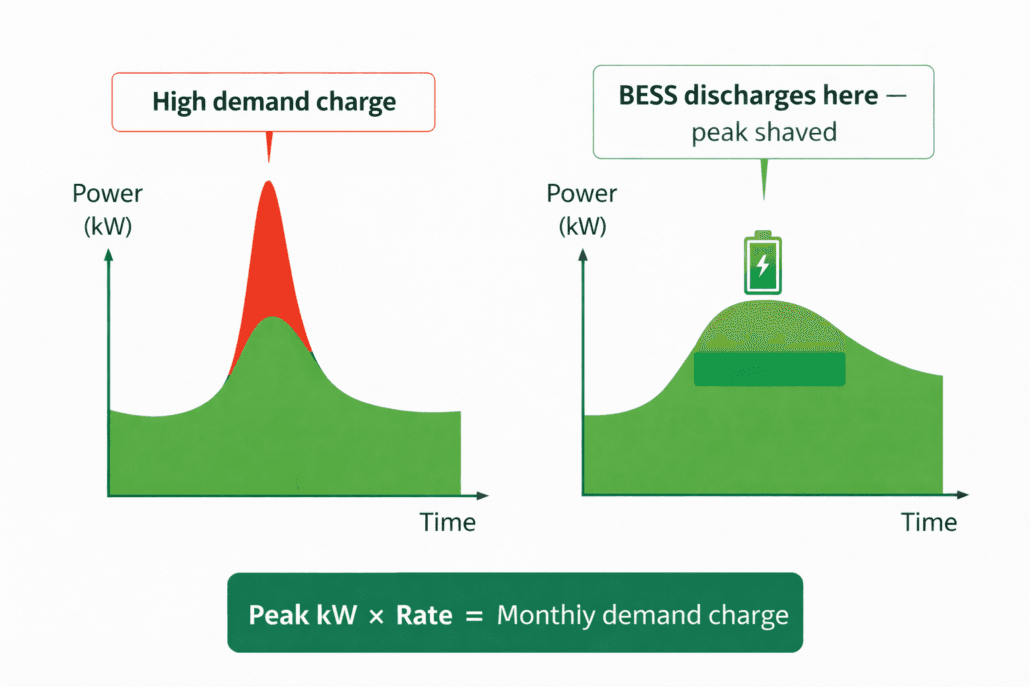
Typically, utilities bill large loads heavily for their single highest demand spike each month. By charging the battery during cheap, low-demand hours and discharging during peak windows, a facility can shave that spike. This can meaningfully cut a facility’s monthly bill. For more detail, see Sunlith’s guide to peak shaving and demand charge reduction.
Grid Services and Energy Arbitrage
Additionally, a stand-alone BESS in front of the meter can also earn revenue on its own. It charges when wholesale prices are low. Then it discharges, or provides frequency regulation, when prices spike. In turn, this transforms backup infrastructure into a second income stream, not just a cost center.
5. BESS vs. Alternative Power Strategies for AI Facilities
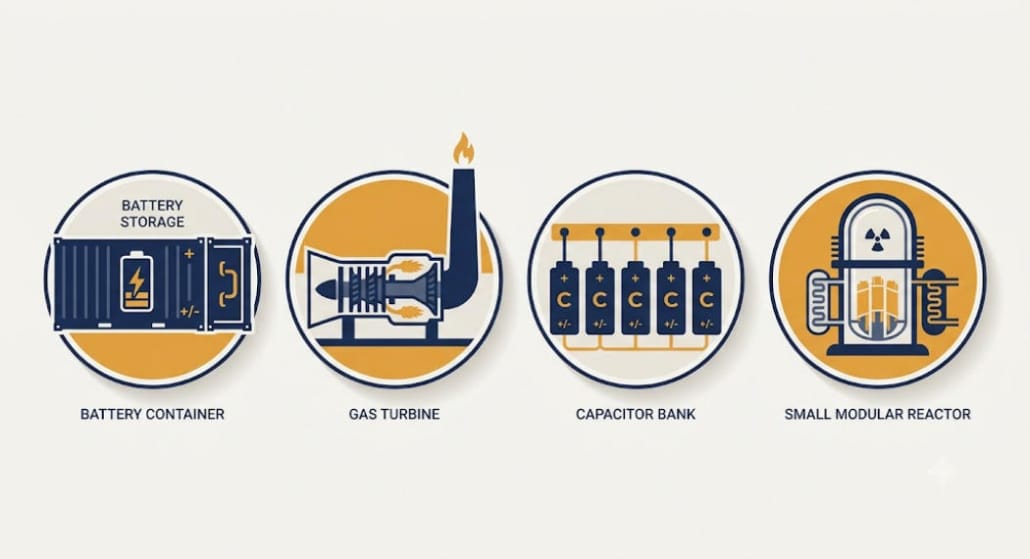
Data center developers rarely choose one power strategy alone. Instead, the table below compares how AI data center BESS stacks up against other tools developers are using in 2026.
Strategy
Response Time
Deployment Timeline
Best For
BESS
Milliseconds to seconds
6–18 months
Power smoothing, peak shaving, bridge power
On-site gas generation
Seconds to minutes
12–24 months
Sustained bridge power at large scale
Grid-forming UPS / capacitor banks
Microseconds
Built into facility design
Ride-through for the shortest transients
Small modular reactors (SMRs)
Not applicable (baseload)
5+ years
Long-term, always-on capacity
6. Sizing AI Data Center BESS: What to Consider
Not every BESS deployment looks the same. Sizing one for an AI data center starts from a different set of questions than a typical grid-scale project.
Response Time and C-Rate
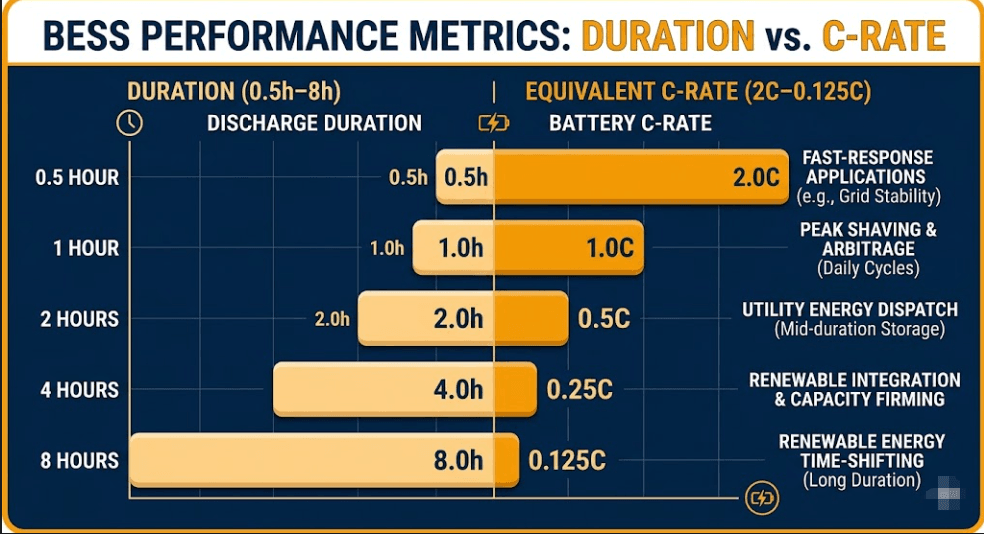
Smoothing millisecond-scale GPU swings needs a battery and inverter rated for very fast response. This matters more than raw capacity. It is a different design target than a system built purely for hours-long peak shaving.
Duration: Burst Smoothing vs. Bridge Power
A system built to absorb short, sharp swings needs little energy capacity but very high power. By contrast, a system meant to bridge months or years of interconnection delay needs the opposite. It needs sustained duration to cover real load, not just brief spikes.
AI Data Center BESS Placement: Rack vs. Facility
Some operators deploy smaller battery banks close to the rack to catch the fastest transients. They pair these with a larger facility-scale BESS for peak shaving and bridge power. The two serve different timescales. So, they are rarely substitutes for each other.
Battery Chemistry for AI Data Center BESS
AI data center duty cycles involve frequent, partial charge-discharge events, not one clean cycle a day. Lithium iron phosphate, or LFP, tends to hold up well under that kind of irregular cycling. It also offers strong thermal stability. That matters for compliance with codes covered in Sunlith’s NFPA 855 guide for large-format stationary storage.
Key Takeaways on AI Data Center BESS
Point
Why It Matters
AI data centers strain the grid two ways
Total demand is high, but the bigger design problem is millisecond-scale power swings during GPU training
Interconnection queues now stretch 5–8 years
AI data center BESS and other behind-the-meter resources bridge the gap until full grid connection
BESS covers four distinct jobs
Power smoothing, bridge power, peak shaving, and grid services can stack on one battery asset
Sizing depends on the job
Smoothing needs fast response and modest duration; bridge power needs sustained duration and real capacity
LFP suits AI data center duty cycles
Frequent partial cycling and thermal stability requirements favor LFP over other lithium chemistries
Frequently Asked Questions About AI Data Center BESS
What Is AI Data Center BESS?
BESS stands for battery energy storage system. AI data center BESS refers to on-site or co-located batteries. These batteries smooth GPU power swings, bridge grid connection delays, and manage peak demand charges.
How Much Power Do AI Data Centers Actually Use?
Individual GPU racks now draw 50 to 100 kW. That is up from just 5 to 10 kW for older server racks. At the facility level, large training clusters can pull tens to hundreds of megawatts. Notably, swings of similar size can occur within milliseconds.
Can Batteries Really Respond Fast Enough for GPU Power Swings?
Yes, when purpose-built for it. Battery and inverter combinations designed for fast response can absorb and release power within milliseconds. That is exactly the timescale GPU training swings operate on.
How Long Does BESS Deployment Take?
A dedicated BESS deployment typically takes 6 to 18 months, from order to commissioning. That is far faster than the five-plus-year interconnection queues many large loads now face.
Is BESS a Permanent Fix or a Bridge to Something Else?
It can be both, depending on the role. For instance, peak-shaving and power-smoothing functions are usually permanent.
The BESS PCS — Power Conversion System — converts DC battery power to AC for loads or the grid. However, what a PCS must do beyond that basic job changes completely depending on the application. Consequently, choosing the wrong PCS type is one of the most expensive mistakes a project team can make.
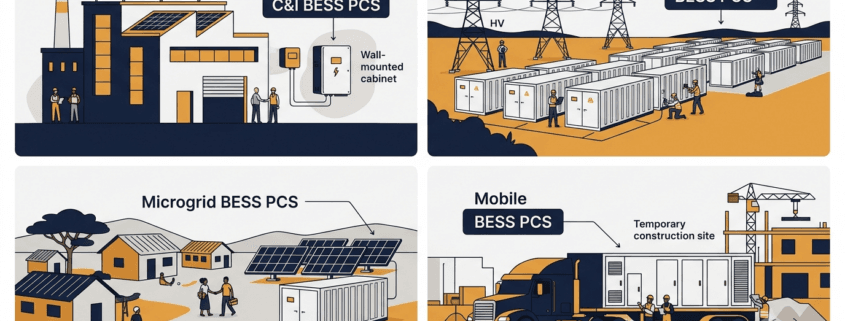
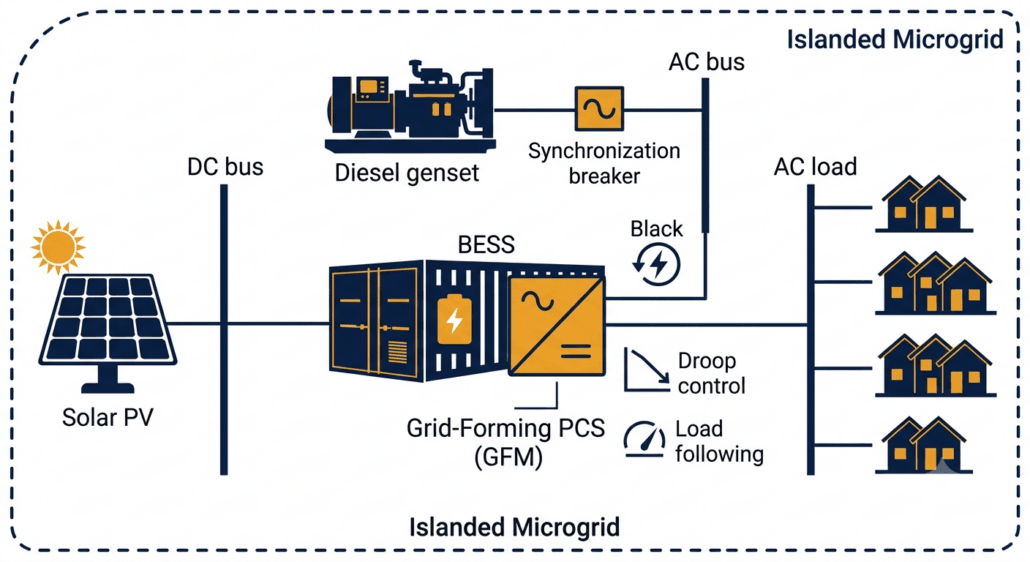
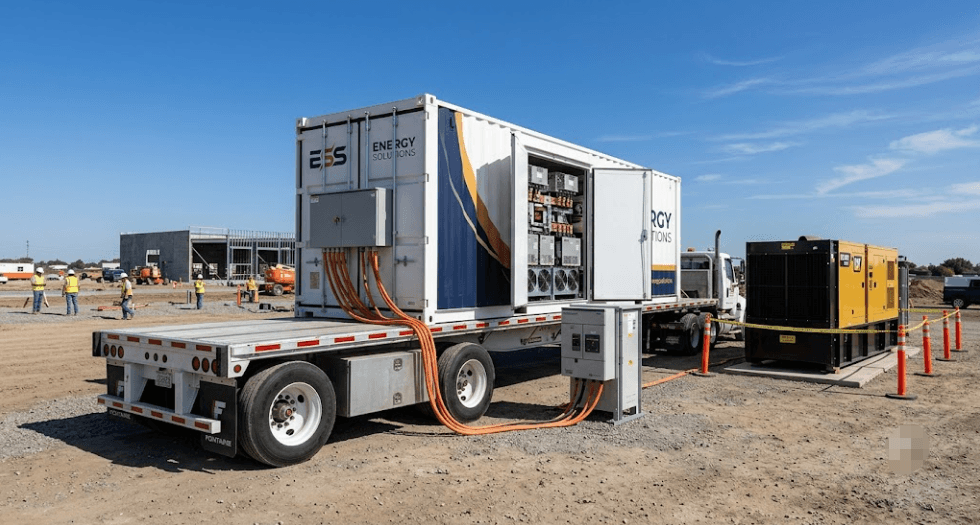
Consider four scenarios. A factory running peak shaving needs a PCS that switches to backup mode within 20 ms. By contrast, a 200 MW grid project needs sub-200 ms frequency response and reactive power control. An island microgrid, meanwhile, needs the PCS to synthesise the AC voltage reference — because no utility connection exists at all. Finally, a mobile BESS on a trailer needs ruggedness and fast site commissioning above all else.
Therefore, this guide covers each of the four application types in detail. Furthermore, it includes a master comparison table so you can see exactly which PCS functions are mandatory, optional, or not needed for each system type. By the end, you will have a clear framework for evaluating any BESS PCS proposal.
What Is a BESS PCS?
Inside every battery energy storage system, the Power Conversion System converts DC from the battery cells to AC for loads or the grid. During charging, it reverses direction and converts AC back to DC. Crucially, both functions share a single hardware platform — hence the term bidirectional.
As Sunlith’s PCS vs. Inverter guide explains, a PCS includes far more than just a bidirectional inverter. In addition, it handles reactive power control, protection functions, grid synchronisation, and communication with the BMS and EMS. According to NLR’s Power Electronics research, the PCS is one of the most critical components in grid-connected storage — because its control functions directly determine grid stability and service quality.
Moreover, the Bidirectional Inverter vs PCS comparison on this site highlights PCS-specific capabilities — including multi-port DC support, islanding, and black start. None of these are available in a stand-alone inverter. However, which of these capabilities you actually need depends entirely on your application type.
Four Application Types at a Glance
Before diving into each type, here is a quick overview showing how the four BESS application categories differ in their primary PCS priorities.
System Type
Typical Power
Grid Connection
Primary PCS Priority
C&I (Behind-the-Meter)
30 kW – 2 MW
Grid-connected, LV/MV
Peak shaving, backup power, solar integration
Utility Scale (Front-of-Meter)
2 MW – 500 MW+
Grid-connected, MV/HV
FFR, reactive power, grid code compliance
Microgrid / Off-Grid
10 kW – 50 MW
Islanded or weak grid
Grid-forming, black start, load following
Mobile BESS
50 kW – 5 MW
Temporary grid or off-grid
Portability, ruggedness, fast commissioning
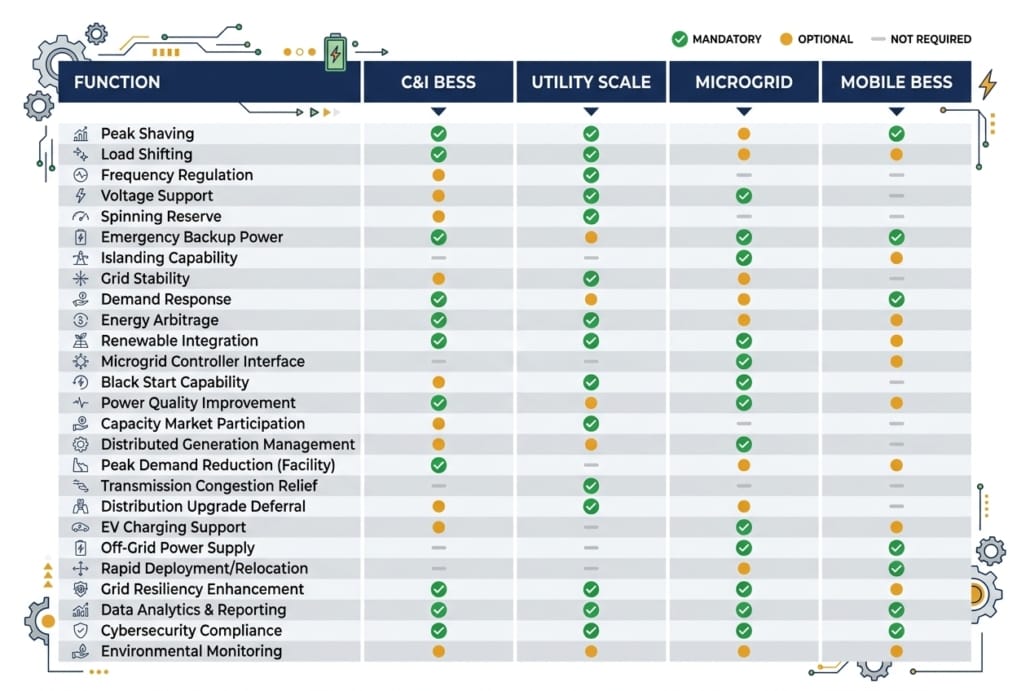
Master Comparison Table: BESS PCS Functions by Application Type
Use this table to compare PCS requirements across all four system types. Functions marked ✔ Mandatory must be specified and tested. Those marked ◉ Optional are recommended in certain site conditions. Those marked ✘ Not Required are not applicable to that system type.
PCS Function / Feature
C&I BESS
Utility Scale
Microgrid / Off-Grid
Mobile BESS
Bidirectional AC-DC Conversion
✔ Mandatory
✔ Mandatory
✔ Mandatory
✔ Mandatory
Peak Shaving / Load Shifting
✔ Mandatory
✘ Not Required
✘ Not Required
◉ Optional
Seamless Transfer / UPS Mode
✔ Mandatory
✘ Not Required
✔ Mandatory
✔ Mandatory
Solar PV Integration (AC/DC)
✔ Mandatory
◉ Optional
✔ Mandatory
◉ Optional
Fast Frequency Response (FFR)
✘ Not Required
✔ Mandatory
✘ Not Required
✘ Not Required
Primary Frequency Response (PFR)
✘ Not Required
✔ Mandatory
◉ Optional
✘ Not Required
Reactive Power (Q) Control
◉ Optional
✔ Mandatory
◉ Optional
✘ Not Required
LVRT / HVRT (Ride-Through)
◉ Optional
✔ Mandatory
✘ Not Required
◉ Optional
Grid-Following Mode (GFL)
✔ Mandatory
✔ Mandatory
◉ Optional
✔ Mandatory
Grid-Forming Mode (GFM)
✘ Not Required
◉ Recommended
✔ Critical
◉ Optional
Black Start Capability
✘ Not Required
◉ Optional
✔ Critical
◉ Optional
Droop Control
✘ Not Required
◉ Optional
✔ Critical
◉ Optional
Load Following
✘ Not Required
✘ Not Required
✔ Critical
◉ Optional
Genset Synchronisation
✘ Not Required
✘ Not Required
✔ Critical
✔ Mandatory
Time-of-Use (TOU) Scheduling
✔ Mandatory
✘ Not Required
✘ Not Required
◉ Optional
Multi-Port DC Input (PV + Battery)
◉ Optional
✘ Not Required
✔ Mandatory
◉ Optional
IEC 61850 / SCADA Integration
✘ Not Required
✔ Mandatory
◉ Optional
✘ Not Required
Modbus TCP / EMS Communication
✔ Mandatory
✔ Mandatory
✔ Mandatory
✔ Mandatory
Wide DC Input Voltage Range
✘ Not Required
✘ Not Required
✔ Mandatory
✔ Mandatory
Overload Capability (150–200%)
✘ Not Required
✘ Not Required
✔ Critical
✔ Mandatory
Compact / Trailer-Mount Design
✘ Not Required
✘ Not Required
✘ Not Required
✔ Critical
Rapid Commissioning (< 4 hrs)
✘ Not Required
✘ Not Required
✘ Not Required
✔ Critical
IP55+ Outdoor Enclosure
◉ Optional
✔ Mandatory
✔ Mandatory
✔ Critical
Noise Level < 65 dB(A)
✔ Mandatory
✘ Not Required
◉ Optional
◉ Optional
NERC CIP / Cybersecurity
✘ Not Required
✔ Mandatory
✘ Not Required
✘ Not Required
Legend: ✔ Mandatory = must be specified and verified at FAT | ◉ Optional = recommended for certain conditions | ✘ Not Required = not applicable
Which PCS functions are mandatory, optional, or not needed? This comparison covers all four BESS application types in one quick-reference chart.
C&I BESS PCS Functions and Features
A C&I — Commercial and Industrial — BESS sits behind the utility meter, serving loads inside a building or factory. Unlike utility systems, its PCS does not need to meet grid operator mandates. Instead, it must respond to site-level conditions to deliver financial returns. Specifically, the financial case comes from cutting demand charges, shifting energy to cheap tariff windows, and providing backup power during outages.
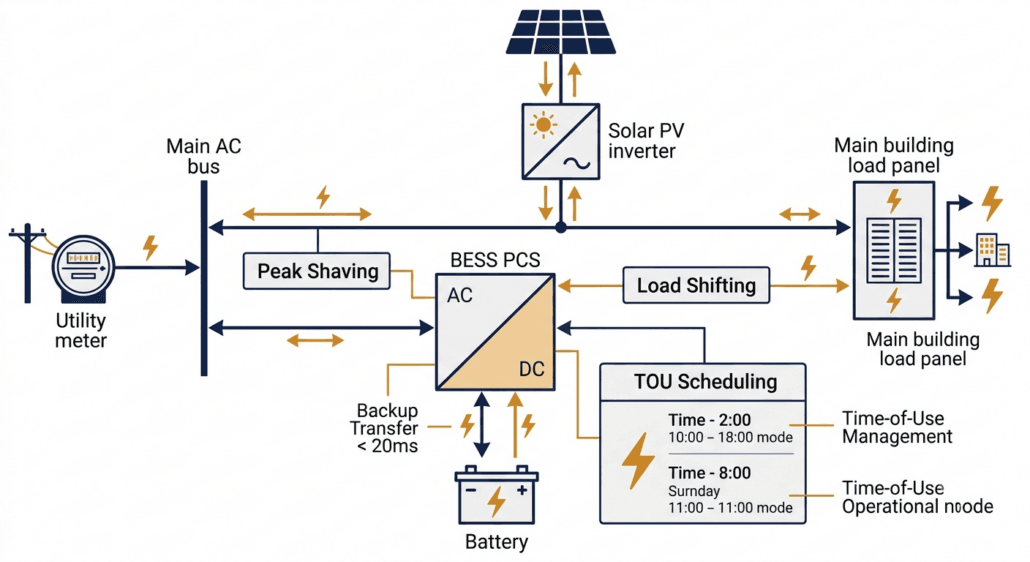
In a C&I system, the PCS manages power flow between the utility meter, solar array, and site loads — all simultaneously.
Peak Shaving and Time-of-Use Scheduling
Peak shaving is the most financially important C&I BESS PCS function. Demand charges can account for 30–50% of a commercial electricity bill. Therefore, the PCS charges the battery during low-demand periods and then discharges during peak demand to reduce the demand reading at the meter. Furthermore, time-of-use (TOU) scheduling shifts energy consumption into cheaper tariff windows, reducing energy cost on top of the demand saving.
Both functions require the PCS to support scheduled cycles via the EMS. Additionally, the PCS must respond to dynamic tariff signals from the utility in real time. As the IEA’s Grid-Scale Storage report notes, demand-side flexibility is one of the fastest-growing commercial storage applications globally. Consequently, TOU scheduling is now a baseline requirement in most C&I BESS tenders.
Seamless Transfer and Backup Power
When the grid fails, the C&I BESS PCS must switch to island mode fast enough to protect sensitive equipment. This transfer — called a seamless transfer or UPS mode — must complete within 20 ms for most commercial sites, and within 10 ms for data centres or precision manufacturing. Critically, seamless transfer is not a standard feature on all PCS products, so buyers must list the maximum allowed transfer time explicitly in their specification.
Furthermore, the PCS must be able to supply the full site load in island mode — not just a fraction of it. Therefore, both the transfer time and the island-mode power rating must be tested during factory acceptance testing (FAT). Accepting a vendor declaration without live testing is a common and expensive commissioning mistake.
Solar PV Integration
Most C&I BESS projects include rooftop or carport solar PV, so the PCS must integrate with the solar inverter. Two integration methods are available. AC coupling connects the solar inverter and PCS on the same AC bus — straightforward to retrofit, though energy passes through two conversion stages, which adds losses. DC coupling, by contrast, connects solar panels directly to the BESS DC bus via a DC-DC converter inside the PCS. This cuts conversion losses significantly. However, DC coupling requires the PCS to support multi-port DC input, so buyers must specify this feature explicitly at procurement stage.
C&I PCS Key Specifications
Power Range: 30 kW – 2 MW continuous output
Seamless Transfer: < 20 ms to island mode (< 10 ms for critical loads)
TOU Scheduling: Via EMS with dynamic tariff integration
Solar Integration: AC-coupled or DC-coupled PV input support
Grid Code: IEEE 1547 / UL 1741-SA for LV interconnection
Noise: < 65 dB(A) at 1 m for indoor installations
Communications: Modbus TCP to site EMS or BMS
Utility Scale BESS PCS Functions and Features
A utility-scale BESS connects to the medium or high-voltage grid in front of the meter. Consequently, its PCS must comply with grid operator requirements — legal obligations rather than performance suggestions. These requirements are more precise, more rigorously enforced, and technically more demanding than anything a C&I project faces. Therefore, a utility-scale PCS is a genuinely different machine from a C&I unit, even if the basic conversion function is the same.
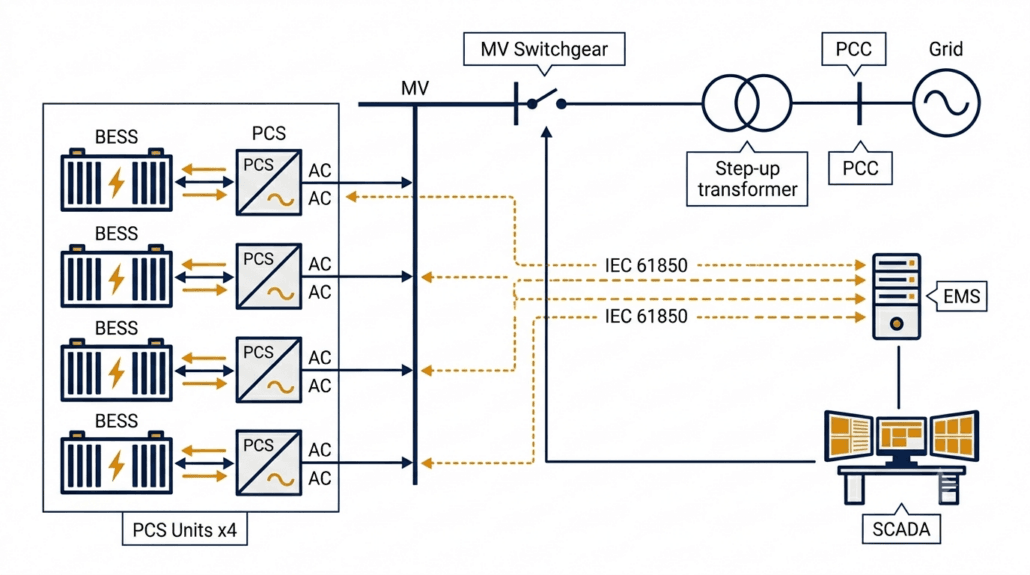
At utility scale, multiple PCS units run in parallel, feeding through a step-up transformer to the grid, with full IEC 61850 SCADA integration.
Fast Frequency Response (FFR)
FFR is the most commercially valuable utility-scale PCS function. When grid frequency drops — for example, because a large generator trips — the PCS must detect the deviation and ramp power within milliseconds. Most grid operators set the response window at 200 ms. However, some markets require 150 ms, and AEMO in Australia now tenders for sub-100 ms response.
To achieve these targets, the PCS control loop must use a dedicated high-speed frequency measurement algorithm — standard power quality meters are far too slow. Furthermore, the EMS-to-PCS communication link must have a round-trip latency below 50 ms, otherwise the communication delay consumes the available response window before the PCS even starts ramping. According to the US Department of Energy Energy Storage Grand Challenge, fast-responding battery storage is central to grid stability as thermal generation retires. Consequently, FFR is now a baseline commercial requirement for most utility-scale BESS contracts.
Reactive Power Control
Utility-scale BESS must provide reactive power — VAR — support to the grid. Under IEEE 1547-2018 in North America and EN 50549 in Europe, this function is mandatory. Specifically, the PCS must inject or absorb reactive power across all four quadrants of the PQ operating plane.
One critical detail: the PCS must deliver Q control even when the battery is at minimum state of charge — a requirement known as Q-at-night capability. Notably, some PCS products restrict reactive power output when the battery is in standby. Therefore, buyers must test Q-at-zero-kW operation during commissioning rather than rely on a datasheet claim alone.
Voltage Ride-Through: LVRT and HVRT
Grid codes require BESS to stay connected during voltage disturbances. LVRT — Low Voltage Ride-Through — means the PCS holds its grid connection during faults and injects reactive current to support the network voltage. According to ENTSO-E’s Network Code on Requirements for Generators, LVRT capability must extend down to 15% of nominal voltage for up to 625 ms. HVRT works in reverse — the PCS stays connected and absorbs reactive power during grid over-voltages.
Together, LVRT and HVRT define the voltage operating envelope of the PCS. Buyers must obtain the full voltage-time profile from the vendor and then verify it against the grid code at their specific point of interconnection. Requirements vary by country and operator, so this step cannot be skipped.
Grid-Following vs Grid-Forming at Utility Scale
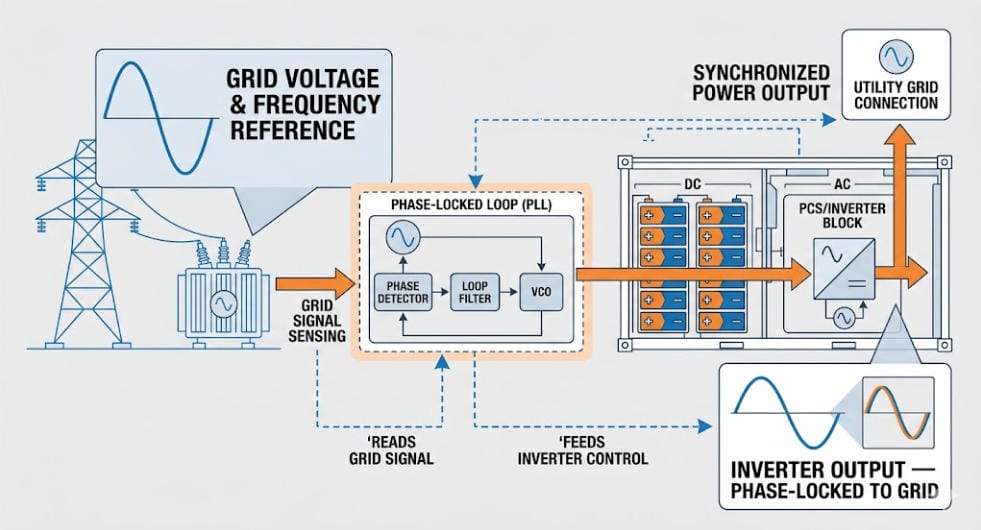
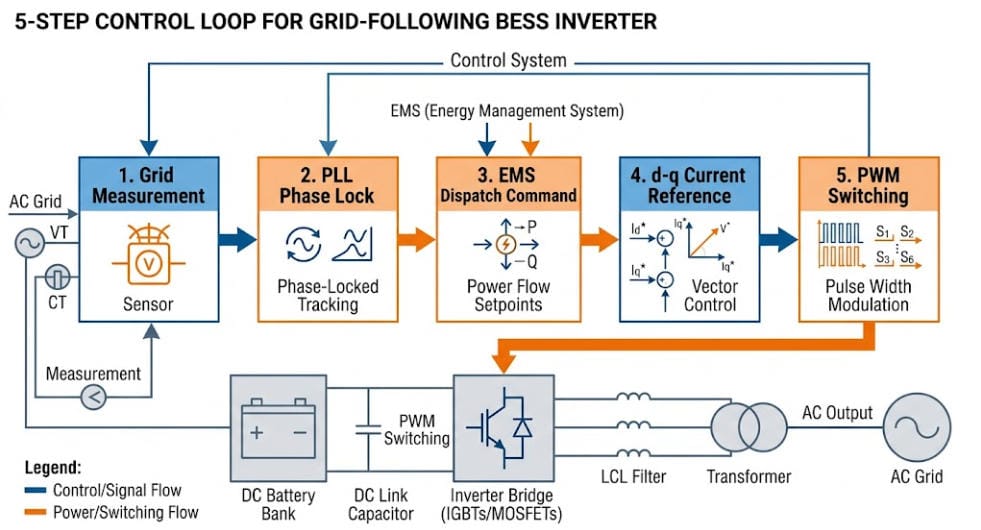
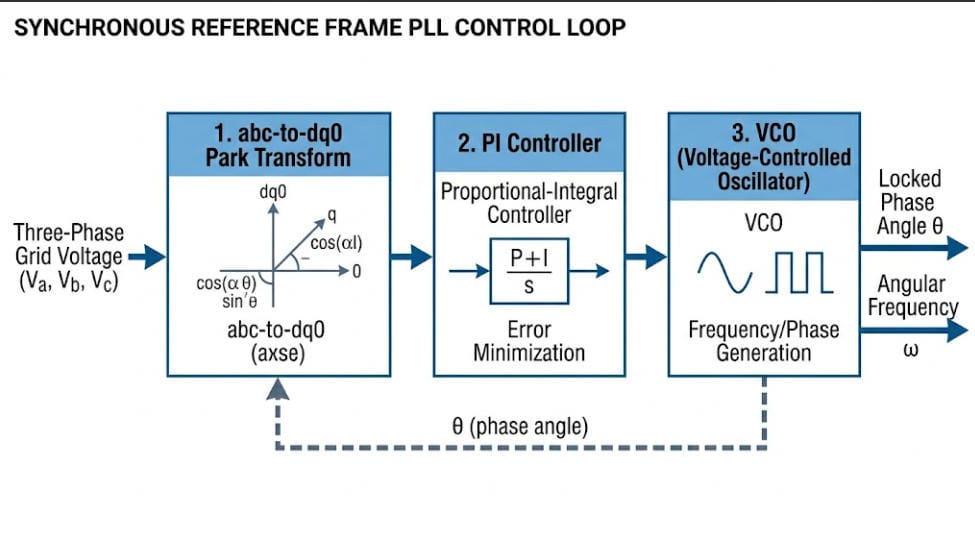
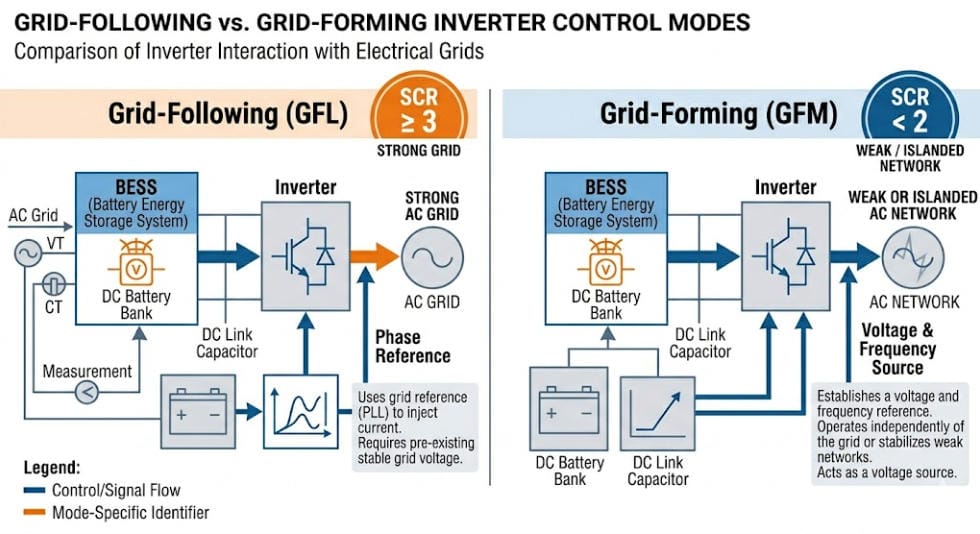
Most utility-scale PCS units operate in grid-following (GFL) mode — synchronising to the grid via a Phase-Locked Loop and injecting current according to EMS setpoints. GFL works well on strong grids. However, as renewable penetration increases, grids are weakening and GFM capability is becoming more important.
Grid-forming (GFM) mode provides better fault current support and voltage stability on weak grids. As Sunlith’s Microgrid BESS technical guide notes, Australia already had over 1,070 MW of grid-forming BESS deployed by mid-2025. Therefore, GFM is mainstream technology, and buyers of utility-scale systems in high-renewable regions should evaluate it seriously.
Utility Scale PCS Key Specifications
FFR Latency: < 150–200 ms from event to ramp start
Q Control: Four-quadrant reactive power at all SOC levels including zero kW
LVRT / HVRT: Must match grid code voltage-time profile at PCC
DC Voltage: 1,000 V or 1,500 V DC to reduce cabling losses at scale
Communications: IEC 61850 GOOSE for deterministic low-latency dispatch
Cybersecurity: NERC CIP (North America) or IEC 62351 encryption
Certifications: IEEE 1547, EN 50549, AS/NZS 4777, UL 1741-SA — market-dependent
Microgrid and Off-Grid BESS PCS Functions and Features
Among all four application types, an off-grid or islanded microgrid BESS places the most demanding requirements on the PCS. No utility grid exists to act as a voltage and frequency reference. Consequently, the PCS must create that reference entirely from battery power. This changes nearly everything about how the system operates — from the control architecture down to the protection coordination.
In an off-grid microgrid, the BESS PCS synthesises the local AC voltage and frequency from scratch — with no utility connection to lean on.
Grid-Forming Mode: The Non-Negotiable Requirement
Grid-forming (GFM) mode is the single most important requirement for any off-grid BESS PCS. Without it, the system simply cannot operate in an islanded environment. In GFM mode, the PCS synthesises the local AC voltage and frequency directly from battery DC power. All other devices in the microgrid — solar inverters, gensets, loads — then lock onto the PCS output as their grid reference.
This role is fundamentally different from a grid-connected system, where the PCS follows an existing grid reference. Consequently, GFM requires a completely different control architecture — it is not simply a software switch added to a grid-following PCS. Therefore, buyers must verify GFM certification through independent testing, not just through a vendor’s datasheet claim.
Black Start
Black start is the ability to energise a completely dead AC network from battery power alone, starting from zero volts. This function is essential for off-grid sites and increasingly mandatory for grid-scale microgrid contracts. However, it is also one of the most commonly missing features in PCS datasheets.
Specifically, black start requires the PCS to ramp up the AC bus voltage gradually — from zero — then connect loads in sequence as the voltage stabilises. Furthermore, close coordination with the protection scheme is needed to prevent fault currents during energisation. Therefore, black start must be tested and verified during commissioning. Listing it in a specification without on-site validation is not sufficient.
Droop Control and Load Following
In an islanded system, loads shift constantly and there is no external grid to absorb imbalances. Therefore, the PCS must continuously match its output to the instantaneous load demand — a function called load following. Droop control is closely related: it allows the PCS to share load automatically with a genset or another BESS unit by adjusting output in proportion to frequency or voltage deviations, without waiting for a central EMS command.
Consequently, droop control improves microgrid stability and allows multi-source systems to operate reliably even when the EMS communication link is temporarily lost. For these reasons, droop control and load following are both marked as critical requirements in the master comparison table above.
Genset Synchronisation
Many microgrids include a diesel or gas genset as a backup source. Before the interconnecting breaker closes, the BESS PCS must synchronise its output voltage with the genset — matching frequency, phase, and amplitude. Without proper synchronisation, inrush currents and voltage transients can damage both the PCS and the genset. Moreover, the PCS must manage transitions smoothly in both directions: when the genset starts up and when it shuts down.
Microgrid PCS Key Specifications
Grid-Forming Mode: Mandatory — PCS must synthesise local AC voltage and frequency
Black Start: Must be tested and certified on-site, not just listed in a datasheet
Droop Control: Autonomous load sharing without relying on EMS command
Load Following: Fast response to sudden load steps — no external grid buffer
Genset Sync: Smooth breaker closure with diesel or gas generators
Seamless Transfer: < 10 ms for critical load protection in island mode
Overload: 150–200% of rated current for 10 s to handle motor start loads
DC Voltage Range: Wide window to handle SOC swings without derating in island mode
Mobile BESS PCS Functions and Features
Mobile BESS units are trailer-mounted or containerised storage systems that travel between sites. Common applications include event venues, construction sites, disaster relief operations, emergency grid backup, and temporary peak demand support. Unlike fixed installations, however, mobile BESS PCS units must prioritise three things above all else: portability, ruggedness, and speed of deployment.
Mobile BESS units must reach full power output within hours of arriving on site — which demands a compact, rugged PCS with fast commissioning and multi-source compatibility.
Compact Design and High Power Density
Above all, a mobile BESS PCS must fit inside a trailer or small container. For this reason, power density is the primary design constraint — and liquid-cooled PCS units are preferred above 200 kW because they deliver more power per cubic metre and generate significantly less noise than air-cooled equivalents. Additionally, the PCS must tolerate vibration and shock loads during road transport, which standard stationary units are simply not designed to handle.
Rapid Site Commissioning
Speed of deployment is what sets mobile BESS apart from every other application type. A mobile BESS must reach full power output within a few hours of arriving on site — not the multi-week integration process typical of a permanent installation. Therefore, the PCS must support plug-and-play commissioning: pre-configured protection settings, automatic detection of local grid frequency (50 Hz or 60 Hz), and simple plug-in connections for power and communications.
Furthermore, the PCS must support multiple connection scenarios out of the box — temporary grid connection, islanded operation with a genset, or fully standalone off-grid mode. Consequently, mobile PCS units must include both grid-following and grid-forming capabilities as standard. Waiting for a firmware upgrade or specialist configuration on-site defeats the purpose of a mobile system.
Genset Integration and Overload Capability
Mobile BESS units frequently operate alongside diesel generators. Therefore, the PCS must synchronise with the genset smoothly and manage load transfers in both directions — when the engine starts and when it shuts down. Additionally, overload capability is a hard requirement for mobile deployments. Motor start loads on construction sites or industrial events can draw 150–200% of steady-state current for several seconds. A PCS that trips under this load makes itself useless.
Rugged Enclosure and Wide Temperature Range
Mobile BESS units deploy in unpredictable environments — muddy construction sites, outdoor festivals, flood-affected areas, and extreme climates. Consequently, the PCS must carry an IP55 or higher enclosure rating to resist dust and water ingress. Furthermore, the operating temperature window must extend well beyond typical stationary limits — many mobile PCS products are rated for operation between -25°C and +55°C and storage down to -40°C.
Mobile BESS PCS Key Specifications
Design: Compact, high power density; liquid cooling preferred above 200 kW
Transport Tolerance: Rated for road vibration and shock per IEC 60068-2
Commissioning Time: < 4 hours from arrival to full power output
Grid Frequency Auto-Detect: 50 Hz / 60 Hz without manual reconfiguration
Operating Modes: Grid-following and grid-forming built in as standard
Genset Sync: Smooth synchronisation and load transfer in both directions
Overload: 150–200% rated current for 10 s minimum
Enclosure: IP55 minimum; IP65 for harsh environments
Temperature Range: -25°C to +55°C operating; -40°C storage
PCS Functions Common to All Four Application Types
While each application type has unique demands, several PCS functions are universal. These baseline capabilities define what a PCS is — regardless of where it is installed or what grid code applies.
Bidirectional DC-AC Power Conversion
Every BESS PCS converts DC to AC during discharge and AC to DC during charging. Modern units reach peak conversion efficiency of 96% to 98.5%. However, round-trip efficiency matters more than peak figures. As Sunlith’s energy storage losses guide explains, power conversion is one of the four main loss categories in any BESS. Even a 1% PCS efficiency improvement compounds significantly across a 15-year project life — so it is worth specifying carefully.
BMS and EMS Communication
Two control layers interface with the PCS. Working from the bottom up: the Battery Management System (BMS) sends real-time charge and discharge limits — maximum current, minimum cell voltage, and thermal boundaries. These limits must always be respected by the PCS, including during high-priority grid response events. Above the BMS sits the Energy Management System (EMS), which sends power setpoints and operating mode commands to the PCS.
As Sunlith’s BESS communication protocols guide explains, the BMS transmits SOC, SOH, cell voltages, temperatures, current, and fault codes to enable safe and optimised dispatch. Consequently, the PCS-BMS-EMS communication stack is not merely a data link — it is a safety-critical control interface that must be validated end-to-end before commissioning.
DC-Side Battery Protection
Regardless of application type, all BESS PCS units must protect the DC bus from electrical faults. Key protection functions include over-current limiting, overvoltage protection and DC bus voltage regulation, pre-charge control to prevent capacitor inrush, earth fault detection, and short-circuit protection. Together, these functions protect the battery cells and reduce the risk of thermal runaway events. Therefore, buyers should always request the full DC protection relay specification — not just the AC circuit breaker ratings.
Key Technical Features to Specify in Any BESS PCS
Regardless of application type, the parameters below form a baseline specification checklist for any BESS PCS request for proposal (RFP).
Feature
Typical Range
Notes
Rated Power
30 kW – 10 MW per unit
Confirm continuous rating — not peak or 30-second duty
DC Voltage Range
600 V – 1,500 V DC
Must cover full battery SOC range without derating
AC Output Voltage
400 V / 690 V / 11 kV
MV output reduces transformer count at utility scale
Peak Efficiency
97% – 98.5%
Also request weighted average at your load profile
Power Factor Range
0.8 lead – 0.8 lag
Confirm Q capability at zero kW active output
FFR Response Time
< 100 – 200 ms
Verify against grid code at interconnection point
Grid-Forming Mode
Mandatory (microgrid)
Optional at utility scale; essential for off-grid
Seamless Transfer
< 20 ms C&I; < 10 ms off-grid
Test at FAT — do not accept a datasheet figure only
Communications
Modbus TCP / IEC 61850
IEC 61850 GOOSE for FFR; Modbus TCP for C&I dispatch
Certifications
IEEE 1547, UL 1741-SA, EN 50549
Request current certificates with expiry dates
Cooling
Forced air / Liquid-cooled
Liquid cooling preferred above 500 kW
Enclosure Rating
IP54 indoor; IP55+ outdoor
IP65 for mobile or harsh-environment sites
Warranty
5 – 10 years
Align with BESS project life of 15–20 years minimum
Relevant Standards for BESS PCS
Standards differ by region and application type. Always verify that certifications are current, geographically valid, and cover the specific grid code version in force at your interconnection point. Furthermore, check expiry dates — expired certifications are a common and avoidable cause of project delays.
Use this checklist when writing a BESS PCS request for proposal (RFP). Start with the application type — it determines which items below are mandatory.
Define application type: C&I, utility, microgrid, or mobile. This single decision shapes every other requirement.
Rated Power: Specify continuous AC output (kW) and DC input separately — not peak ratings.
DC Voltage Window: Confirm the PCS operates across the full battery SOC range without derating at either end.
Efficiency Curve: Request weighted average efficiency at your typical daily load profile, not only the nameplate peak value.
Grid-Forming Mode: Mandatory for microgrid. Specify if needed for weak-grid or mobile deployments.
Seamless Transfer Time: < 20 ms for C&I; < 10 ms for off-grid critical loads. Test at FAT without exception.
FFR Response Time: Define maximum latency from EMS setpoint to output ramp start — applicable to utility scale only.
Reactive Power: Specify power factor range. Confirm Q control works at zero kW active power output.
Black Start: Specify explicitly if required — not included in all PCS products. Test on-site.
Overload Capability: 150–200% rated current for 10 s — mandatory for microgrid and mobile types.
Commissioning Time: < 4 hours from arrival to full output — applicable to mobile BESS deployments.
Communications: Specify Modbus TCP, IEC 61850 GOOSE, or CAN Bus as required for your application.
Certifications: List required standards by jurisdiction. Request current certificates with expiry dates.
Enclosure Rating: IP54 for indoor; IP55+ for outdoor; IP65 for mobile or harsh-environment sites.
Inside a battery energy storage system, the Power Conversion System converts DC electricity from the battery to AC for loads or the grid. During charging, it reverses and converts AC to DC. Beyond this basic function, it also controls reactive power, responds to grid frequency and voltage events, and protects the battery. In off-grid systems, furthermore, it synthesises the local AC voltage and frequency reference from battery power alone.
Are C&I and utility scale BESS PCS units the same product?
No — they are significantly different. A C&I PCS focuses on peak shaving, load shifting, solar integration, and fast backup transfer. A utility-scale PCS, by contrast, must meet strict grid code requirements for FFR, reactive power control, and voltage ride-through. Consequently, you cannot simply scale up a C&I PCS for a utility project — the control architecture, communications, and certification requirements are fundamentally different.
Does an off-grid microgrid need a different PCS?
Yes, absolutely. A microgrid BESS PCS must operate in grid-forming mode — synthesising the local AC voltage and frequency without any external grid connection. In addition, it must support black start, droop control, load following, and genset synchronisation. None of these are required in most grid-connected applications. Therefore, always specify off-grid requirements explicitly in procurement documents — do not assume they are included.
What makes a mobile BESS PCS different from a fixed installation?
A mobile BESS PCS must be compact, transport-rated, and fast to commission on arrival. It must auto-detect local grid frequency and support both grid-following and grid-forming modes as standard. Furthermore, it must tolerate road vibration, wide temperature ranges, and variable site conditions that a stationary unit would never encounter. Consequently, mobile PCS units are a distinct product category — not simply a stationary PCS mounted on a trailer.
What efficiency should I expect from a BESS PCS?
Modern BESS PCS units reach peak efficiency of 97% to 98.5%. However, weighted average efficiency across a typical daily profile runs 1–2% lower than the peak figure. Therefore, always request the weighted average efficiency for your specific load profile — the nameplate peak value alone is not a reliable basis for energy yield calculations.
Which standards does a BESS PCS need?
Certification requirements depend on your project location and application type. In the US, IEEE 1547-2018 and UL 1741-SA are typically required. Meanwhile, Europe relies on the EN 50549 standard. For projects in Australia, AS/NZS 4777 is mandatory. Additionally, utility-scale projects in North America must meet NERC CIP cybersecurity requirements. See Sunlith’s Worldwide PCS Certification Guide for full details by country.
How Sunlith Energy Approaches BESS PCS Selection
At Sunlith Energy, we treat the PCS as one of the most important decisions in any energy storage project. Every engagement begins with an application analysis that defines the required operating modes, protection settings, and grid code obligations for that specific site. Furthermore, we verify certifications independently — rather than accepting vendor declarations without review.
Our team has evaluated PCS products across C&I, utility, microgrid, and mobile deployments. Importantly, we carry out PCS-EMS-BMS integration testing before any system leaves the factory. This ensures that communication protocols, protection coordination, and control modes are all validated end-to-end. Consequently, our clients avoid the costly commissioning surprises that arise when integration is left to the site team.
Contact the Sunlith Energy team if your project needs a BESS PCS specification review, vendor proposal evaluation, or commissioning support.
Selecting the right BESS PCS comes down to knowing your application. A C&I system needs peak shaving, backup transfer, and solar integration. A utility-scale project demands FFR, reactive power control, and full grid code compliance. An off-grid microgrid requires grid-forming mode, black start, and droop control. A mobile BESS, moreover, needs ruggedness, fast commissioning, and multi-mode operation out of the box. Therefore, there is no single PCS specification that fits all four scenarios — and trying to use one is a recipe for expensive rework.
Consequently, the first and most important step is to define your application type precisely. From there, use the master comparison table and specification checklists in this guide to build your PCS requirements. Furthermore, involve your PCS vendor early, verify certifications independently, and test all critical functions — especially seamless transfer, black start, and FFR — during factory acceptance testing before the system ships.
Sunlith Energy works with EPCs, project developers, and asset owners across all four BESS application types. Contact our team to discuss PCS requirements for your next project.
Introduction: Why BESS C-Rate Changes Everything About System Price and Performance
Every Battery Energy Storage System (BESS) datasheet carries a C-rate figure. It sits alongside capacity in kWh, chemistry type, and cycle life. Yet the BESS C-rate is almost always the least-explained number on the page — and, in practice, the most consequential one.
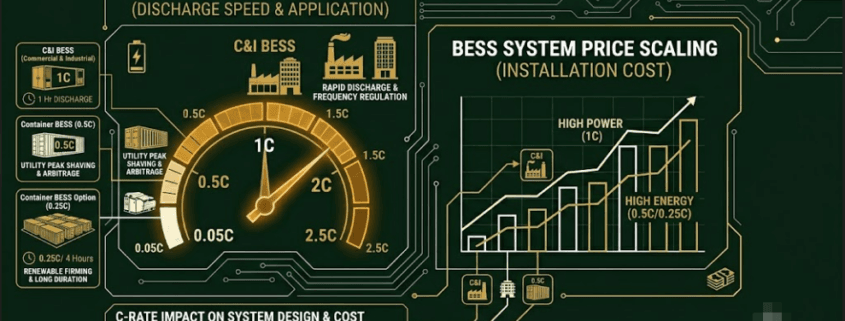
Understanding BESS C-rate matters because it governs three things at once. First, it sets how much peak power the system can deliver. Second, it controls how quickly the battery recharges between dispatch events. Third, it predicts how long cells will last under real operating conditions. As a result, BESS C-rate has a direct, measurable effect on installed system cost. In fact, the price gap can be large. Between a 0.5C energy-type system and a 2C power-type system of identical kWh capacity, the difference is often 50 to 100 per cent.
This guide explains the BESS C-rate concept from first principles. It covers both charge and discharge C-rates based on foundational National Laboratory of the Rockies (NLR) battery storage technology basics with worked examples. It also maps the full relationship between C-rate tier, application, and installed price. By the end, therefore, you can read any BESS datasheet with confidence. You will also be able to compare quotations on a like-for-like basis.
1. What Is BESS C-Rate? Definition, Formula and Notation
BESS C-rate is a standardised measure of how fast a battery is charged or discharged relative to its total storage capacity. The “C” stands for capacity. The number in front of it acts as a multiplier of that capacity.
📐
BESS C-rate formula: C-rate = Current (A) ÷ Nominal Capacity (Ah) Example — 200 Ah LFP battery: • Discharged at 200 A → 1C → full discharge in 1 hour • Discharged at 400 A → 2C → full discharge in 30 minutes • Discharged at 100 A → 0.5C → full discharge in 2 hours
Importantly, BESS C-rate is chemistry-independent and capacity-independent. For example, a 1C discharge of a 10 kWh residential BESS delivers 10 kW. In contrast, a 1C discharge of a 2 MWh grid system delivers 2 MW. In both cases, the rate is relative — it describes discharge speed as a proportion of total storage, regardless of system size.
BESS C-Rate Notation: Reading the Two Datasheet Formats
Two notation formats appear on datasheets and both describe the same BESS C-rate value. The multiplier format uses a number before C: 2C means discharge at double the 1-hour rate, giving a full drain in 30 minutes. The fractional format divides capacity: C/2 means discharge at half the 1-hour rate, giving a full drain in 2 hours.
Therefore, C/2 and 0.5C are identical. Similarly, C/10 and 0.1C are identical. When a datasheet shows a charge rate of C/5 alongside a discharge rate of 1C, the system charges five times more slowly than it discharges. As explained in Section 2, this asymmetry is a deliberate engineering choice — not a product limitation.
BESS C-Rate Quick Reference: From 0.1C to 10C
C-Rate
Meaning
Discharge Time
Charge Time (at same rate)
Real-World Parallel
C/10 (0.1C)
Discharge at 1/10th capacity current
10 hours
10 hours
Solar trickle charge / overnight backup reserve
C/5 (0.2C)
Discharge at 1/5th capacity current
5 hours
5 hours
Long-duration island grid storage
C/2 (0.5C)
Discharge at half capacity current
2 hours
2 hours
C&I energy arbitrage, solar self-consumption
1C
Discharge at full capacity current
1 hour
1 hour
Peak shaving, daily cycling BESS
1.5C
Discharge at 1.5× capacity current
40 minutes
—
Aggressive demand charge reduction
2C
Discharge at double capacity current
30 minutes
—
Grid frequency response, EV charging buffer
3C
Discharge at 3× capacity current
20 minutes
—
Fast-response ancillary services
10C
Discharge at 10× capacity current
6 minutes
—
Ultra-fast EV charging, power electronics
2. BESS Charge C-Rate vs Discharge C-Rate: Why the Two Figures Differ
Most explanations of BESS C-rate focus only on discharge — how fast the battery empties. However, charge C-rate is equally important for dispatch planning and cell longevity. In most commercial BESS installations, moreover, the two figures are deliberately set at different levels.
Why BESS Charge C-Rate Must Stay Below Discharge C-Rate
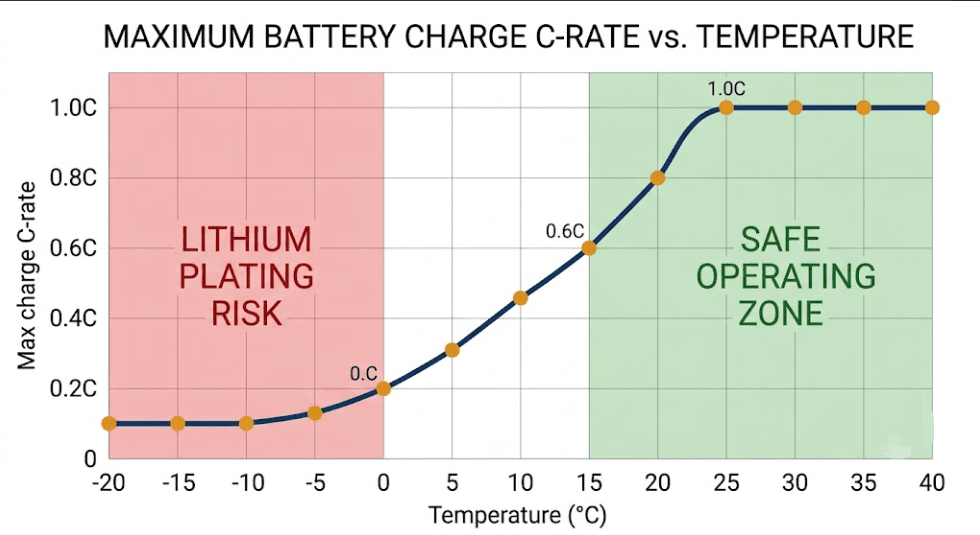
Charging a lithium-ion cell forces lithium ions back into the anode. If this process happens too fast, ions arrive at the anode surface faster than the graphite lattice can absorb them. Consequently, excess lithium deposits as metallic lithium on the surface — a process called lithium plating. Lithium plating is irreversible. It permanently reduces capacity and, in extreme cases, creates internal short circuits that cause thermal runaway. For the full electrochemistry behind why lithium plating happens, how it differs from ordinary SEI layer growth, and why it’s largely preventable, see our guide on SEI layer growth and lithium plating in LFP cells.
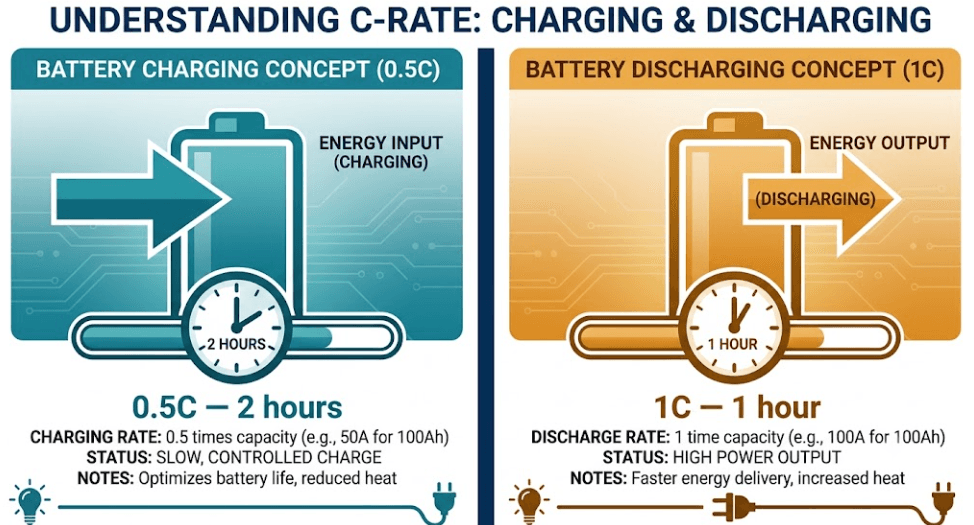
For this reason, LFP manufacturers specify a maximum continuous charge C-rate that is lower than the discharge limit. The most common commercial BESS pairing — 0.5C charge and 1C discharge — reflects this constraint directly.
⚡
Standard C&I LFP BESS charge vs discharge C-rate: Charge rate: 0.5C → fills in 2 hours → protects anode, maximises cycle life Discharge rate: 1C → empties in 1 hour → delivers full rated peak power This asymmetry is intentional — not a limitation.
The practical implication is straightforward. A 500 kWh / 1C BESS delivers 500 kW to the grid in one hour. However, it needs two hours to recharge at 0.5C. Therefore, always plan your dispatch schedule around the slower charge rate — not just the discharge figure.
BESS Charge C-Rate Worked Examples: 100 Ah LFP Cell
Charge C-Rate
Charge Time (100 Ah cell)
Charge Current
BESS Application
LFP Cell Impact
C/10 (0.1C)
10 hours
10 A
Overnight trickle from small solar array
Excellent — maximum cycle life, zero thermal risk
C/5 (0.2C)
5 hours
20 A
Slow solar charge, low-irradiance days
Excellent — best for calendar longevity
C/2 (0.5C)
2 hours
50 A
Standard C&I BESS grid or solar charge
Very good — recommended daily charge rate for LFP
1C
1 hour
100 A
Fast recharge between morning/afternoon peaks
Good — within spec; monitor cell temperature
2C
30 minutes
200 A
Rapid recharge for EV charging buffer BESS
Moderate — active cooling essential; reduces cycle life
3C+
<20 minutes
300 A+
Ultra-fast charging stations
Risk of lithium plating — requires specialist cells only
BESS Discharge C-Rate Worked Examples: 100 Ah LFP Cell
Discharge C-Rate
Discharge Time (100 Ah)
Power Output
BESS Application
LFP Cell Impact
C/4 (0.25C)
4 hours
25 A
Frequency regulation support, overnight levelling
Excellent — minimal degradation, long cycle life
C/2 (0.5C)
2 hours
50 A
Residential shifting, off-grid night supply
Excellent — standard low-stress operating point
1C
1 hour
100 A
C&I peak shaving (30–60 min demand events)
Very good — standard commercial BESS daily operation
1.5C
40 minutes
150 A
Aggressive demand charge reduction
Good — within LFP spec with adequate thermal management
2C
30 minutes
200 A
Grid frequency regulation, EV buffer discharge
Moderate — higher heat, faster degradation per cycle
10C
6 minutes
1,000 A
EV ultra-fast charging station power burst
Requires high-power LFP or specialist cell chemistry
Full BESS C-Rate Cycle: Real Charge and Discharge Example
To anchor both BESS C-rate concepts in a real project, consider a 500 kWh LFP BESS at a cold-storage facility. The site faces a peak demand charge triggered above 400 kW. Consequently, the system runs two discharge events per day:
NIGHT CHARGE (22:00–00:00) — BESS C-rate: 0.5C, from off-peak grid Current: 408 A | Power: 250 kW | Duration: 2 hours Result: fully charged at midnight using cheap off-peak tariff
MORNING DISCHARGE (08:00–09:00) — BESS C-rate: 1C, peak shaving Current: 815 A | Power: 500 kW | Duration: 1 hour Result: production ramp absorbed; grid import held below 400 kW
AFTERNOON CHARGE (12:00–14:00) — BESS C-rate: 0.5C, from rooftop solar Current: 408 A | Power: 250 kW | Duration: 2 hours Result: battery refilled by solar for the afternoon peak
This 0.5C charge / 1C discharge pattern keeps LFP cells within their optimal BESS C-rate operating window. As a result, cycle life typically exceeds 4,000 full cycles at 80% depth of discharge — sufficient for over 10 years of daily operation.
📌
BESS C-rate rule of thumb: if your system is specified for 1C discharge, plan to charge at 0.5C. If it operates at 2C discharge, confirm that the cell chemistry and BMS support at least 1C charging without lithium plating risk.
3. How the BMS Enforces BESS C-Rate Limits in Real Operation
The Battery Management System (BMS) is the component that enforces BESS C-rate limits at the cell level during both charge and discharge. It monitors current, cell temperature, and state of charge (SoC) in real time. Whenever any parameter approaches its safe boundary, the BMS intervenes immediately to protect the cells.
BMS Charge Control: CC/CV Protocol and BESS C-Rate Tapering
During charging, the BMS applies a constant-current / constant-voltage (CC/CV) protocol. The constant-current phase runs at the rated charge C-rate until cell voltage approaches its upper limit. At that point, the BMS transitions to constant-voltage mode and tapers current down to zero as the cell reaches full charge. This taper phase is critical — without it, sustained high-current charging causes the lithium plating described in Section 2.
BMS Discharge Control: BESS C-Rate Curtailment and SoH Tracking
During discharge, the BMS monitors current and cell temperatures continuously. When current exceeds the rated BESS C-rate, the BMS issues a curtailment command within milliseconds. This typically happens because of a load spike or an inverter fault. High-C-rate BESS systems operating at 2C or above require particularly fast BMS response. For this reason, systems designed for sustained 2C operation use BMS platforms with sub-10 ms cell-level sampling. This specification adds cost, but it also prevents thermal cascades.
In addition to real-time protection, the BMS tracks the cumulative effect of each C-rate event on State of Health (SoH). SoH is the ratio of current capacity to the original rated capacity. Understanding what a battery management system (BMS) is and how its topology handles cell balancing during high-discharge events reveals why operating consistently at or below the rated BESS C-rate is one of the most effective ways to preserve SoH while extending your warranty-covered cycle count.
4. How High BESS C-Rate Reduces Usable Capacity: The Rate-Capacity Effect
A battery discharged at a high BESS C-rate typically delivers less total energy than the same battery at a lower rate. This happens even though the nameplate capacity is identical. Consequently, this fact surprises many buyers. It is also one of the most important concepts to understand before specifying a system.
Why BESS C-Rate Affects How Much Energy You Actually Receive
Inside a lithium-ion cell, energy is released as lithium ions migrate from cathode to anode through the electrolyte. This migration has a physical speed limit, set by the ionic conductivity of the electrolyte and the diffusion rate of lithium within the electrode materials.
At low BESS C-rates, ions cross the electrolyte in an orderly process and the full stored capacity is accessible. At high C-rates, however, ions are forced to move faster than the cell structure allows. This causes electrode polarisation — a phenomenon documented in peer-reviewed research on the Nature Energy rate-capacity effect in Li-ion batteries — causing a voltage drop that pushes terminal voltage below the cutoff threshold before all stored lithium has been extracted.
The result is measurable. At 2C BESS C-rate, an LFP cell rated at 100 Ah may only deliver 88–92 Ah of usable capacity. At 0.5C, moreover, the same cell may deliver 101–103 Ah because slower discharge allows more complete lithium extraction.
📌
Always ask your BESS supplier for the capacity derating curve: How much kWh does the system deliver at your operating BESS C-rate — not just at 1C nameplate?
A responsible supplier provides derating figures at 0.5C, 1C, and 2C. If they cannot supply this data, treat the capacity claim with caution.
Heat Generation at High BESS C-Rate: The I²R Effect
High BESS C-rates also increase internal heat generation through ohmic heating. The heat load follows the I²R relationship — doubling the discharge current quadruples the heat generated inside the cell. Over time, this heat degrades the electrolyte and the SEI layer, accelerating capacity fade per cycle and reducing total cycle life. Managing this heat, therefore, is the primary engineering challenge at C-rates above 1C.
5. BESS C-Rate by Application: Matching Discharge Speed to Your Use Case
The correct BESS C-rate for any project is determined by the application. Specifically, it depends on how fast energy must be delivered and how long the discharge event lasts. The following subsections cover the most common commercial and grid-scale use cases, with the appropriate C-rate for each.
Solar Self-Consumption and Energy Arbitrage: BESS C-Rate 0.25C – 0.5C
Storing solar generation during the day and releasing it in the evening requires a slow, multi-hour discharge. A 0.5C BESS C-rate, discharging over two hours, maximises energy extracted per cycle and keeps cells cool. This C-rate is also appropriate for time-of-use tariff arbitrage — buying cheap overnight energy and dispatching it into high-tariff afternoon hours.
Off-Grid and Island Grid BESS: C-Rate 0.125C – 0.5C
Island grid systems — remote communities, mine sites, and island networks — typically size their BESS for 4 to 8 hours of overnight supply. Consequently, the discharge C-rate falls between 0.125C and 0.25C. The charge rate is set to match available solar or diesel generation, usually 0.2C to 0.5C. Sizing hardware for these remote, microgrid environments requires special attention, as lower C-rates in island systems also reduce the risk of frequency excursions caused by high-power discharge events on a weak grid. For a deeper dive into microgrid design, consult our island grid BESS engineering guide.
Commercial and industrial sites with a utility demand charge need a BESS that discharges at full power for 30 to 60 minutes. A 1C BESS C-rate delivers full rated output for exactly one hour. A 1.5C rate covers a 40-minute demand event at higher power. This is the dominant commercial BESS application globally and the segment where LFP chemistry operates most comfortably.
Grid Frequency Regulation: BESS C-Rate 1C – 3C
Frequency regulation requires the BESS to inject or absorb power within seconds of a deviation signal. Response windows of 200 ms to 2 seconds are common in the UK, Australian, and US ancillary service markets. Sustained cycling at 1C to 2C BESS C-rate is achievable with commercial LFP. Above 2C, however, specialist high-power LFP or NMC cells are needed and system cost rises sharply.
EV DC Fast Charging Buffer: BESS C-Rate 2C – 5C
A BESS behind an EV fast charging station must absorb and re-release energy in short, high-power bursts — often at 2C to 5C. The buffer prevents those bursts from appearing on the site’s utility demand meter. Standard commercial LFP cells are not rated for sustained operation at this BESS C-rate. Therefore, high-power LFP or NMC cylindrical cells are required, along with mandatory liquid cooling.
Ultra-Fast EV Charging: BESS C-Rate 5C – 10C
350 kW ultra-fast chargers require the buffer BESS to sustain 5C to 10C discharge bursts for several minutes. Lithium Titanate Oxide (LTO) chemistry handles this C-rate range thanks to its exceptional rate capability and 10,000+ cycle life. However, LTO’s cell cost of $400–$600/kWh makes it unviable for most stationary BESS applications outside ultra-fast charging.
6. How BESS C-Rate Drives System Price: Chemistry, Cooling and Power Electronics
Two BESS systems with identical kWh ratings can carry installed prices that differ by 70 to 100 per cent. The BESS C-rate specification is the primary explanation for that gap. Every component — from cell to inverter — must be engineered for the maximum current the system handles. Higher BESS C-rate means higher current. Higher current, in turn, means more expensive cells, more capable cooling, and heavier power electronics, aligning with global cost benchmarks detailed in the IRENA electricity storage report.
A. How Cell Chemistry Determines Maximum BESS C-Rate
Standard LFP prismatic cells — the foundation of most commercial BESS — are engineered for energy density first. Their thick electrode coatings store more lithium per unit volume but slow ion migration, capping continuous discharge C-rate at 1C to 2C. Cells capable of 3C to 5C use thinner coatings, higher-porosity separators, and electrolyte additives that improve ionic conductivity. Each refinement adds manufacturing cost, which flows directly into system price.
Chemistry
Full Name
Cont. Discharge C-Rate
Max Charge C-Rate
Cycle Life
Cell Cost ($/kWh)
Best BESS Use
LFP
Lithium Iron Phosphate
0.5C – 2C
0.3C – 1C
3,000 – 6,000+
$80–$120
C&I, grid storage, solar — the commercial standard
NMC
Nickel Manganese Cobalt
1C – 3C
0.5C – 1.5C
1,000 – 2,000
$100–$150
High-power BESS, EV charging buffers
NCA
Nickel Cobalt Aluminium
1C – 3C
0.5C – 1C
500 – 1,500
$110–$160
EV traction, high energy-density applications
High-Power LFP
Power-optimised prismatic
2C – 5C
1C – 2C
2,000 – 4,000
$100–$140
Demand response, fast-response grid services
LTO
Lithium Titanate Oxide
5C – 10C
5C – 10C
10,000–20,000+
$400–$600
Rail, UPS, ultra-fast charging — not cost-viable for BESS
B. How Cooling System Cost Scales With BESS C-Rate
Heat generation scales with the square of current (I²R). Doubling BESS C-rate from 1C to 2C therefore quadruples the thermal load on the cell stack. A BESS designed for 2C continuous operation requires a proportionally more capable cooling system. As a result, thermal management is often the largest single incremental cost driver between a 1C and 2C system.
Cooling System
C-Rate Supported
Heat Removal
System Cost Premium
Typical BESS Application
Passive air (natural convection)
Up to 0.5C
Low
+0% (baseline)
Residential BESS, low-cycle backup
Forced air (fan cooling)
0.5C – 1C
Moderate
+5–10%
C&I BESS, standard daily cycling
Air-conditioned HVAC enclosure
1C – 1.5C
Good
+10–20%
Containerised grid BESS
Liquid cooling (glycol plates)
1.5C – 3C
Excellent
+20–35%
High-power BESS, EV charging hub buffer
Direct liquid immersion
3C – 10C burst
Superior
+40–60%
Ultra-fast charging, power-critical grid services
C. Power Electronics and BMS Cost at Higher BESS C-Rate
The inverter and DC/DC converters must be rated for the peak current the battery delivers. A 2C inverter requires larger switching transistors, heavier copper busbars, and more sophisticated short-circuit protection than a 1C inverter of the same kWh capacity. The cost premium for power electronics typically runs at 15 to 30 per cent between a 1C and 2C BESS system.
The BMS also costs more at higher BESS C-rates. Millisecond-level cell sampling, faster protection relay actuation, and more detailed thermal runaway prediction algorithms are all required above 2C. None of these features are standard on entry-level BMS hardware, so they represent a real and quantifiable cost premium.
D. BESS C-Rate Price Tier Framework: From 0.25C to 10C
Combining chemistry, cooling, and power electronics, the following table maps each BESS C-rate tier to its indicative installed system cost and target application.
C-Rate Tier
Chemistry
Installed Cost ($/kWh)
Peak Power (500 kWh system)
Target Application
What Drives the Price?
0.25C–0.5CEnergy Tier
Standard LFP prismatic
$180–$260
125–250 kW
Solar arbitrage, long-duration storage, off-grid
Lowest-cost cells, passive/fan cooling, simple BMS and inverter
0.5C–1CCommercial Standard
LFP prismatic
$220–$320
250–500 kW
C&I peak shaving, daily energy shifting, grid support
Standard market spec — most competitive $/kWh segment
LTO chemistry premium, extreme cooling, custom power electronics
💡
The most important buyer insight on BESS C-rate and price: Do not compare BESS quotations on $/kWh alone.
Always calculate $/kW = total installed cost ÷ peak power output (kW).
A 0.5C BESS delivers only half the peak power of a 1C BESS at the same kWh. If your peak shaving application needs 500 kW for one hour, the 0.5C system will fail the dispatch event — making the cheaper quote the more expensive mistake.
E. Same 500 kWh, Three BESS C-Rates, Three Very Different Prices
BESS Profile
Capacity
C-Rate
Peak Power
Cooling
Est. Installed Cost
Designed For
Energy-type LFP(solar storage)
500 kWh
0.5C
250 kW for 2 hrs
Fan / HVAC
~$130,000
Solar self-consumption, off-grid overnight, slow energy shifting
EV DC fast charging hub, grid frequency services, rapid response
All three systems store exactly 500 kWh and all use lithium-ion technology. However, peak power output ranges from 250 kW to 1,000 kW — a factor of four. Installed cost, moreover, varies from $130,000 to $250,000. The BESS C-rate specification alone explains both of those differences entirely.
7. BESS C-Rate vs Power-to-Energy Ratio: Converting Duration to C-Rate
When EPCs and project developers discuss BESS sizing, they rarely say ‘1C’. Instead, they say ‘1-hour system’ or ‘4-hour battery’. These two languages describe the same thing from different angles — and converting between them is essential for accurate specification.
The power-to-energy ratio (P/E ratio) describes how much power (kW) a BESS delivers per unit of stored energy (kWh). A 1-hour system delivers its full energy in one hour — which is exactly a 1C BESS C-rate. As a result, duration and C-rate are mathematical inverses of each other.
Fast-response frequency regulation, EV charging buffer
0.5 hour battery storage, 2C BESS
1-hour BESS
1C
1 kW per kWh
C&I peak shaving, demand charge reduction
1 hour battery storage, 1C BESS
2-hour BESS
0.5C
0.5 kW per kWh
C&I energy arbitrage, solar self-consumption
2 hour battery storage, 2 hour BESS
4-hour BESS
0.25C
0.25 kW per kWh
Grid energy arbitrage, utility time-shifting
4 hour battery energy storage, 4 hour BESS
8-hour BESS
0.125C
0.125 kW per kWh
Long-duration storage, island grid, overnight off-grid supply
8 hour BESS, long duration energy storage
10–12-hour BESS
0.1C
0.1 kW per kWh
Seasonal shifting, remote area power, hydrogen hybrid
long duration battery storage, 10 hour BESS
This table is directly useful for RFP and tender documents. For example, when a grid operator specifies a 4-hour BESS at 100 MW, they are asking for 400 MWh of storage at 0.25C BESS C-rate. Similarly, when a C&I site asks for a 2-hour peak shaving BESS at 500 kW, they need 1 MWh at 0.5C.
📌
When comparing BESS quotations, confirm both the energy (MWh) AND the power (MW or kW). The duration — which is the inverse of BESS C-rate — is the figure that ties them together. Example: ‘500 kWh BESS’ without a stated duration is an incomplete specification. 500 kWh at 1C = 500 kW for 1 hour. The same 500 kWh at 0.5C = 250 kW for 2 hours. Same energy, very different power — and a very different price.
8. PCS Rating and BESS C-Rate: Why the Inverter Can Limit Your System Output
One of the most common and costly mistakes in BESS procurement is assuming that the battery’s C-rate alone determines maximum power output. In practice, this is not the case. The Power Conversion System (PCS) is the inverter or bidirectional converter that connects the battery to the AC grid. It also sets a hard ceiling on power. That ceiling can be significantly lower than the battery’s C-rate capability.
⚠️
Classic BESS C-rate bottleneck example: Battery capacity: 1 MWh LFP Battery C-rate: 1C → capable of 1,000 kW (1 MW) PCS rating: 500 kW Actual system output: 500 kW (limited by PCS, not battery BESS C-rate) Effective C-rate: 0.5C (not 1C)
The battery can run at 1C BESS C-rate. The system cannot. The PCS is the bottleneck.
This situation arises when a developer uses an undersized inverter to reduce upfront cost, or when a site’s grid connection capacity limits the inverter size. In both cases, the battery is paying the price premium for a 1C BESS C-rate it cannot exercise in real operation. Additionally, whether you deploy grid-forming vs grid-following BESS inverters will dictate how the PCS handles these localized capacity constraints and dynamic grid response demands.
PCS Sizing Rules Matched to BESS C-Rate and Application
Application
Recommended Duration
BESS C-Rate
Required PCS Rating
PCS Sizing Rule
Solar self-consumption
2–4 hours
0.25C–0.5C
25–50% of battery kWh as kW
PCS ≥ Battery kWh × C-rate
C&I peak shaving
1–2 hours
0.5C–1C
50–100% of battery kWh as kW
PCS must match peak shaving kW target
Demand charge reduction
30–60 min
1C–1.5C
100–150% of battery kWh as kW
PCS sized to full 1C discharge power
Grid frequency regulation
15–30 min
2C–3C
200–300% of battery kWh as kW
PCS and protection relays rated for peak current
EV fast charging buffer
15–30 min
2C–5C
200–500% of battery kWh as kW
Both battery AND PCS must support full BESS C-rate
The correct approach is to size the PCS first, matching it to the application’s power requirement. Then, size the battery to deliver that power for the required duration. Therefore, always start from the load, not from the battery specification.
Step 1 — Define peak power (kW): what is the maximum power the system must deliver? This sets the PCS rating.
Step 2 — Define duration (hours): how long must the system sustain that power? Combined with Step 1, this gives the energy requirement in kWh.
Step 3 — Confirm BESS C-rate: divide peak power (kW) by total energy (kWh) to get the C-rate. Confirm the battery chemistry supports it.
Step 4 — Verify PCS–battery match: the PCS kW rating must equal or exceed Battery (kWh) × Operating BESS C-rate. Navigating these technical boundaries is a core reason why establishing strong EPC + battery integrator partnerships in C&I energy early in the design phase prevents costly hardware mismatches.
📌
PCS sizing shortcut for BESS C-rate verification: Required PCS rating (kW) = Battery capacity (kWh) × Operating BESS C-rate For a 500 kWh battery at 1C BESS C-rate: PCS ≥ 500 kW For a 500 kWh battery at 2C BESS C-rate: PCS ≥ 1,000 kW For a 500 kWh battery at 0.5C BESS C-rate: PCS ≥ 250 kW
If the PCS is undersized, the effective BESS C-rate is: PCS (kW) ÷ Battery (kWh)
9. Temperature and BESS C-Rate: How Cold Weather Derate Your System
Laboratory BESS C-rate specifications are measured at 25°C. Real-world BESS projects operate in temperatures ranging from -30°C in Nordic and Canadian sites to +45°C in Middle Eastern and Australian installations. Temperature directly affects both the charge C-rate and discharge C-rate that the BMS will permit — and the impact can be dramatic.
How Low Temperature Reduces Charge C-Rate in BESS
Cold temperatures reduce the ionic conductivity of the electrolyte and slow lithium diffusion within the graphite anode. As a result, lithium ions cannot intercalate into the anode fast enough to accommodate a standard charge rate. The excess lithium then plates onto the anode surface instead. This is the same lithium plating risk described in Section 2. However, it is now triggered at much lower charging currents. Modern BMS platforms address this through temperature-dependent charge derating, automatically reducing the charge C-rate as cell temperature falls.
Cell Temperature
Max Charge BESS C-Rate (LFP)
Charge Time Impact
Lithium Plating Risk
BMS Action
Above 25°C
0.5C–1C (full rated)
Standard (2–1 hour)
Low
Full charge current permitted
15°C–25°C
0.3C–0.5C
+20–40% longer
Low–moderate
Mild current reduction
5°C–15°C
0.2C–0.3C
+50–100% longer
Moderate
Significant derating applied
0°C–5°C
0.1C–0.2C
5–10 hours
High
Strong derating; pre-heat recommended
-10°C–0°C
0.05C or disabled
Charging impractical
Very high
BMS may disable charging entirely
Below -10°C
Charging disabled
Not permitted
Severe
Cell heating required before charge
How Temperature Affects BESS Discharge C-Rate
Discharge is less temperature-sensitive than charging because the electrochemical reactions are thermodynamically favoured during discharge. However, cold temperatures do increase internal cell resistance. Consequently, available power decreases and effective capacity falls. For example, a 100 Ah LFP cell rated at 1C discharge and 25°C may only safely sustain 0.7C at 0°C. Beyond that point, terminal voltage drops below the BMS cutoff threshold.
Cell Temperature
Discharge BESS C-Rate Available
Capacity Available (%)
Notes
Above 25°C
Full rated (0.5C–2C)
100%
Full performance. Monitor for overheating at 2C+.
10°C–25°C
Full rated
95–100%
Negligible impact for most commercial BESS.
0°C–10°C
~80% of rated
85–95%
Mild derating. Pre-heat recommended for 2C BESS systems.
-10°C–0°C
~60% of rated
70–85%
Noticeable power and capacity reduction.
Below -20°C
~40% of rated
50–70%
Significant derating. Active heating system essential.
Cold-Weather BESS Design: Four Strategies to Protect C-Rate Performance
Insulated enclosures: containerised BESS in cold climates should use insulated steel enclosures with low-wattage heating elements to maintain cell temperature above 5°C during idle periods.
Battery heating mats: direct cell-level heating pads activate when temperature falls below 5–10°C. The BMS controls this automatically. As a result, the system can recharge at its rated BESS C-rate even in sub-zero ambient conditions.
Thermal buffer in C-rate spec: for projects in cold climates, specify the BESS C-rate at 10°C rather than 25°C. This gives a realistic worst-case recharge window. It also prevents dispatch planning errors.
Liquid thermal management: Liquid-cooled systems with a heat pump can both cool cells in summer and heat them in winter. For sites with a wide temperature range, this is the most capable engineering solution.
💡
Cold-climate BESS C-rate project rule: Always request the manufacturer’s charge derating curve from -20°C to +40°C. Size the recharge window based on the minimum expected cell temperature, not the standard 25°C BESS C-rate specification.
A system with a 2-hour recharge at 25°C may need 5+ hours at 5°C. If the site has two peak events per day, this gap can cause missed dispatch.
Deploying these climate control and thermal safety measures ensures your system remains compliant with international risk management protocols. For a complete breakdown of these compliance requirements, check our guide to the IEC 62933-5 safety standards for ESS frameworks.
10. BESS C-Rate and Battery Warranty: What Manufacturers Actually Guarantee
Battery warranties are frequently misread by buyers. Most manufacturers do not simply warrant a number of years or a number of cycles in isolation. Instead, they warrant a specific combination of cycles, throughput, depth of discharge, operating temperature — and BESS C-rate. Operate outside the warranted C-rate and the warranty may be void, even if every other parameter is within limits.
How BESS C-Rate Appears in the Three Main Warranty Structures
Cycle-based warranty: warrants a number of full charge/discharge cycles (e.g. 4,000 cycles to 80% SoH). The warranted cycle count is stated at a specific BESS C-rate and depth of discharge (DoD). For example: ‘4,000 cycles at 1C / 80% DoD / 25°C’. Operating at 2C BESS C-rate and 80% DoD may reduce the warranted cycle count to 2,500.
Throughput-based warranty: warrants a total energy throughput in MWh (e.g. 3,000 MWh per MWh of installed capacity). This approach is nominally BESS C-rate-agnostic, but manufacturers typically include a maximum continuous C-rate clause that, if exceeded, voids the throughput warranty.
Calendar-based warranty: warrants a minimum SoH at a future date (e.g. 70% capacity retention after 10 years). Calendar warranties almost always include an operating envelope — BESS C-rate, temperature, DoD — that defines the conditions under which the warranty applies.
Warranty Type
Typical BESS C-Rate Condition
What Changes If C-Rate Limit Is Exceeded
What to Ask the Supplier
Cycle-based
1C charge / 1C or 2C discharge at 25°C, 80% DoD
Warranted cycle count reduces; some manufacturers publish a BESS C-rate adjustment table
Request cycle-life curve at your operating C-rate and DoD
Throughput-based
Max continuous BESS C-rate clause (e.g. 1C or 2C)
Throughput warranty voided if max C-rate exceeded
Confirm the maximum C-rate clause and whether burst C-rate is treated differently
Calendar-based
Operating envelope includes BESS C-rate, temp, DoD
Warranty void if operating envelope breached
Request the full BESS C-rate operating envelope in the warranty document — not just the summary term sheet
⚠️
Real BESS C-rate warranty example (illustrative):
Supplier warranty states: ‘6,000 cycles to 80% capacity retention at 0.5C charge / 0.5C discharge / 80% DoD / 25°C’
Your project operates at: 0.5C charge / 2C discharge / 80% DoD / 25°C
Warranted cycles at 2C BESS C-rate may be only 3,000–4,000 — half the headline figure. Consequently, always request the C-rate adjustment table before signing.
BESS C-Rate Warranty Checklist: Five Questions to Ask
Request the cycle-life warranty condition in full — BESS C-rate, DoD, temperature, and SoH end-point.
Ask for a cycle-life vs BESS C-rate adjustment table: how does the warranted cycle count change at your operating rate?
Confirm whether burst BESS C-rate events (e.g. 2C for 30 seconds) are counted differently from continuous C-rate.
Verify that the PCS-enforced maximum C-rate matches the warranty’s maximum BESS C-rate clause — any gap is a warranty risk. Ensure these limits map structurally to the battery cell’s factory compliance standards, as outlined in our overview of IEC certifications for BESS, which dictate the thermal and current boundaries manufacturers are legally allowed to warrant.
For throughput warranties, calculate total expected throughput over the project life and confirm it falls within the warranted limit at your operating C-rate.
Tracking these complex lifetime metrics is becoming highly standardized across the industry. To see how manufacturers are beginning to openly disclose this operational data, see our guide on how the battery passport drives transparency in the energy transition by providing immutable health and C-rate logs.
11. Real Utility-Scale BESS C-Rate Examples: Three Grid Project Profiles
The BESS C-rate concepts in this guide apply across all system scales — from a 50 kWh rooftop unit to a 400 MWh grid project. Reflecting utility deployment patterns tracks in the IEA battery storage report, the three utility-scale examples below show how BESS C-rate, duration, PCS rating, and application interconnect in real project structures.
Example 1 — 100 MW / 400 MWh Grid BESS at 0.25C C-Rate: 4-Hour Energy Arbitrage
Operation: Charges overnight at 0.125C–0.25C BESS C-rate (off-peak wholesale tariff) Discharges 08:00–12:00 at 0.25C (morning peak tariff window) Cycle target: 1 full cycle per day × 365 days × 20-year project life
Why 0.25C BESS C-rate? 4-hour discharge maximises revenue capture across the full morning peak. Lower BESS C-rate reduces cell degradation and minimises thermal management cost. At this scale, 0.25C is the dominant grid arbitrage BESS specification globally.
Example 2 — 50 MW / 100 MWh Frequency Regulation BESS at 0.5C C-Rate
Operation: Participates in Frequency Containment Reserve (FCR) or equivalent market. Injects or absorbs up to 50 MW in response to frequency deviations. Actual average C-rate in operation: ~0.1C–0.2C (short bursts, not full cycles). Nominally sized at 0.5C to maintain full power availability throughout the day.
Why 0.5C? The 2-hour energy buffer ensures the system can sustain a prolonged frequency event without exhausting its state of charge. The PCS is sized for 50 MW regardless of how often it is called to respond.
Example 3 — 20 MW / 20 MWh Fast-Response BESS at 1C C-Rate: 1-Hour Duration
Operation: Paired with a large solar farm for curtailment avoidance and grid services. Discharges at up to 1C during grid frequency events or export constraint windows. An automated energy management system (EMS) for BESS orchestrates this dispatch logic, safely recharging the battery at 0.5C from solar generation within a 2-hour window.
Why 1C? 1-hour BESS is the standard grid services configuration: full power for 60 minutes covers most frequency regulation and peak shaving events. 1C is LFP’s commercial sweet spot — maximum performance, competitive price.
Project
Capacity
Power
Duration
C-Rate
Chemistry
Primary Application
Grid arbitrage BESS
400 MWh
100 MW
4 hours
0.25C
LFP prismatic
Wholesale energy arbitrage, time-shifting
Frequency regulation BESS
100 MWh
50 MW
2 hours
0.5C
LFP prismatic
FCR / FFR grid ancillary services
Fast-response solar BESS
20 MWh
20 MW
1 hour
1C
LFP prismatic
Grid services, curtailment avoidance
12. Battery Chemistry Comparison: C-Rate, Charge, Discharge and Emerging Options
The chemistry table in Section 6 covered the main commercial options. This expanded version adds sodium-ion — an emerging chemistry entering the BESS market — and separates typical charge and discharge C-rates for direct comparison.
Chemistry
Typical Charge C-Rate
Typical Discharge C-Rate
Cycle Life
Energy Density
Cell Cost ($/kWh)
BESS Suitability
Status
LFP (LiFePO4)
0.3C–1C
0.5C–2C
3,000–6,000+
Low–medium
$80–$120
Excellent — commercial standard for all BESS
Mature, dominant
NMC (LiNiMnCoO2)
0.5C–1.5C
1C–3C
1,000–2,000
High
$100–$150
Good — high-power BESS, EV charging buffers
Mature
NCA (LiNiCoAlO2)
0.5C–1C
1C–3C
500–1,500
Very high
$110–$160
Moderate — mainly EV; cost and safety limit BESS use
Mature
LTO (Li4Ti5O12)
5C–10C
5C–10C+
10,000–20,000
Very low
$400–$600
Niche — ultra-fast charging, rail; too costly for BESS
Niche, high cost
High-Power LFP (prismatic)
1C–2C
2C–5C
2,000–4,000
Medium
$100–$140
Good — demand response, fast-response grid services
Growing
Sodium-Ion (Na-ion)
0.5C–2C
1C–4C
2,000–4,000
Low–medium
$60–$90*
Promising — emerging competitor to LFP in grid storage
Emerging (2024–)
📌
Sodium-Ion (Na-ion) — what to know for BESS procurement:
Sodium-ion batteries use sodium instead of lithium as the charge carrier. Key advantages: no cobalt, no lithium, lower raw material cost, better low-temperature performance. Current limitations: lower energy density than LFP (~20–30% less); limited commercial track record.
CATL and BYD have both announced sodium-ion cells for stationary storage. Typical charge C-rate: 0.5C–2C. Typical discharge: 1C–4C. Low-temperature performance is notably better than LFP — may suit cold-climate projects.
* Current Na-ion cell cost structures reflect ongoing 2026 early commercial production volumes. These baseline figures are projected to compress further as gigafactory manufacturing scales and supply chains mature.
13. BESS C-Rate Decision Matrix: Matching Application to Specification
Use this matrix as a starting point for any BESS specification. Find your primary application, read across to the recommended C-rate, chemistry, cooling type, and indicative installed cost range.
Application
Recommended C-Rate
Duration
Chemistry
Cooling
PCS/kWh Ratio
Indicative Installed Cost
Solar self-consumption
0.25C–0.5C
2–4 hours
Standard LFP
Passive / fan
0.25–0.5 kW/kWh
$180–$260/kWh
Energy arbitrage (off-peak)
0.5C
2 hours
Standard LFP
Fan / HVAC
0.5 kW/kWh
$220–$280/kWh
Peak shaving (C&I)
1C
1 hour
LFP prismatic
HVAC
1 kW/kWh
$250–$320/kWh
Demand charge reduction
1C–1.5C
40–60 min
LFP prismatic
HVAC
1–1.5 kW/kWh
$270–$350/kWh
Frequency regulation
1C–2C
30–60 min
LFP / NMC
HVAC / liquid
1–2 kW/kWh
$300–$450/kWh
Island / off-grid grid
0.125C–0.5C
2–8 hours
Standard LFP
Fan / HVAC
0.125–0.5 kW/kWh
$200–$300/kWh
EV charging buffer
2C–5C
15–30 min
High-power LFP/NMC
Liquid cooling
2–5 kW/kWh
$380–$700/kWh
Ultra-fast EV charging
5C–10C
6–15 min
NMC / LTO
Liquid / immersion
5–10 kW/kWh
$700–$1,500/kWh
14. Five Common C-Rate Specification Mistakes — and How to Avoid Them
While capturing the advantages of a battery energy storage system (BESS) can dramatically improve a project’s ROI, design errors during procurement can quickly erase those gains. These five errors appear repeatedly in BESS engineering and EPC tendering, but each is entirely preventable with the knowledge in this guide.
Mistake 1: Specifying a 2C C-Rate When 0.5C Is Sufficient
This is the most expensive and most common mistake. A developer specifying a 2-hour peak shaving system asks for a ‘2C BESS’ when the application actually requires 0.5C. As a result, the system costs 60–80% more than necessary. It also uses liquid cooling the application never demands, and it is built with high-power cells whose extra capability is never exercised. Therefore, always derive C-rate from duration: if you need 2 hours of discharge, you need 0.5C, not 2C.
Mistake 2: Ignoring Charge C-Rate When Planning Dispatch
A BESS specified for 1C discharge is typically limited to 0.5C charge. Yet dispatch schedules are frequently planned around the discharge rate alone. Consequently, the system cannot recharge in time for a second peak event, because the 2-hour recharge window was never accounted for. To avoid this, always plan dispatch around the slower of charge and discharge C-rates.
Mistake 3: Ignoring Temperature Derating on Charge C-Rate
Cold-climate projects often specify a 0.5C charge rate at 25°C. However, the same system may only charge at 0.2C at 5°C, tripling the recharge time. This affects both daily dispatch planning and revenue model accuracy. For this reason, always request the charge derating curve for the minimum expected ambient temperature at the project site.
Mistake 4: Comparing BESS C-Rate Quotations on $/kWh Alone
A 500 kWh system at $220/kWh and a 500 kWh system at $320/kWh look like a simple $50,000 saving in favour of the cheaper option. But the $220/kWh system may be rated at 0.5C, while the $320/kWh system is rated at 1C. In that case, the cheaper system delivers only 250 kW. The more expensive system, meanwhile, delivers 500 kW. For a peak shaving application requiring 500 kW, the cheaper system simply cannot do the job. Always compare $/kW alongside $/kWh.
Mistake 5: Forgetting PCS Limitations on BESS C-Rate
A 1 MWh battery with a 1C rating is technically capable of 1 MW output. But if the PCS is rated at only 500 kW, the system is effectively a 0.5C system, regardless of the battery’s rating. Therefore, confirm that the PCS kW rating is equal to or greater than the battery capacity (kWh) multiplied by the required operating C-rate. This check takes only 30 seconds. Yet it can save months of project rework.
📌
Quick specification health-check: 1. C-Rate = Duration inverse? Duration 2 hours → 0.5C ✓ 2. PCS ≥ Battery (kWh) × C-Rate? 500 kWh × 1C = 500 kW PCS minimum ✓ 3. Charge C-rate in dispatch plan? 0.5C charge = 2 hr recharge window ✓ 4. Warranty states C-rate condition? Confirm cycle count at operating C-rate ✓ 5. Temperature derating requested? Get charge curve from -10°C to +40°C ✓
15. C-Rate Procurement Checklist: Eight Questions to Ask Every Supplier
Before signing any BESS supply agreement, confirm the following C-rate parameters in writing:
1. Rated continuous C-rate: maximum C-rate the system sustains indefinitely without thermal or SoH risk. Confirm for both charge and discharge independently.
2. Peak C-rate and burst duration: maximum C-rate for short bursts (typically 10–30 seconds). Confirm the burst duration before BMS curtailment activates.
3. Capacity derating curve: how much kWh does the system actually deliver at your operating C-rate — not just at the 1C nameplate condition?
4. Cycle life at operating C-rate: request the cycle-life warranty condition (C-rate, DoD, temperature) and a C-rate adjustment table in writing.
5. Charge derating curve vs temperature: request the charge C-rate curve from the minimum expected site temperature to +40°C.
6. PCS–battery C-rate match: confirm the PCS kW rating equals or exceeds Battery (kWh) × Operating C-rate.
7. Thermal management design C-rate: confirm the cooling system is sized for your intended C-rate, not nominal conditions.
8. Warranty C-rate operating envelope: request the full warranty operating envelope and confirm your project’s C-rate falls within the warranted range.
16. Frequently Asked Questions: BESS C-Rate
What is a good C-rate for a BESS?
For most commercial and industrial BESS applications, 0.5C to 1C is the optimal range. A 0.5C system (2-hour duration) suits solar self-consumption and energy arbitrage. A 1C system (1-hour duration) is the standard for peak shaving and demand charge reduction. Higher C-rates are only justified for grid frequency regulation (1C–2C) or EV fast charging buffers (2C–5C).
Is a higher C-rate always better?
No. A higher C-rate means higher peak power output — but it also means higher system cost, faster cell degradation, and greater thermal management requirements. Specifying a higher C-rate than your application requires wastes capital and shortens battery life. Match the C-rate to the application, not to the maximum available specification.
What C-rate is used for peak shaving?
Peak shaving typically uses a 1C discharge rate, which delivers full rated power for one hour. Sites with sharp, short demand spikes may specify 1.5C for a 40-minute discharge window. Sites with longer, flatter demand peaks may use 0.5C for a 2-hour window. The correct C-rate depends on the duration and shape of the demand event, not a single standard answer.
What C-rate is used for solar energy storage?
Solar self-consumption BESS typically operates at 0.25C to 0.5C — discharging over 2 to 4 hours through the evening peak. This slow discharge maximises the energy extracted per cycle, minimises heat generation, and extends cycle life. LFP cells at 0.5C can sustain over 6,000 – 8,000 cycles — enough for 16+ years of daily operation at 80% depth of discharge.
How does C-rate affect battery lifespan?
Higher C-rates accelerate three degradation mechanisms. These are electrolyte oxidation from heat (I²R), mechanical stress from rapid lithium intercalation, and SEI layer growth from elevated temperatures. For the full mechanism behind that mechanical stress — including why deep discharge and high C-rate damage electrode particles through different pathways — see our guide on Why Deep Discharge and High C-Rate Stress LFP Cells. As a result, a battery cycled at 2C will typically reach 80% SoH in only 2,000–3,000 cycles. The same battery at 0.5C, however, may sustain 5,000–6,000 cycles. Overall, operating at or below 1C is the single most effective way to extend LFP battery life.
What Is the Difference Between a 0.5C and 1C BESS C-Rate?
A 0.5C system takes twice as long to discharge as a 1C system. For a 500 kWh battery, 0.5C delivers 250 kW for 2 hours, while 1C delivers 500 kW for 1 hour. Both deliver the same total energy of 500 kWh. However, the 1C system delivers it at twice the power. Consequently, a 1C system costs roughly 20–40% more than a 0.5C system of the same kWh capacity. This premium reflects higher-rated power electronics and more capable thermal management.
Does a higher C-rate increase battery cost?
Yes, and the increase is significant. Every major cost component scales with C-rate. Cell chemistry costs more for higher-power cells. Thermal management shifts from air to liquid cooling above 1.5C. The inverter and PCS need larger transistors and busbars for higher current. The BMS also needs faster sampling and protection. Overall, a 2C system typically costs 50–80% more per kWh than a 0.5C system of identical capacity.
What C-rate is common in utility-scale BESS?
Utility-scale BESS varies widely by application. Grid arbitrage projects, which are typically 4-hour systems, operate at 0.25C. Frequency regulation projects, usually 2-hour systems, operate at 0.5C. Meanwhile, grid services BESS paired with solar farms commonly use 1C. In 2024–2025, the dominant global configuration is 2-hour to 4-hour LFP at 0.25C to 0.5C. This trend is largely driven by the falling cost of large-format LFP prismatic cells.
Conclusion: Getting BESS C-Rate Right From the Start
BESS C-rate is not a secondary datasheet figure. Instead, it is the specification that determines how much power your system delivers, how quickly it recharges, and how long the cells last. Directly, it also determines how much the system costs. Furthermore, it connects to the duration language EPCs use, such as 1-hour or 4-hour systems. It links to the PCS sizing your electrical engineer specifies. It links, too, to the warranty conditions your finance team relies on. Finally, it links to the temperature performance your operations team will encounter on site.
For LFP BESS in commercial and grid-scale applications, the 0.5C to 2C range covers the vast majority of real-world deployments. Before selecting a chemistry, a PCS, or a cooling system, map your application to the correct C-rate tier first. This single step is the highest-value part of the procurement process.
Need help sizing a BESS to the right C-rate for your load profile and grid requirements? Contact SunLith Energy to speak with a storage engineer.
BESS grid-following is the most widely used inverter control mode in battery storage today. In simple terms, a grid-following (GFL) inverter locks its output to the existing grid voltage and frequency. Because of this, the battery system follows the grid — not the other way around.
This approach works well in most commercial and utility projects. In fact, roughly 85% of all battery storage systems deployed worldwide use grid-following control. Therefore, understanding how it works — and where it has limits — is essential for engineers, developers, and asset owners alike.
This comprehensive guide breaks down everything you need to know. We begin with a deep dive into the technical inner workings of GFL control before comparing it directly to Grid-Forming (GFM) architecture. From there, you will learn about core C&I applications, weak-grid constraints, and critical deployment mistakes to avoid.
How a Grid-Following BESS Inverter Synchronises to the Grid
1. How a BESS Grid-Following Inverter Works
A BESS grid-following inverter acts as a controlled current source. Its job is to inject real power (watts) and reactive power (VAR) into the grid. Crucially, it does this at the exact voltage and frequency the grid is already running at.
Here is how the process works, step by step.
Step 1 — Grid Measurement
To begin, the inverter measures grid voltage, frequency, and phase angle at the Point of Common Coupling (PCC) thousands of times every second. This continuous tracking ensures the system always maintains a fresh, accurate picture of grid conditions.
Step 2 — Phase Locking via the PLL
A Phase-Locked Loop (PLL) algorithm then processes these measurements to lock the inverter’s internal reference directly to the grid’s phase angle. Consequently, the inverter stays perfectly synchronised even if the grid drifts slightly in frequency or voltage.
Step 3 — Power Dispatch from the EMS
The Energy Management System (EMS) sends a power dispatch command — for example, ‘discharge at 500 kW.’ Following this instruction, the hardware changes the target value into a current reference in the d-q rotating frame.
Step 4 — PWM Switching
High-speed IGBT transistors switch rapidly — typically at 2 to 20 kHz — using Pulse Width Modulation (PWM). As a result, the hardware generates a clean AC output that perfectly matches the reference signal.
Step 5 — Real-Time Feedback Control
Finally, a fast inner current control loop corrects any lingering errors. Running at roughly 1 to 2 kHz, this final safety loop ensures the entire BESS grid-following control cycle completes in under one millisecond.
BESS Grid-Following Inverter — Control Flow Diagram
2. The PLL: Why BESS Grid-Following Needs a Strong Grid
The Phase-Locked Loop (PLL) is the core of every GFL system. It is also the source of its main limitation.
The PLL works by comparing the inverter’s internal oscillator to the measured grid frequency. If these two variables drift apart, the algorithm instantly generates a correction signal. Once they match up perfectly, the loop achieves a ‘locked’ state. Modern BESS grid-following inverters use Synchronous Reference Frame PLLs (SRF-PLLs) to handle real-world imperfections — including unbalanced voltages and harmonic distortion.
Key point: The PLL needs a stable grid voltage to lock onto. If the grid voltage collapses, the PLL has no reference. As a result, the GFL inverter cannot maintain output on its own. This is the defining constraint of BESS grid-following technology.
SRF-PLL Block Diagram — BESS Grid-Following Inverter Control
3. BESS Grid-Following vs Grid-Forming: Key Differences
Grid-following and grid-forming are both valid technologies. However, they solve different problems. The table below shows the core differences clearly.
Attribute
Grid-Following (GFL)
Grid-Forming (GFM)
Inverter type
Controlled current source
Controlled voltage source
Needs grid voltage?
Yes — requires reference signal
No — creates its own reference
Black start capable?
No
Yes
Islanded operation?
No (without external VSI)
Yes
Synthetic inertia
Limited / indirect
Native capability
Frequency response speed
Fast (< 500 ms), reactive
Instantaneous (< 20 ms)
Cost vs baseline
Baseline cost
~10–20% premium
Min. SCR at PCC
SCR ≥ 3 recommended
Functions at SCR < 1.5
Best for
Strong-grid C&I and utility sites
Weak grids, islands, high-IBR networks
Market share (2025)
~85% of deployed systems
~15% and growing
Design rule: The key question is not ‘which is better’ — it is ‘what is the Short Circuit Ratio at your Point of Common Coupling?’ If SCR is 3 or above, BESS grid-following is the right choice. If SCR falls below 2, then Grid-Forming deserves serious consideration.
BESS grid-following is the right choice for most projects. Below are the applications where it delivers the most value.
4.1 GFL for Peak Shaving and Demand Charge Reduction
This is the most common application for C&I BESS grid-following systems. To lower costs, the EMS monitors real-time facility demand and dispatches battery power right before a peak occurs. Because utility connections are typically stable at industrial sites, the GFL inverter easily maintains a rock-solid phase reference to execute these commands with sub-second precision.
Given that demand charges often make up 30% to 70% of a commercial electricity bill, this single strategy can completely justify the initial BESS investment.
Grid-following BESS systems are ideal for energy arbitrage. In this strategy, the battery charges during off-peak hours at low tariff rates. Then it discharges during peak windows at high tariff rates. The grid itself provides the stable voltage reference needed for clean energy import and export. As a result, a well-sized GFL system can cut total energy costs by 10 to 25%.
4.3 Ancillary Services and Fast Frequency Response
Modern BESS grid-following inverters respond to frequency deviations in under 200 milliseconds. They detect frequency deviation via the PLL and adjust active power output proportionally — a method called droop-based frequency response. As a result, GFL BESS qualifies for Fast Frequency Response (FFR) and Primary Frequency Response (PFR) markets in most grid codes.
4.4 Smooth Integration for Solar and Wind Power
Renewable generation assets almost always use GFL inverters for their battery pairings. In these setups, the solar PV inverter acts as the primary grid interface while the BESS operates in parallel to absorb surplus generation. This combination fills sudden production drops to give the facility a smooth, consistent power supply.
Utility-scale projects can participate directly in regional capacity markets by providing committed megawatts of fast-responding backup generation. Because a battery can earn fixed capacity payments while executing daily arbitrage, this stacked revenue structure dramatically improves project economics.
5. BESS Grid-Following Limitations to Plan For
No technology is without constraints. Failing to understand these leads to underperforming systems and costly redesigns. Here are the four main limitations of BESS grid-following systems.
5.1 GFL Performance in Weak Grids (Low SCR)
As the Short Circuit Ratio (SCR) drops below 3, GFL inverters face severe stability challenges. When operating below an SCR of 1.5, multiple parallel units can easily trigger sub-synchronous oscillations. This interaction creates a significant operational risk for remote industrial sites, isolated microgrids, and networks with heavy inverter-based resource (IBR) penetration.
The IEEE Standard 2800-2022 directly addresses these network challenges. If your target site features an SCR below 3, executing a detailed grid stability study is a mandatory step before specifying any GFL hardware.
GFL BESS Stability vs Short Circuit Ratio — Design Boundary Chart
5.2 Total Black-Start Limitations
An islanded or dead grid cannot be energised by standard GFL hardware. Because it requires an active voltage wave to lock onto, a grid-following system cannot serve as your lone backup source during a total utility outage. To achieve complete independence, you must pair the battery with a diesel generator, a fuel cell, or a Grid-Forming inverter.
For C&I sites with a critical backup requirement, the Static Transfer Switch (STS) becomes an essential design element. We explain how below.
5.3 Microgrid Constraints Without Synchronous Reference
For isolated microgrids — remote mining camps, island grids, or off-grid industrial sites — a GFL-only BESS cannot function once grid connection is lost. In that case, a Grid-Forming inverter or a synchronous generator must hold the local voltage and frequency reference.
5.4 Control Loop Vulnerabilities During System Faults
During a severe voltage disturbance, the grid voltage drops sharply. As a result, the PLL can momentarily lose synchronisation. Modern inverters have Fault Ride-Through (FRT) algorithms to prevent tripping during these events. However, poorly tuned PLLs remain a source of nuisance trips in the field.
6. BESS Grid-Following in C&I Projects: Value Stacking
For commercial and industrial customers, a BESS grid-following system is almost always the starting point. A well-designed system combines multiple value streams at once — a practice called value stacking. The table below shows how each stream works together.
Value Stream
Typical Annual Impact
How GFL Enables It
Peak Shaving
20–40% demand charge reduction
Discharges at demand spike with sub-second precision
TOU Arbitrage
10–25% energy cost reduction
Charges off-peak, discharges at peak tariff windows
Backup Power (with STS)
Zero downtime for critical loads
STS transfers load to BESS in under 8 ms on fault
FFR / Grid Services
Additional utility revenue
PLL detects frequency deviation; responds within 200 ms
Solar Self-Consumption
15–30% more PV utilisation
Absorbs surplus solar; discharges when PV output falls
Backup Power: How GFL Works With an STS
A common misconception is that BESS grid-following cannot provide backup power. This is only partly true. When paired with a properly integrated Static Transfer Switch (STS), a GFL system can deliver seamless uninterruptible power to critical loads.
Here is why it works. The STS monitors grid voltage at millisecond resolution. When it detects a fault, it transfers the facility load from the utility to the BESS output — all within 2 to 8 milliseconds. Because this happens faster than the PLL can detect a fault event, the GFL inverter never loses its voltage reference.
As a result, critical equipment — PLCs, servers, cold chain, production lines — experiences no interruption. Furthermore, the transition is completely invisible to facility operations.
7. How the EMS Coordinates a BESS Grid-Following System
C&I BESS Architecture with Grid-Following Inverter and EMS
The BESS grid-following inverter is the executor. However, the Energy Management System (EMS) is the brain that tells it what to do and when. In a GFL BESS, the EMS handles four core coordination tasks:
Smart Dispatch — Advanced algorithms run the core math to find the best times to charge or discharge. This helps you track multiple value streams at once.
Fast Grid Response — For frequency services, the system tracks line conditions directly. It then sends speed commands to the GFL inverter in under 500 ms.
Battery Care — Tight limits (like 15–90% SoC) protect the cells. This careful upkeep ensures you keep enough power ready for grid duties.
Fault Management — If grid voltage drops, a safety routine starts right away. The code talks to the STS and BMS to make a quick, clean switch.
8. Grid Code Compliance for BESS Grid-Following Systems
Grid code rules are not optional. Every system must meet the rules set by the local network group. Here are the four key items:
Frequency Limits — Inverters must work safely inside a tight frequency band. This span is 47.5 to 51.5 Hz in Europe, and 59.5 to 60.5 Hz in North America.
Fault Ride-Through — Large voltage drops should not cause the hardware to trip off the line. Rules force units to stay online through deep sags for up to 150 ms.
Grid Voltage Support — To keep the local grid stable, systems must feed reactive power up to $\pm0.33 \text{ pu}$ when called upon.
Islanding Safety — Rules state that a system must quickly sense if it loses the main grid utility. The control loop must shut down the link in under 2 seconds.
Standard / Code
Jurisdiction
Scope
IEEE 1547-2018
USA
Interconnection of Distributed Energy Resources
ENTSO-E RfG Network Code
Europe
Generator grid connection requirements
AS/NZS 4777.2
Australia / NZ
Grid connection of inverter energy systems
IEC 62898-3-1
International
Microgrids — Technical requirements
NERC PRC-024
North America
Generator frequency and voltage relay settings
9. Key Components in a BESS Grid-Following System
A complete BESS grid-following system has several integrated layers. Each component has a specific role. Understanding all of them together is essential for good specifications and procurement decisions.
LFP Battery and BMS
LFP (Lithium Iron Phosphate) is the dominant cell chemistry for GFL BESS systems. It offers excellent thermal stability, a long cycle life of 3,500 to 6,000 cycles to 80% Depth of Discharge (DoD), and a competitive cost per kWh. The Battery Management System (BMS) monitors every cell for voltage, temperature, and state of charge.
The PCS is the inverter. It performs DC-to-AC conversion and runs the GFL control algorithms — PLL, current control loops, and droop functions. For C&I applications, PCS units typically range from 50 kW to 2,500 kW per unit. For utility scale, 2.5 MW to 5 MW units are common.
As described in Section 6, the STS is what enables a BESS grid-following system to deliver seamless uninterruptible power. It transfers load from the utility to the BESS in 2 to 8 milliseconds. This happens before the GFL inverter can lose its voltage reference.
Most C&I BESS grid-following systems connect at low voltage (400V or 480V). Larger systems use a step-up transformer to connect at medium voltage (11 kV or 33 kV). The transformer also affects the SCR at the PCC — so its impedance must be factored into the stability analysis.
10. Sizing a BESS Grid-Following System
Getting the size right from the start is critical for ROI. Oversizing wastes capital. Undersizing leaves value on the table. Here are the three key sizing considerations.
Power Rating (kW or MW)
For peak shaving, the power rating equals the target demand reduction. As an example, if a facility peaks at 2,000 kW and the target is 1,500 kW, the BESS needs at least 500 kW of discharge power. When it comes to FFR and frequency services, the power rating is determined by the contracted ancillary service volume.
Energy Capacity (kWh or MWh)
Energy capacity must sustain the required power for the needed duration. A peak shaving event might last 15 to 60 minutes. A backup power event may require 30 minutes to 4 hours. For most C&I peak shaving projects, a 2-hour duration — meaning energy equals power times two — is the standard starting point.
Sizing for Battery Degradation
LFP batteries degrade over time. As a result, a well-designed GFL system adds a 10 to 20% capacity buffer above Day 1 requirements. This ensures the system still meets performance targets at end of warranty — typically 10 years. Without this buffer, systems often fall short of contracted performance by Year 3 to 5.
11. Common BESS Grid-Following Deployment Mistakes
Based on Sunlith Energy’s project experience, certain mistakes appear most frequently. However, each one is entirely avoidable with good engineering practice.
Local SCR Data — Skipping a short circuit ratio analysis creates massive system risks. Therefore, you must request this data from the network operator before choosing hardware.
Faulty Factory Defaults — Inverters face severe control issues at sites with high harmonics. Because of this, engineers must tune the PLL settings during commissioning.
Leaving Out the STS — Omitting a static switch is a critical system error. Projects that expect clean backup power from a GFL BESS without an STS will fail.
Under-designed Protection Studies — Poorly coordinated anti-islanding settings cause frequent false alarms. To fix this, running a dedicated simulation study is a vital step.
Battery Cell Degradation — Sizing a system purely for Day 1 needs will hurt your long-term ROI. Since batteries lose capacity over time, always design for your end-of-warranty targets.
Without Rigorous Testing — Inverter firmware bugs are common in the field. Consequently, a full factory test is highly recommended to catch control errors early.
Sunlith Energy C&I GFL BESS — Commercial Installation with Solar Integration
12. The Future of BESS Grid-Following: Hybrid Control Modes
The line between grid-following and grid-forming is already beginning to blur. The next generation of inverter platforms introduces hybrid modes that give GFL inverters some grid-forming capabilities under defined conditions.
Grid-Supportive GFL with Synthetic Inertia
New control algorithms allow BESS grid-following inverters to inject synthetic inertia — a power response proportional to the Rate of Change of Frequency (ROCOF). This helps fix the loss of mechanical inertia in high-renewable grids. It does not replicate full Grid-Forming capability. However, it meaningfully improves system inertia at a fraction of the cost.
Seamless GFL-to-GFM Mode Switching
Some advanced PCS platforms can switch automatically between GFL mode (when the grid is strong) and GFM mode (when the grid is weak or islanded) — without interrupting power delivery. Consequently, this is particularly valuable for microgrids that are normally grid-connected but need to island on demand.
BESS Grid-Following in Virtual Power Plants (VPPs)
Aggregators are grouping multiple GFL BESS assets across different C&I sites into Virtual Power Plants (VPPs). These VPPs then bid collectively into grid service markets. Each site uses a standard BESS grid-following system. Furthermore, the master platform provides the scale needed to enter the market. According to BloombergNEF, VPPs incorporating GFL BESS are forecast to exceed 50 GW of virtual capacity globally by 2030.
13. Frequently Asked Questions About BESS Grid-Following
What does BESS grid-following mean?
BESS grid-following means the battery inverter synchronises its output to the existing grid voltage and frequency. Because of this, the battery follows the grid — it does not set the grid reference. This is the most common inverter control mode in battery storage today.
Can a GFL BESS provide backup power?
Yes — when paired with a Static Transfer Switch (STS). The STS transfers load from the utility to the BESS in 2 to 8 milliseconds, before the GFL inverter loses its voltage reference. As a result, critical loads experience no interruption. For more detail, see our guide on the STS.
What SCR is needed for BESS grid-following systems?
A minimum Short Circuit Ratio of 3 at the Point of Common Coupling is the standard engineering rule of thumb. Below SCR 2, a detailed stability analysis is mandatory. In addition, Grid-Forming inverters should be seriously considered for any site below SCR 2.
How fast does a BESS grid-following system respond to frequency events?
A modern GFL inverter with droop-based frequency response begins injecting power within 200 to 500 milliseconds of a frequency deviation. This qualifies for Fast Frequency Response (FFR) markets in most grid codes worldwide.
What battery chemistry does Sunlith Energy use for GFL BESS?
Sunlith Energy uses LFP (Lithium Iron Phosphate) chemistry as the primary choice for GFL BESS systems. NMC is also available for space-constrained applications. Contact our team to discuss your specific requirements.
What certifications apply to a BESS grid-following system?
Key certifications include UL 9540 (system level), UL 1973 (battery), UL 1741 (inverter), IEEE 1547 (interconnection), and IEC 62619 (safety). Grid code compliance requirements vary by jurisdiction. For a full breakdown, see our certifications guide.
14. Conclusion: Is BESS Grid-Following Right for Your Project?
BESS grid-following is not a compromise technology waiting to be replaced. Instead, it is the proven, cost-effective workhorse of the global energy storage industry. For the vast majority of C&I and utility-scale projects connected to strong grids, it remains the right choice — both technically and economically.
However, what separates a high-performing GFL system from an underperforming one is not the technology itself. Rather, it comes down to how the system is designed, integrated, and operated. Getting the PLL right. Sizing for end-of-warranty performance. Integrating an STS for backup power. Running a rigorous SCR analysis. Pairing the inverter with an EMS that stacks every available value stream.
At Sunlith Energy, we design complete BESS grid-following solutions engineered to perform — not just to specification on Day 1, but in the real world over the full project lifetime.
Most facility managers focus on battery capacity or inverter size when evaluating a BESS. However, one component quietly determines whether the whole system works as promised. That component is the Static Transfer Switch (STS). It is the device that makes power transitions invisible to your equipment — and your operations. In this guide, we cover how it works, where it fits, and why getting it right matters so much.
1. What Is a Static Transfer Switch (STS)?
A Static Transfer Switch is a solid-state device. It moves a facility’s electrical load from one power source to another. The key feature is speed — it completes the switch in just 2 to 8 milliseconds.
It uses Silicon-Controlled Rectifiers (SCRs), also called thyristors. These are semiconductor components with no moving parts. In fact, a standard Automatic Transfer Switch (ATS) takes 2 to 60 seconds to do the same job. As a result, the STS is the only device fast enough to protect truly sensitive industrial loads.
Furthermore, because there are no mechanical parts, the device lasts longer and needs less maintenance. For Sunlith Energy’s C&I BESS range, visit our C&I BESS blog. For technical standards, see IEC 62310: Static Transfer Systems.
How the Device Responds to a Grid Fault — Step by Step
The table below shows exactly what happens when the grid fails. Notice how quickly each stage moves.
Time
Event
What Happens
t = 0 ms
Grid fault starts
STS sensors detect the voltage anomaly right away.
t = 1–2 ms
Fault confirmed
The DSP controller validates the fault and aligns the BESS output phase.
t = 2–8 ms
Transfer fires
SCR thyristors switch the load to BESS. Critical loads feel nothing.
t = 8–20 ms
Island mode active
The facility runs as a microgrid. EMS takes over load dispatch.
Grid restore
Reconnection
STS checks utility stability, then reconnects smoothly and safely.
⚡ Key Performance Numbers to Know STS transfer time: 2–8 ms | Full electrical cycle: < 20 msEquipment hold-up time: 15–30 ms | Seamless switching window: ≤ 20 msIn short, loads never feel the switch happen. The STS acts well within the safety margin.
2. STS vs. ATS: Why the Speed Gap Is Decisive for C&I Sites
Many facilities already have an Automatic Transfer Switch installed. So why upgrade to an STS? The answer is speed — and what that speed means in practice.
According to NREL’s energy storage research, demand charges make up 30 to 70% of a typical C&I electricity bill. A single power interruption — even 50 ms — can reset demand charge windows. It can also trip relays and crash PLCs. Because of this, a 2-second ATS response simply is not good enough for sensitive loads.
In contrast, an STS acts in milliseconds. The equipment on the other side never registers the event. Moreover, the solid-state design means fewer service calls and a longer operational life over a 10-year BESS project.
3. Where the Static Transfer Switch Fits in a C&I BESS Architecture
A complete C&I BESS has several layers. Each layer has a specific job. Understanding them together makes the STS role much clearer.
Battery Cells LFP / NMC
→
BMS Safety & balancing
→
PCS / Inverter DC ↔ AC conversion
→
STS ★ Source switching
→
Critical Loads Factory / Building
The STS sits between the Power Conversion System and the facility’s loads. It acts as the gatekeeper. In real time, it decides whether the building draws from the grid or from the battery.
Normal Day-to-Day Operation
During normal operation, the facility draws from the grid. The battery charges during off-peak hours. Meanwhile, the STS monitors voltage, frequency, and phase angle continuously. It samples these thousands of times per second. The moment something goes wrong, it acts.
What Happens During a Grid Failure
When a fault is detected, the STS disconnects the facility from the utility. At the same time, it connects the PCS output from the battery. Because the PCS pre-synchronises with the grid, the switch is seamless. Subsequently, the facility becomes an independent microgrid. For more on microgrid design, see EPRI’s Microgrid Design Guidelines.
Reconnecting to the Grid After a Fault
Reconnection is just as important as the initial switch. The STS does not reconnect immediately when the grid returns. Instead, it first checks that voltage, frequency, and phase are all stable. Then it reconnects in a controlled way. This approach prevents inrush currents and protects equipment on both sides.
🔁 STS and PCS: A Critical Partnership The Static Transfer Switch (STS) and the Power Conversion System (PCS) work closely together.The PCS continuously tracks the grid phase angle. As a result, there is always a ready backup source.This coordination is precisely why the transfer happens in under 8 ms — the system anticipates rather than just reacts.
4. Six Key Applications of the Static Transfer SwitchThat Justify the Investment
The STS is not a single-use device. Instead, it enables several overlapping applications. Together, these stack financial and operational value. Sunlith Energy’s C&I BESS peak shaving guide explains how this stacking works in practice.
Seamless Backup via Static Transfer Switch
This is the primary use case. When the grid fails, the switch transfers load to the BESS in milliseconds. Production lines, cold rooms, and server racks stay online. There is no inrush and no restart. As a result, facilities avoid the costly downtime that slower systems cannot prevent.
Peak Shaving and Demand Charge Reduction
Demand charges often make up 30 to 70% of a C&I electricity bill. During peak demand windows, the BESS discharges through the STS. The transition is smooth and clean. In addition, combined with a smart Energy Management System, this can cut demand charges by 30 to 40%.
Microgrid Islanding for Energy Independence
Remote sites, mining operations, and campuses with resilience needs can use the STS to form a stable microgrid. The facility then operates independently when needed. For context on global adoption, see the IEA Batteries and Secure Energy Transitions Report.
Power Quality Protection Beyond Just Outages
Voltage sags and transients cause just as much damage as full outages. The STS responds to these events as well. Therefore, PLCs, variable-frequency drives, and precision equipment are all protected — not only from blackouts, but from brownouts too.
Solar and BESS Hybrid System Management
In solar and battery hybrid systems, the STS manages handoffs between solar, battery, and grid. Cloud cover and shading change output constantly. As a result, the facility always receives a clean, uninterrupted supply. See also: Commercial Solar Battery Integration Explained.
Demand Response and Grid Services Participation
Demand response programmes pay C&I sites to reduce grid load at peak times. Fast, reliable switching is what makes participation viable. Moreover, as Virtual Power Plants (VPPs) grow, the STS becomes a key asset for grid operators. Learn more at U.S. DOE Demand Response Resources.
5. How the Static Transfer Switch Multiplies BESS ROI
C&I BESS projects pay back fastest — typically in 3 to 5 years — when they capture several revenue streams at once. This is called value stacking. The Static Transfer Switch is the hardware that makes it safe to stack. Without it, transitions between sources carry risk. With it, the system manages them automatically. Read more: How C&I BESS Reduces Demand Charges.
Value Stack Enabled by STS Technology
Value Stream
Financial Impact
How the STS Enables It
Peak Shaving & Demand Charges
30–70% of C&I bill savings
STS prevents the spike that resets demand charge windows
Time-of-Use (TOU) Arbitrage
10–25% energy cost reduction
Smooth charge/discharge — no power quality events mid-transition
Backup & Business Continuity
Eliminates production stoppages
Sub-8ms switching makes backup truly uninterruptible
Grid Services & Demand Response
New utility revenue streams
Fast STS response meets utility programme requirements
Solar + BESS Self-Consumption
Maximises renewable output
STS manages PV → BESS → Grid priority without any glitch
“A facility with a 5 MW / 10 MWh BESS and correctly integrated STS cut demand charges by 35%. They also recovered the full investment within four years — and eliminated production stoppages caused by grid instability.”
6. Sizing and Selecting the Right Unit for Your C&I Project
The unit must handle the facility’s maximum continuous load current. It also needs headroom for motor start inrush. Common C&I ratings run from 200A to 1,800A per unit. Larger systems use units in parallel.
Voltage Class and Point of Interconnection
Most C&I BESS systems run at low voltage — 400V or 480V three-phase. However, larger industrial sites may need medium-voltage units. Always match the voltage class to the point of interconnection in your single-line diagram.
4-Pole vs. 3-Pole: Neutral Switching Options
Facilities with sensitive grounding schemes may need 4-pole designs. For example, sites with TN-S grounding or medical-grade loads often require independent neutral switching. This detail is easy to overlook but important to get right.
Matching Unit Size to PCS Output
For high-power C&I systems above 40 kW, the STS is a standalone unit. It must match or exceed the PCS output capacity. For smaller systems, integrated designs within the PCS simplify installation and reduce wiring complexity.
📐 Sunlith Energy’s Sizing Methodology We start with a detailed load profile analysis.We then assess maximum demand, critical load share, motor inrush factors, and grounding topology.Consequently, the STS is sized to handle the worst-case scenario — not just the average.Contact us at sunlithenergy.com for a free technical consultation.
7. Common Deployment Pitfalls — and How to Avoid Them
Even a well-specified STS can underperform if deployed incorrectly. Based on Sunlith Energy’s project experience, these are the most common mistakes.
Pre-synchronisation is non-negotiable. The STS can only switch cleanly if both sources share phase. The PCS must run in grid-following mode at all times. If it does not, the transfer causes an inrush event instead of preventing one.
Segregate critical loads before installation. The STS should protect only the most important loads — not the whole building. Separating critical circuits from non-critical ones (lighting, HVAC) reduces required battery capacity and extends runtime on backup.
Coordinate with upstream protection devices. The switching event must work in harmony with upstream breakers. Without coordination, you risk nuisance tripping. Always conduct arc flash and protection studies before commissioning.
Secure the control interface. Modern STS units are network-connected. In facilities with OT networks, this interface must be hardened against unauthorised access. See NIST SP 800-82: Guide to ICS Security for best practices.
Always test under real load conditions. Every installation should complete a full transfer test under load before going live. Both Factory Acceptance Testing (FAT) and Site Acceptance Testing (SAT) must be documented.
8. What Is Next? Emerging Trends in Switching Technology
The STS is evolving quickly. Modern units do much more than react to faults. Instead, they are becoming intelligent grid-edge devices. Several trends are shaping this shift, as tracked by BloombergNEF Energy Storage Outlook and Wood Mackenzie BESS Forecasts.
EMS Integration: Next-generation units communicate with the EMS via Modbus, IEC 61850, or DNP3. As a result, switching is coordinated — not merely reactive.
Power Quality Analytics: Advanced firmware logs voltage sags, harmonics, and transients continuously. This data helps justify BESS investments to finance teams with hard evidence.
VPP Participation: As Virtual Power Plants scale up, the STS becomes a key dispatchable endpoint. Grid operators can use it for frequency support and demand flexibility.
Modular, Scalable Designs: Rack-mounted modular units let facilities start small and scale up. Consequently, the barrier of large upfront capital for a full-rated unit is removed.
AI-Assisted Predictive Switching: Emerging platforms use machine-learning to anticipate grid instability. Therefore, the system pre-positions itself before a fault occurs — rather than reacting after the fact.
9. Frequently Asked Questions About the Static Transfer Switch
What is the main job of a Static Transfer Switch (STS) in a battery storage system?
Its job is to transfer the load from the grid to the battery in under 8 milliseconds. This protects critical equipment from any power interruption. Without it, the BESS cannot respond fast enough to be genuinely uninterruptible.
How does it compare to a standard ATS in speed?
A standard ATS takes 2 to 60 seconds to switch. In contrast, the STS does it in 2 to 8 milliseconds. That difference is the gap between seamless protection and a disruptive outage.
Is it necessary for every C&I battery project?
Not necessarily. For non-critical backup, an ATS can be enough. However, any site with sensitive loads — manufacturing, cold chain, data, or healthcare — needs this level of protection. In short, if downtime is expensive, you need it.
Where do I get one for my project?
Sunlith Energy designs and deploys complete C&I BESS systems with STS integration included. Contact our team to discuss your site requirements.
10. Conclusion: Why the Static Transfer Switch Makes or Breaks Your BESS
To sum up, this device is what separates a reliable C&I BESS from an unreliable one. Peak shaving, islanding, demand response, and renewable integration all depend on clean, fast source switching. Without proper switching technology, the gaps between sources carry risk. With it, transitions are invisible.
At Sunlith Energy, we treat Static Transfer Switch (STS) integration as a first-class engineering task. We size it correctly, coordinate it with upstream protection, and test it under real load conditions before handover.
The grid is becoming less predictable. Energy costs continue to rise. Facilities that invest in the right switching technology today will have a real operational advantage tomorrow. Talk to the Sunlith Energy team to get started.
Your electricity bill has two main parts. One charges you for how much energy you use. The other — the demand charge — charges you for how fast you use it.
In fact, this fee can make up 30–70% of a commercial electricity bill. However, most business owners have never had it explained clearly.
In this guide, you will learn what a demand charge is, why it is so expensive, and how to reduce it — in India and globally.
What Is a Demand Charge?
A demand charge is a monthly fee based on the highest amount of power your business draws at any single point during the billing period.
Utilities measure your power use every 15 minutes. The single highest reading — in kilowatts (kW) — sets this fee for the whole month.
Think of it this way. Imagine a highway toll based on your fastest speed — not total distance. Even if you hit that speed just once, you pay the premium for the whole trip.
That means cutting total energy use will not lower this cost alone. You need to control your power peaks.
Energy Charge vs Demand Charge
Most electricity bills have two main cost components. It helps to understand both.
Energy Charge
Demand Charge
Measures
Total kWh used over the month
Highest kW in any 15-min window
Analogy
Total distance driven
Fastest speed driven
Bill share
30–60%
30–70%
How to cut
Use less electricity overall
Flatten or avoid power spikes
As a result, these two costs need very different solutions. Switching off lights helps with energy charges. However, to cut the peak-based fee, you need to manage power spikes directly.
A single 15-minute spike sets your demand charge for the entire month.
Why Is a Demand Charge So Expensive?
Utilities apply a demand charge to recover the cost of grid infrastructure. They must build enough capacity to serve your worst-case power need — even if that peak happens just once.
For example, if your factory peaks at 800 kW for 15 minutes, the utility must maintain cables, transformers, and substations capable of delivering 800 kW. That infrastructure is expensive.
Because of this, you pay for that capacity all month — even if you never spike again. One bad moment on one day sets your cost for 30 days.
A Simple Cost Example
Global Example A factory peaks at 600 kW. The utility charges $12/kW per month. Monthly fee = 600 x $12 = $7,200. If the factory had kept its peak to 400 kW, it would save $2,400 every single month.
India Example — Maharashtra (MSEDCL) A factory has a contracted Maximum Demand of 500 kVA. The DISCOM charges Rs 350/kVA/month. Monthly MD charge = 500 x Rs 350 = Rs 1,75,000. If the factory exceeds 500 kVA even once, a penalty of 1.5x to 2x applies on the excess.
How Demand Charges Work in India
In India, this fee appears as a Maximum Demand (MD) charge on bills from state DISCOMs. The rules are similar to global practice. However, the Indian tariff system has some unique features businesses should know.
Contracted MD and the Minimum Billing Rule
When you apply for a commercial or industrial electricity connection, you declare a contracted MD. This is the peak power level you expect to draw.
Importantly, many DISCOMs charge you for the higher of your actual peak or 75–85% of your contracted MD. As a result, businesses often pay for capacity they never use.
Penalties for Exceeding Contracted MD
If your actual peak goes above your contracted MD, a penalty applies. It is typically 1.5x to 2x the standard MD rate for the excess amount.
In addition, many states now have Time of Day (ToD) tariffs. These apply higher rates during peak grid hours — usually 6 PM to 10 PM. So a spike during that window costs even more.
State Rates Vary Across India Maharashtra (MSEDCL) charges in Rs/kVA/month with ToD multipliers. Gujarat (UGVCL/DGVCL) has separate peak and off-peak rates. Tamil Nadu (TANGEDCO) uses seasonal adjustments. Always check your state DISCOM’s latest tariff order for current figures.
Which Industries Are Affected Most?
In fact, this cost affects almost all commercial and industrial users. However, some sectors feel the impact more than others.
Industry
Typical Share of Bill
Main Cause of Peaks
Data Centers
50–70%
Sudden cooling surges and continuous high loads
Manufacturing
40–60%
Heavy machinery startups during shift changes
Hospitals
30–50%
24/7 operations with imaging and HVAC spikes
Cold Storage
35–55%
Compressor cycles causing frequent short peaks
Retail / Malls
25–40%
HVAC and lighting peaks during business hours
Offices
20–35%
Morning startup and afternoon cooling peaks
Therefore, businesses in these sectors have the most to gain from actively managing their peak power use.
How to Reduce Demand Charges for Your Business
There are three proven ways to reduce this cost. Most businesses get the best results by combining two or more of them.
1. Peak Shaving with Battery Storage
Peak shaving is the most effective way to cut a demand charge. A Battery Energy Storage System (BESS) charges during quiet periods. It then discharges automatically during power peaks. As a result, it flattens your load curve and lowers your recorded peak kW.
A well-sized BESS can reduce this fee by 20–40%. Payback periods are typically 4–6 years.
How a BESS system flattens peak demand and reduces your monthly demand charge.
2. Load Shifting to Off-Peak Hours
Load shifting means moving energy-heavy tasks — like production runs or EV charging — to off-peak hours. This avoids creating spikes during the window that sets your monthly peak.
However, load shifting alone is less powerful than battery storage. It works best as a low-cost first step, or combined with BESS.
Solar panels alone have limited impact on this fee. Peaks often occur in early morning or evening — outside solar generation hours.
On the other hand, solar combined with a BESS works very well. The battery stores solar energy during the day. It then discharges during peak windows at any time of day.
Q: Is a demand charge the same as an energy charge?
A: No. An energy charge is based on total kWh consumed. A demand charge is based on your highest kW in any 15-minute window. You could use little energy overall but still face a high fee if you had one large power spike.
Q: Can a small business be affected by this fee?
A: Yes. Many utilities — including Indian DISCOMs — apply it to businesses above a threshold, sometimes as low as 10–20 kW. Check your bill or tariff category to confirm whether MD charges apply to your connection.
Q: How is the demand charge calculated in India?
A: In India, DISCOMs apply MD charges in Rs/kVA or Rs/kW per month. If your actual peak exceeds your contracted MD, a penalty of 1.5x to 2x the MD rate typically applies on the excess. Rates vary by state and tariff category.
Q: What is the fastest way to reduce this cost?
A: The fastest and most effective method is peak shaving using a BESS. It discharges during peak windows, flattening your load curve automatically. Combined with solar and load shifting, most C&I businesses can save 30–50% on this fee.
Q: Do solar panels help reduce a demand charge?
A: Solar panels alone have limited impact because peaks often fall outside solar hours. However, solar combined with a BESS is very effective. The battery stores solar energy and releases it during peaks — at any time of day.
Sources and Further Reading
The data and benchmarks in this article are drawn from:
A demand charge is one of the biggest hidden costs in any commercial electricity bill. One 15-minute spike can set your fee for the entire month — in India and globally.
However, this cost is manageable. With battery storage, load shifting, and solar, most businesses can cut it significantly.
The first step is understanding what drives the spike. The second is acting on it.
Sunlith Energy installs custom C&I battery storage systems across India to help businesses cut demand charges.
Ready to Cut Your Demand Charges? Sunlith Energy designs custom C&I battery storage systems for businesses across India. Get a free demand charge analysis and find out exactly how much your facility could save. Talk to an expert today.
C&I BESS case studies provide powerful proof of how energy storage systems deliver measurable benefits in commercial and industrial settings. By examining successful deployments, businesses can see real-world evidence of cost savings, resilience improvements, and renewable energy integration. This article showcases real-life examples across industries, linking back to applications of BESS and the economic benefits of deployment.
Case Study 1: Retail Chain Cuts Energy Costs with Peak Shaving
A large retail chain in the U.S. adopted a C&I BESS to manage demand charges. By reducing peak load, the business cut electricity expenses by 18% annually. The system also provided backup power during outages, improving reliability.
Key Outcome: Cost savings + resilience.
Case Study 2: Manufacturing Plant Improves Power Quality
An industrial manufacturer in Germany faced frequent voltage fluctuations, disrupting operations. A 5 MWh BESS was deployed to stabilize the grid connection and smooth load profiles. The plant saw reduced downtime and higher operational efficiency.
Key Outcome: Enhanced power quality + productivity.
Case Study 3: Data Center Achieves 24/7 Uptime
Data centers require uninterrupted power. A Singapore-based data center installed a C&I BESS as part of its microgrid. The system ensured seamless switchover during grid disturbances, protecting sensitive equipment and avoiding costly downtime.
Key Outcome: Reliability + continuous operations.
Case Study 4: Winery Integrates Solar with Storage
Case Study 5: Hospital Increases Energy Resilience
Hospitals must prioritize uninterrupted energy supply. A hospital in Australia deployed BESS alongside diesel generators. The hybrid system provided critical backup, reduced fuel costs, and aligned with green initiatives.
Key Outcome: Energy security + reduced emissions.
Lessons Learned from C&I BESS Case Studies
Across these case studies, common success factors emerge:
Peak shaving and demand charge reduction directly improve the bottom line.
Improved resilience and power quality safeguard operations.
Integration with renewables aligns with sustainability and ESG goals.
Scalability and flexibility make BESS suitable across diverse industries.
Conclusion
Real-world C&I BESS case studies demonstrate the versatility and value of energy storage. From retail and manufacturing to data centers and healthcare, businesses are achieving cost savings, operational resilience, and sustainable energy strategies. Companies evaluating storage can learn from these successes and explore how C&I BESS can strengthen their operations.
C&I BESS peak shaving is rapidly becoming one of the most effective strategies for commercial and industrial (C&I) facilities to lower electricity costs. By leveraging battery energy storage systems (BESS), businesses can reduce demand charges, optimize energy usage, and unlock significant long-term savings.
Understanding Demand Charges
Demand charges are fees utilities impose based on the highest level of electricity a facility consumes during a billing cycle. For businesses with large equipment or fluctuating energy needs, these charges often make up 30–70% of total electricity bills.
How Peak Shaving Works with C&I BESS
Monitoring Usage: Smart systems track real-time energy demand.
Battery Discharge: During peak load times, stored energy is released to reduce grid reliance.
Lower Peak Demand: Utilities see a reduced maximum load, leading to lower demand charges.
This process allows companies to maintain operations while avoiding costly spikes in utility bills.
Improved Energy Reliability during high-demand periods.
Optimized Equipment Usage by reducing grid strain.
Increased Flexibility for energy-intensive operations.
👉 Learn more about the broader Benefits of C&I BESS, including resilience and sustainability.
Case Example: Peak Shaving in Manufacturing
A large manufacturing facility with heavy machinery faced monthly demand charges of over $50,000. By installing a 5 MW / 10 MWh C&I BESS, the facility:
Cut demand charges by 35%.
Saved over $500,000 annually.
Recovered the investment within 4 years.
Future Outlook: Peak Shaving as a Business Imperative
As electricity rates rise and utilities implement more time-based pricing, C&I BESS peak shaving will shift from an optional strategy to a business necessity. Companies adopting this approach early will gain a competitive advantage in cost control and sustainability goals.
Conclusion
C&I BESS peak shaving is a proven solution to reduce demand charges, optimize energy use, and drive long-term savings. For businesses in manufacturing, retail, healthcare, or data centers, investing in battery storage is not just about energy—it’s about financial resilience and operational efficiency.