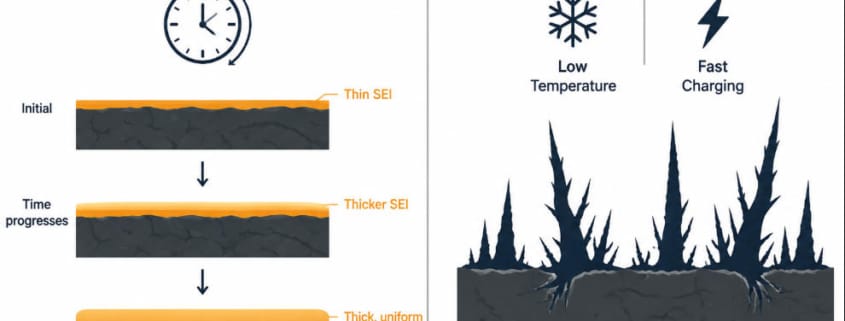
Every LFP cell carries two chemistry problems that quietly shape its whole life. Together, these two problems make up SEI layer growth and lithium plating, the pairing this whole guide covers. First, one is slow and mostly unavoidable. Then the other is fast and mostly preventable. So understanding how each one works is the difference between managing degradation and just watching it happen.
So this guide explains both mechanisms from the ground up. First, it covers what the SEI layer actually is and why it keeps growing. Then it covers how lithium plating happens, and why it is so much more damaging. Along the way, it links to the operating guidance that follows from the chemistry.
Quick Answer SEI layer growth is the slow, ongoing thickening of a protective film on the anode, driven mainly by time and high state of charge. Lithium plating is the sudden deposit of metallic lithium on the anode surface, triggered by fast charging in cold conditions. SEI growth is a normal aging process. Lithium plating is largely avoidable damage.
SEI Layer Growth: What the Film Actually Is
Every lithium-ion cell forms a thin film on the anode surface early in its life. Understanding SEI layer growth and lithium plating starts here, with this first film. That film is the solid electrolyte interphase, or SEI. It is not a flaw. Instead, it is a necessary part of how the cell works at all.
The SEI forms when electrolyte comes into contact with the anode and partially decomposes. That reaction consumes a small amount of lithium and electrolyte. But in exchange, it builds a protective layer. This layer lets lithium ions pass through while blocking further direct contact between the anode and electrolyte. Without it, the electrolyte would keep breaking down uncontrollably.
So a stable SEI is good news, up to a point. It settles into a thin, mostly fixed layer during the cell’s first few cycles. That initial formation consumes some capacity, which is normal and expected. Manufacturers account for it before the cell ever reaches a customer.
SEI Layer Growth: Why It Keeps Going After That
Here is the problem. But the SEI does not stay fixed forever. Instead, it keeps growing, slowly, for the entire life of the cell. Each time it thickens, it consumes a little more lithium and electrolyte. That lithium never comes back.
Two conditions speed this up. State of charge is the biggest one. Then temperature is close behind. A cell held at high state of charge sees faster SEI growth than one kept in a mid-range window. This is especially true near 100%. Heat accelerates the same underlying chemical reactions too. A hot cell ages faster than a cool one, even at the same state of charge.
This slow growth is exactly what shows up as calendar aging at the system level. It is the quiet, background half of SEI layer growth and lithium plating. For the full picture on how SEI growth connects to calendar and cycle aging together, see our guide on Calendar Aging vs Cycle Aging in LFP Batteries. It covers the aging side of SEI layer growth and lithium plating in more depth.
The growing SEI layer also raises internal resistance. Instead, lithium ions have to pass through a thicker barrier to reach the anode. That barrier resists ion flow more with every passing month. This is why aging cells run measurably hotter and less efficiently than new ones. This shows up even before capacity loss becomes obvious.
Lithium Plating: What It Actually Is
Lithium plating is a different problem entirely, and a more dangerous one. Of the two halves of SEI layer growth and lithium plating, this is the fast, event-driven one. Instead of lithium ions intercalating cleanly into the anode’s graphite structure, they deposit on the surface as metallic lithium. That metallic lithium does not behave like the lithium safely stored inside the graphite. Much of it becomes permanently unusable.
Two conditions push a cell toward that threshold. First, fast charging is one. Then cold temperature is the other, and the two compound each other badly. Cold slows lithium-ion mobility inside the electrolyte and the anode. The same charge current that is safe at room temperature can trigger plating in the cold. This risk kicks in once the cell drops below roughly 0°C. That is why charging below freezing gets treated as a hard BMS cutoff on LFP systems. It is not just a soft warning.
SEI Layer Growth vs Lithium Plating: Why One Is So Much Worse
SEI growth is slow and largely unavoidable. But lithium plating is different on both counts. This contrast is the core of why SEI layer growth and lithium plating get treated so differently in BMS design.
First, plated lithium is mostly unrecoverable. Once metallic lithium deposits on the anode surface, only a portion of it can re-intercalate on the next discharge. The rest becomes what researchers call dead lithium, permanently disconnected from the working electrochemistry. Every plating event removes real capacity that never returns.
Second, plating creates a safety risk that SEI growth does not. Repeated plating can build up as dendrites, needle-like structures that grow with each cycle. In the worst case, a dendrite can pierce the separator between the anode and cathode. That can cause an internal short circuit. This is why lithium plating gets treated as a hard safety limit in BMS design. It is not just a performance concern.
Third, plated lithium accelerates SEI growth on top of everything else. Fresh metallic lithium is highly reactive with the electrolyte. It forms its own new SEI layer directly on the plated lithium. That consumes even more lithium and electrolyte than normal SEI growth alone would. One plating event can trigger a small cascade of additional degradation beyond the initial capacity loss.
How SEI Layer Growth and Lithium Plating Interact
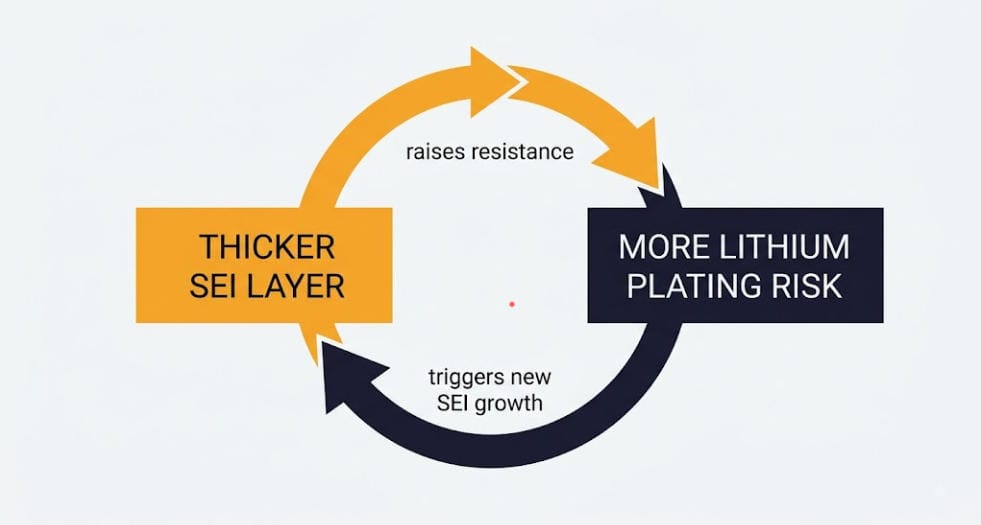
SEI layer growth and lithium plating are not fully separate stories. Instead, they feed into each other in both directions.
A thick, resistive SEI layer makes plating more likely at a given charge rate. As the SEI grows over a cell’s life, it adds resistance the charging current has to overcome. An older cell with a thicker SEI can start plating sooner. Charge rates and temperatures that were once safe stop being safe. This is one reason charge current limits often get more conservative as a system ages. It is not just a fixed spec on day one.
In the other direction, any lithium plating event accelerates SEI growth, as covered above. A single cold-weather charging mistake does not just cost the plated capacity directly. It also leaves behind a thicker SEI layer that keeps consuming a little more capacity on every cycle afterward.
This two-way relationship is part of why temperature management matters so much for LFP systems overall. It is the practical payoff of understanding SEI layer growth and lithium plating together, not as two unrelated topics. For the operational side of managing SEI layer growth and lithium plating, including BMS charge cutoffs and derating strategies, see our guides on Charging Temperature and Battery Datasheets and BESS C-Rate Explained. Still, both cover how real systems protect against plating in the field.
SEI Layer Growth and Lithium Plating: Detecting Damage Before It Spreads
Lithium plating does not always announce itself obviously in real time. That makes prevention more important than detection. Still, a few signals can flag it after the fact.
A sudden, disproportionate capacity drop following a cold-weather fast charge is one warning sign. So is a voltage plateau or dip during the charge itself. Either one can signal the anode potential crossing into plating territory. Post-mortem analysis using incremental capacity analysis can also reveal plating-related changes in a cell’s charge curve. These changes look distinct from the gradual shifts caused by ordinary SEI growth and cycle aging.
For the full detail on incremental capacity analysis and other degradation-tracking methods, see our guide on Advanced SOH Estimation for BESS. It covers how operators track these effects in a live system.
SEI Layer Growth and Lithium Plating: Practical Takeaways for BESS Operators
None of this SEI layer growth and lithium plating chemistry requires a battery science degree to manage well. A few operating habits cover most of the risk.
Keep resting state of charge out of the high extreme when possible, since that slows SEI growth directly. Respect temperature-based charge cutoffs strictly, especially near freezing, since that is the single biggest lever against plating. Avoid unnecessarily aggressive fast charging in cold weather, even when a system technically allows it. Allowed and optimal are not the same thing. Also, expect charge limits to tighten somewhat as a system ages. A thicker SEI layer genuinely does lower the safe charging threshold over time.
No. It continues for the entire life of the cell, though the rate slows somewhat after the initial formation period. It never fully stops.
Can lithium plating be reversed?
Mostly no. A portion of plated lithium can re-intercalate on the next discharge. But the rest becomes permanently disconnected dead lithium. Prevention is far more effective than any recovery after the fact.
Why is lithium plating worse in cold weather specifically?
Cold temperatures slow lithium-ion mobility. This happens in both the electrolyte and the anode. That makes it harder for ions to intercalate quickly. The anode potential gets pushed toward the threshold where plating occurs instead.
Does a thicker SEI layer make lithium plating more likely?
Yes. A thicker, more resistive SEI layer adds to the overpotential during charging. That can push an aging cell toward plating conditions at charge rates that were once safe.
Every BESS needs a trustworthy answer to one question. How much capacity is left? That answer is state of health, or SOH. So what advanced SOH estimation BESS platforms rely on goes well beyond those basics. Instead, it moves past simple counting into methods that update continuously and catch what simpler tools miss.
Still, the basics matter too. Capacity counting, incremental capacity analysis, and resistance tracking cover the fundamentals well elsewhere. So this guide picks up where those leave off. Instead, it focuses on the model-based and data-driven methods that power modern, production-grade BMS platforms.
Quick Answer Advanced SOH estimation for a BESS relies mainly on two approaches. Model-based methods, led by the Extended Kalman Filter, combine a battery model with real-time data to estimate SOH continuously. Data-driven methods train on historical data to predict SOH directly from patterns. Most production systems layer these with basic methods rather than using either alone.
Why Basic Methods Fall Short: The Case for Advanced SOH Estimation BESS Tools
Capacity counting is accurate. But it takes the asset offline for hours. Incremental capacity analysis needs slow, steady charge rates. A hard-cycling BESS rarely gets those conditions. Resistance tracking is fast. But it does not always move in step with capacity fade.
So each basic method has a real gap that advanced SOH estimation BESS tools are built to fill. First, it runs continuously. Then, it does not need a dedicated test cycle. Also, it can fuse multiple weak signals into one stronger estimate.
For the full detail on capacity counting, incremental capacity analysis, and resistance-based tracking, see our guide on BMS Algorithms Explained. It covers those foundational methods in depth. Our guide on DCIR and BESS Performance covers resistance-based tracking specifically. So the rest of this guide builds on that foundation.
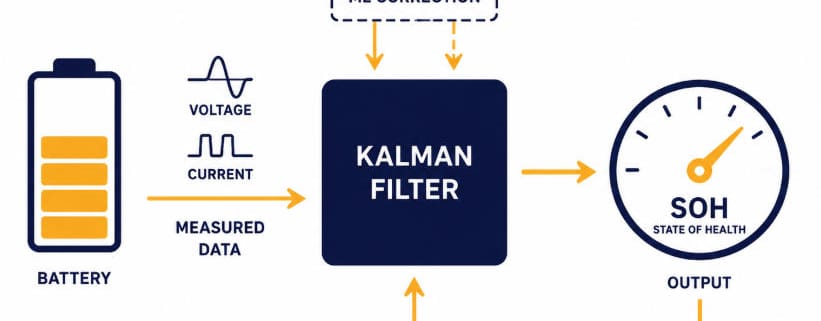
Model-based methods take a different approach entirely. Instead of measuring capacity directly, they combine a mathematical battery model with real-time voltage and current data. Then SOH comes out as one of several hidden values inside that model.
The Extended Kalman Filter, or EKF, is the most common tool here. So it treats SOH as a state that evolves slowly over time. Then SOC, by contrast, is a state that evolves quickly. So both get updated together as new voltage and current readings arrive. This is the core mechanism behind what advanced SOH estimation BESS platforms rely on for continuous tracking. No dedicated test cycle is needed at all.
So this is where advanced SOH estimation BESS platforms really separate from basic tracking altogether. Instead, an EKF does not wait for a full cycle or a clean charge curve. So it updates with every new data point, all day, every day. So that is a fundamentally different operating mode than periodic testing.
Still, the catch is model dependency. An EKF is only as good as the battery model feeding it. A model that misses LFP’s flat voltage curve and hysteresis will shake. Its SOH estimate will wobble too. This is the same modeling challenge that shows up in SOC estimation too. See our guide on BMS SOC Estimation Methods Explained for the deeper dive. The underlying model quality issue is shared between SOC and SOH filtering.
Kalman Filter Variants Worth Knowing
Beyond the standard EKF, several variants push accuracy further still. First, the Unscented Kalman Filter handles the battery’s nonlinear behavior more directly, at higher computational cost. Dual and joint Kalman filters estimate SOC and SOH together, side by side. Each one helps the other. They do not run as separate, disconnected calculations. Adaptive Kalman filters go further still. They adjust their own noise settings as the battery ages. So the filter does not quietly get worse as the cell drifts from its original model.
Advanced SOH Estimation BESS Method: Data-Driven and Machine Learning
How Data-Driven SOH Estimation Works
The newest category skips chemistry modeling almost entirely. So this data-driven approach is a growing part of advanced SOH estimation that BESS platforms increasingly adopt as fleets scale up. Instead, a data-driven system trains on historical voltage, current, resistance, and temperature data. It learns to predict SOH straight from patterns in that data. No engineer needs to hand-build the physics behind it.
Still, these methods can be very accurate once trained on enough data from similar cells. Some published results report SOH prediction errors under 1%. But they carry a real cost. So training requires a large, representative dataset covering realistic aging conditions. A model trained on one usage pattern may not work on a very different one. So data-driven methods work well for fleet-scale operators with lots of historical data. They work less well for a single small system starting from scratch.
Common Model Types
So a few model types show up again and again in this space. Neural networks handle battery data well, since it comes in sequence. Recurrent architectures like LSTMs work especially well here, since today’s SOH depends heavily on yesterday’s usage pattern. Then gradient-boosted tree models offer a lighter option. They need less training data, at some cost to peak accuracy. Gaussian process regression adds something useful. It gives a confidence range around each prediction. That matters for operators who need more than just a number. They need to know how much to trust it.
So hybrid approaches are increasingly common as a middle ground here too. A model might combine a physics-based EKF core with a machine learning correction layer. Then that layer is trained to catch what the physics model misses. So this blends two strengths. It keeps the clarity of model-based methods, and it gains some of the accuracy of data-driven ones. So for many fleet operators, this hybrid path offers the best of both without committing fully to either extreme.
How Advanced SOH Estimation Layers with the Basics in a Real BMS
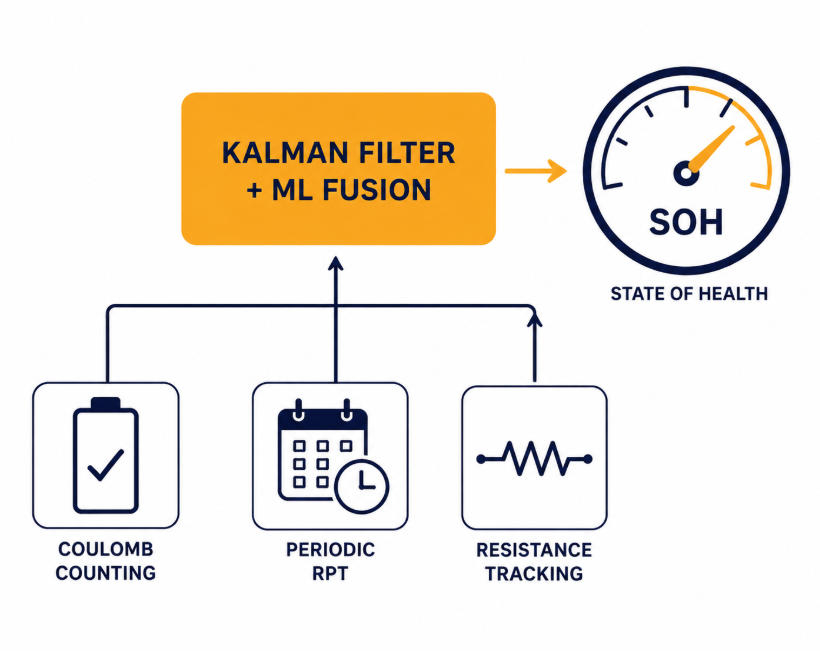
So no single advanced SOH estimation BESS method covers every need on its own. Real BMS platforms typically layer several of these together, basic and advanced alike.
Coulomb counting runs continuously in the background. It is cheap, and it is always available. Periodic Reference Performance Tests reset the drift that coulomb counting accumulates over time. Resistance tracking via pulse tests adds a second, faster signal between full tests. Then a Kalman filter or similar model-based layer fuses all of that input together. Often, a machine learning correction sits on top. The result is one continuously updated SOH number the operator can actually act on.
This is the real payoff of advanced SOH estimation that BESS teams invest in. First, it is not about replacing the basics. Instead, it is about fusing them into something more reliable than any single input alone. The Kalman filter or ML layer acts as the integration point. It weighs each incoming signal by how much it should be trusted at that moment.
This layered approach connects directly to the Equivalent Full Cycle concept. That concept is used to separate calendar and cycle aging in field data. Both concepts feed the same underlying goal. That goal is a trustworthy, continuously updated picture of how much life a BESS has left. For more on how EFC-based tracking fits into the bigger degradation picture, see our guide on Calendar Aging vs Cycle Aging in LFP Batteries. It covers the full framework.
Reporting and Version Drift in Advanced SOH Systems
Still, however sophisticated the method, reporting matters as much as the calculation itself. A single SOH number without context can mislead. Is it a raw Kalman filter output, an ML prediction, or a blend of both? Was it measured fresh off a full Reference Performance Test, or purely interpolated by a model between tests? Advanced SOH estimation BESS dashboards that surface this context help operators trust the number instead of just reading it.
So version drift is a real risk for advanced SOH estimation BESS platforms running model-based and ML systems specifically. If a BMS updates its underlying model, the SOH number can jump. This holds true even when the battery itself has not changed. So it helps to log which method and model version produced each SOH reading, not just the number alone. That log becomes valuable later. It matters most when comparing degradation trends across a fleet of systems built at different times.
Choosing the Right Advanced SOH Estimation BESS Approach
The right level of advanced SOH estimation that BESS operators actually need depends on two things. System size is one. How the asset gets used is the other. A small residential or commercial system may get by fine with basic coulomb counting. Occasional full-capacity tests can fill the gap. Model-based methods can wait.
A large utility-scale asset generating revenue around the clock is a different story. It needs more from advanced SOH estimation BESS platforms. There, the added complexity of a full Kalman-filter or hybrid ML approach usually pays off. Even small SOH estimation errors translate into real dispatch and warranty costs at that scale. Fleet operators with many similar systems get the most value from data-driven methods. They have the training data those methods need to perform well.
Whatever the advanced SOH estimation BESS approach is chosen, the underlying goal stays the same. Accurate SOH tracking is what turns raw degradation into something an operator can actually plan around. For the broader mechanisms behind that degradation, see our guide on Battery Degradation in BESS: Causes, Mechanisms & Mitigation. It lays out the full picture.
Advanced SOH Estimation Methods: Quick Comparison
Method
Speed
Accuracy
Best Fit
Kalman filter (EKF/UKF)
Continuous
High, if model is accurate
Real-time production systems
Dual/adaptive Kalman filter
Continuous
Higher, self-corrects over time
Long-life assets with aging models
Neural network / LSTM
Continuous
High, with enough training data
Fleet-scale operators with data
Gaussian process regression
Continuous
High, with confidence intervals
Operators needing uncertainty estimates
Hybrid physics + ML
Continuous
Highest, blends both strengths
Large fleets wanting best-in-class accuracy
Frequently Asked Questions
What is the most accurate advanced SOH estimation BESS method available?
No single method wins universally. Hybrid approaches often report the best accuracy. They combine a physics-based Kalman filter with a machine learning correction layer. That combination captures known battery physics and the patterns pure physics models miss.
Do I need machine learning for SOH estimation, or is a Kalman filter enough?
For most single-site systems, a well-tuned Kalman filter is enough. Machine learning methods earn their added complexity mainly at fleet scale. That is where enough historical data exists to train a model well.
Why does a Kalman filter sometimes perform worse than simple coulomb counting?
So this happens when the underlying battery model is poorly calibrated. An EKF is only as good as the model feeding it. So a mismatched model can produce worse results than a simple, well-calibrated basic method.
Does advanced SOH estimation replace basic methods like coulomb counting in a BESS?
No. Advanced methods almost always layer on top of basic ones instead of replacing them. They fuse coulomb counting, periodic tests, and resistance signals into one stronger estimate.
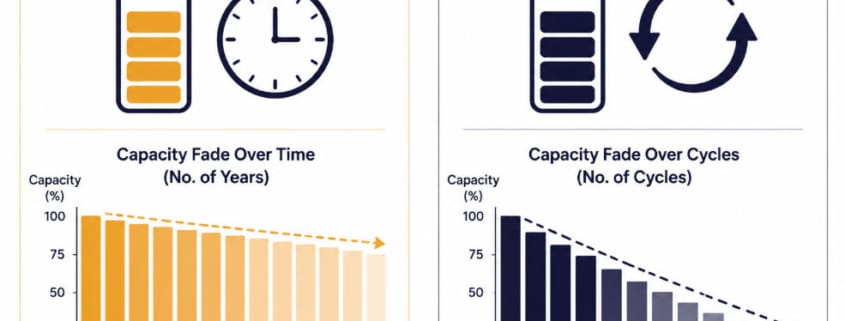
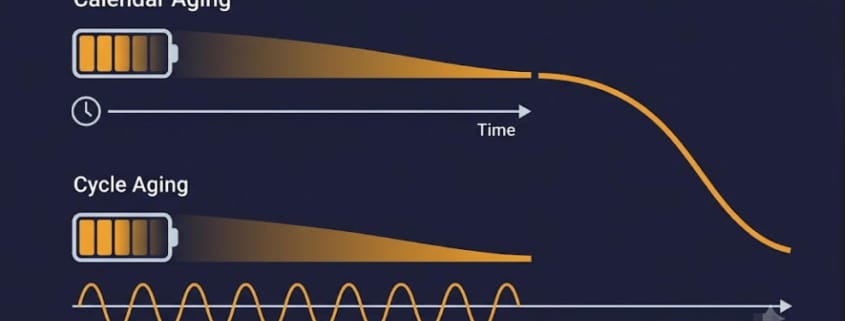
Every LFP battery in a BESS ages through two processes at once. One happens with the clock. The other happens with use. So calendar aging vs cycle aging is not really an either/or question. Also, both run all the time, and their effects stack together. Still, telling them apart matters. Still, each one responds to a different set of operating choices.
So this guide breaks calendar aging vs cycle aging down piece by piece, mechanism by mechanism. First, it covers what each process is on its own. Then it covers how the two interact in a real system. Finally, it covers how BESS operators separate the two in field data, since that is where the theory becomes useful.
Quick Answer Calendar aging is time-based capacity loss that happens even when a battery is idle, driven mainly by state of charge and temperature. Cycle aging is use-based capacity loss driven by charge and discharge throughput, depth of discharge, and C-rate. Both processes run at once in a working BESS, and total degradation is roughly the sum of the two.
Calendar Aging vs Cycle Aging: What Calendar Aging Is
Calendar aging is capacity loss that happens purely with time. So it keeps going whether the battery is cycling, sitting idle, or somewhere in between. Think of it as a background process running underneath everything else.
The root mechanism is growth of the solid electrolyte interphase, or SEI layer, on the anode. So this layer forms naturally, and it even serves a protective role at first. But it keeps growing slowly for the life of the cell. Then each time it thickens, it consumes lithium and electrolyte. That lithium never comes back.
So two variables drive how fast this happens. State of charge is the biggest one. Then temperature is close behind. A cell parked at high state of charge ages faster at rest than one held in a mid-range window. This is especially true near 100%. So does a cell sitting in a hot enclosure compared to a cool one.
So research backs this up clearly. A 2025 study on LFP pouch cells backs this up. It found that calendar aging is strongly governed by state of charge and temperature together. So higher values of either sped up capacity fade through faster SEI growth. Pressure, by contrast, had almost no measurable effect. Interestingly, the same study found something less obvious. Still, cells stored at 50% state of charge showed the largest rise in direct current resistance. This held true once they reached a given state of health, even though their capacity fade was not always the fastest. So that is a reminder that calendar aging vs cycle aging does not always degrade capacity and resistance in lockstep.
Calendar Aging vs Cycle Aging: What Cycle Aging Is
Cycle aging is capacity loss caused by the act of charging and discharging. Instead, it scales with how much energy passes through the cell, not just how much time goes by. A battery cycled hard sees more stress per day than one cycled gently. This holds even if both sit at the same average state of charge.
So several variables drive cycle aging. Depth of discharge is one. C-rate is another. Also, the state-of-charge range used during cycling matters too. A cell cycled between 20% and 80% takes less stress than one cycled between 0% and 100%. This holds even across the same number of cycles. Then temperature during active cycling also plays a role, on top of its calendar-aging effect at rest.
A long-running study on a commercial LFP and graphite cell ran cycle aging tests for 885 days. So it used 19 separate test points. Then these covered different combinations of temperature, C-rate, depth of discharge, and state-of-charge range. The results let researchers build a model that predicts cycle-driven fade from those four inputs. That kind of multi-variable model shows why cycle aging is harder to summarize in one sentence than calendar aging. So calendar aging vs cycle aging simply depends on more moving parts on the cycle side.
Cycle aging also tends to show up differently than calendar aging on a capacity curve. First, early cycles often cause a fast initial dip. Then fade slows into a steadier, more linear decline for a long stretch. Then late in life, fade can speed up again as the cell approaches end of life. Calendar aging, by contrast, tends to follow a smoother square-root-of-time pattern from the start.
How the Two Interact
Calendar aging vs cycle aging is a useful framing. But the two are not fully independent in practice. So a battery’s operating history shapes both at once. Take state of charge between cycles as an example. So it is itself set by how the cell was last used. That link between the two processes is one reason pure separation only works cleanly in a controlled lab setting.
Still, most aging models treat calendar and cycle aging as additive. Total degradation is modeled as roughly the calendar-aging contribution plus the cycle-aging contribution, calculated separately and then combined. So this additive approach is not perfectly accurate at the edges. But it holds up well enough to be the standard in both research and commercial degradation models.
One nuance is worth knowing here. But temperature drives both processes, and not always to the same degree. Research on large-format LFP cells built for stationary storage backs this up. So it found that temperature has the dominant effect on total aging. Still, the specific cycling protocol played a smaller secondary role. So keeping a system cool helps both pathways at once, even though the mechanisms underneath are different. For more on how temperature interacts with degradation broadly, see our guide on Battery Degradation in BESS: Causes, Mechanisms & Mitigation. It covers the full picture beyond calendar aging vs cycle aging alone.
Separating the Two in Real Field Data
In a lab, calendar aging and cycle aging can be isolated cleanly. So researchers run two sets of cells. One set only sits idle. The other only cycles. But in a live BESS, that kind of separation is not possible. So every cell has some combination of both happening constantly.
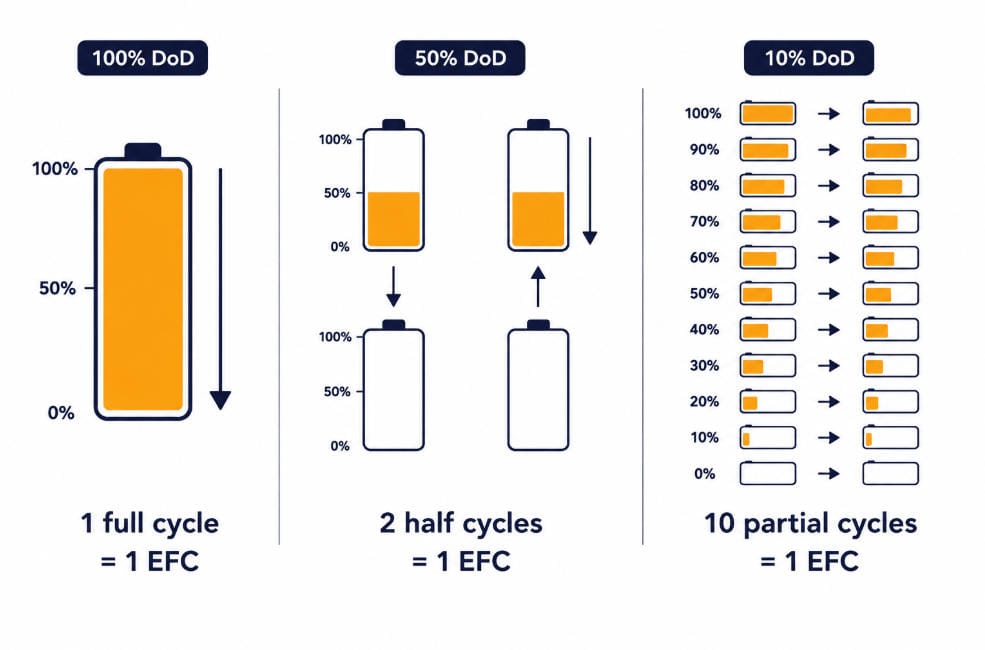
Operators handle this with a concept called the Equivalent Full Cycle, or EFC. An EFC converts partial cycles into a common unit based on energy throughput rather than raw cycle counts. So two 50% cycles count as one EFC. Ten 10% cycles also count as one EFC. So this puts shallow, frequent cycling and deep, occasional cycling on the same scale. That makes cycle-aging comparisons meaningful across very different usage patterns.
So with EFC as the throughput measure, operators can build a degradation model. It assigns a cycle-aging contribution per EFC and a calendar-aging contribution per unit of time. Then it sums the two. So LFP cells commonly rate between 2,500 and 9,000 EFC before reaching end-of-life thresholds. The exact number depends on the operating conditions and the EFC definition used. So that is a wide range. Still, cycling conditions like depth of discharge and C-rate largely explain why.
This EFC-based approach connects directly to how you track SOH in the field. Reference Performance Tests, run at fixed intervals, measure capacity and resistance directly. Between those tests, the EFC count and elapsed time both keep accumulating, feeding the additive model described above. For the full picture on tracking degradation as it happens, see our guide on BMS SOC Estimation Methods Explained. It covers how a BMS keeps that tracking accurate over time.
Modeling Calendar Aging vs Cycle Aging Together in a BESS
Most commercial degradation models treat calendar aging vs cycle aging as two curves added on top of each other. First, the calendar curve grows with elapsed time. Then the cycle curve grows with EFC count. At any point in a system’s life, total fade is close to the sum of both curves evaluated up to that point.
So this additive approach has a practical upside. It lets an operator run “what-if” scenarios without re-testing cells from scratch. Want to know how a change in dispatch strategy affects lifetime? Then increase the modeled EFC rate and hold the calendar term fixed. Want to know how a warmer siting location affects lifetime? Then adjust the temperature input feeding both curves and see how each one shifts.
Manufacturer degradation tables often build in this same logic, even when they present it as a single lookup chart. A table showing SOH by year and by cycling intensity is really just calendar aging vs cycle aging pre-combined into one surface. Reading the fine print on how that table was built tells you which usage pattern it assumes, which matters if your actual dispatch looks different.
Why the Distinction Matters for BESS Operators
Calendar aging vs cycle aging is not just an academic distinction. So calendar aging vs cycle aging changes what levers an operator actually has.
If calendar aging dominates a system’s degradation, the fix is mostly about resting state of charge and temperature. Idle capacity sitting at 100% SOC in a hot enclosure loses capacity every day, cycling or not. So that loss happens whether the asset is dispatched or parked. If cycle aging dominates instead, the fix is about how the system gets used. First, reducing depth of discharge helps. Then lowering C-rate helps too. Also, narrowing the SOC operating window targets cycle aging directly.
So most real systems have both pathways contributing. So the practical answer is usually “do both.” Keep resting SOC out of the high extreme when possible. Keep cells cool. Avoid unnecessary deep discharges. So none of these choices is exotic. What changes is which one matters most for a given system’s usage pattern. That depends on whether the system spends more of its life idle or more of its life cycling hard.
So application type is often the clearest signal. Take a solar-paired storage system as an example. It charges once a day, discharges once a day, and then sits mostly idle overnight. That pattern leans toward calendar-aging-dominant behavior. A frequency-regulation asset that cycles shallow and constant, day and night, leans toward cycle-aging-dominant behavior instead. So knowing which profile a system fits helps prioritize where to focus operating discipline.
Calendar Aging vs Cycle Aging: Quick Comparison
Factor
Calendar Aging
Cycle Aging
Primary trigger
Time at rest
Charge/discharge throughput
Biggest driver
State of charge
Depth of discharge and C-rate
Secondary driver
Temperature
Temperature
Happens when idle?
Yes
No
Root mechanism
SEI growth at rest
SEI growth plus cycling stress
Typical fade pattern
Smooth, square-root-of-time
Fast early dip, then linear
Main mitigation
Avoid high resting SOC
Reduce DOD, C-rate, SOC range
Field measurement unit
Time (days, months)
Equivalent Full Cycles (EFC)
Frequently Asked Questions
Can a battery have high cycle aging but low calendar aging?
Yes. A system cycled hard, rarely left at high state of charge, and kept cool can show cycle-driven fade as the dominant effect. So this pattern is common in frequency-regulation applications with constant, shallow cycling.
Does calendar aging stop once a battery starts cycling?
No. Calendar aging keeps happening in the background the entire time a battery exists, including during active use. Instead, cycle aging simply adds on top of it, not in place of it.
In calendar aging vs cycle aging, which one causes more capacity loss in a typical BESS?
It depends on the application. So systems that sit mostly idle at high SOC lean toward calendar-aging-dominant fade. Systems that cycle constantly, like frequency regulation assets, lean toward cycle-aging-dominant fade instead.
What is an Equivalent Full Cycle and why does it matter?
An EFC converts partial charge and discharge events into a standard unit based on energy throughput. So it lets operators compare cycle aging across very different usage patterns on the same scale. But raw cycle counts cannot do that on their own.
Is calendar aging vs cycle aging always split 50/50 in a real system?
No. Instead, the real split varies a lot by application and even by season. A system that sits idle through a hot summer may see calendar aging spike temporarily. Then it can settle back once cycling resumes and temperatures drop.
Every battery energy storage system loses capacity over time. That process, battery degradation in BESS, is not a flaw. It is a normal part of how lithium-ion cells age. So the real question is not whether battery degradation happens. It is how fast, and how much control you have over the rate.
This guide breaks down what drives battery degradation in BESS, across grid-scale and commercial LFP systems. First, it covers what happens inside the cell. Then it covers which choices slow the process down. It also links to deeper guides on each mechanism, so you can go as deep as you need.
Quick Answer Battery degradation in BESS is the slow, permanent loss of usable capacity and rise in internal resistance. Two things drive it. Calendar aging happens with time and is worst at high state of charge. Cycle aging happens from charging and discharging. Heat speeds up both.
What Is Battery Degradation in BESS?
Battery degradation in BESS shows up as two signs. First, the battery holds less energy than it did when new. Second, its internal resistance goes up. So more energy is lost as heat during use.
Both signs share one root cause. Lithium ions get used up by side reactions instead of doing real work. Some get trapped in a growing layer on the anode. Then others get lost when the electrode structure breaks down. So once a lithium ion is lost, that capacity does not come back.
For LFP systems, the news is fairly good. A well-run, grid-scale LFP battery typically loses 20% to 30% of its capacity over ten years. But numbers like these take real operating discipline. They do not happen by luck.
Two Degradation Pathways: Calendar Aging vs. Cycle Aging
Every BESS ages through two paths at once.
Calendar Aging
Calendar aging happens purely with time. Then it keeps going even while a battery sits idle. State of charge is the biggest driver. Temperature is a close second. So cells stored at high state of charge age faster, especially above 80%.
Cycle Aging
Cycle aging comes from charging and discharging. Also, it scales with cycle count, discharge depth, and charge rate. But use temperature matters too. A battery run hard at high current takes more stress per cycle than one run gently.
Field data backs this up. Tests on large-format LFP cells built for stationary storage found something clear. Temperature has the biggest effect on aging. Still, the cycling pattern matters less by comparison. So thermal management should come first in any BESS design.
What’s Happening Inside the Cell: SEI Growth and Lithium Plating
Battery degradation in BESS is at its core a chemistry problem. Two mechanisms cause most of the damage inside an LFP cell.
The first is growth of the solid electrolyte interphase, or SEI. This is a thin layer that forms on the anode surface. Also, some SEI growth is normal, even needed at first. Yet it keeps growing slowly over the battery’s life. Each time it thickens, it uses up lithium ions and electrolyte. At high state of charge, SEI growth speeds up. Then that growth also raises internal resistance. So aging cells run hotter and less efficiently than new ones.
The second mechanism is lithium plating. Instead of moving cleanly into the anode, lithium ions build up as metal on the surface. First, this mostly happens during fast charging in cold weather. Then the anode simply cannot take in lithium fast enough. So plated lithium is mostly lost capacity for good. In bad cases, it can also raise safety risks.
Temperature’s Outsized Role in Battery Degradation in BESS
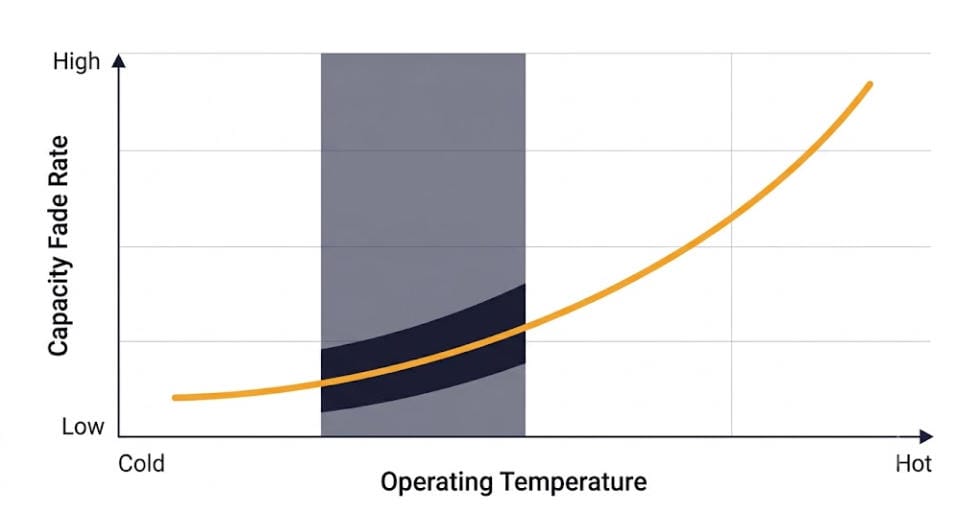
One factor beats every other factor: temperature. Heat speeds up SEI growth. It speeds up calendar aging. Also, it raises the rate of unwanted side reactions across the board. This holds true whether the battery sits idle or runs hard.
Cold brings a different problem. First, below a certain point, an LFP cell cannot take a charge quickly. Fast charging in the cold pushes cells toward the plating risk covered above. This is a design issue, not just a chemistry issue. So it shapes everything from enclosure size to winter charge-rate limits.
Operating Choices That Speed Up or Slow Down Degradation
Battery degradation in BESS is not fully out of your hands. Several choices have a direct, real effect on how fast it happens.
Depth of Discharge and C-Rate
First, deeper discharges add more stress per cycle than shallow ones. But they also deliver more usable energy, so there is a real tradeoff. So many operators run at 0.5C or lower to cut this stress. Still, going past 80% discharge depth often adds up over thousands of cycles.
State of Charge Operating Window
High state of charge speeds up calendar aging through faster SEI growth. Very low state of charge, below about 20%, brings a different risk. Also, it can dissolve current collectors and weaken the electrode. So most operators keep cells inside a 20% to 80% band. So they skip the full 0% to 100% range in daily use.
Tracking Battery Degradation in BESS: State of Health Estimation
You need a solid way to track battery degradation in BESS before you can manage it. That is harder for LFP cells than for most other chemistries.
LFP cells have a nearly flat voltage curve across the 20% to 80% state-of-charge range. So voltage barely moves across that wide middle band. So voltage-based tracking is not reliable on its own. LFP cells also show hysteresis. Also, voltage during charge and discharge differs by roughly 5 to 25 millivolts at the same state of charge. So both quirks make simple voltage checks a poor tool for tracking degradation.
Coulomb counting is the most common baseline method. It skips the voltage problem, but it still drifts over time from small sensor errors. But left alone, that drift adds up across thousands of cycles. So better systems add regular recalibration. But some also track internal resistance. Still others use model-based tools like an Extended Kalman Filter to keep the estimate honest as cells age.
How to Slow Battery Degradation in BESS: A Practical Summary
Strategy
Why It Helps
Keep SOC in a 20-80% operating band
Cuts both calendar aging and low-SOC electrode stress
Manage temperature actively
Temperature is the top driver of aging in most studies
Limit fast charging in cold weather
Cuts lithium plating risk at the anode
Avoid needless deep discharges
Cuts mechanical and chemical stress per cycle
Track SOH with more than coulomb counting alone
Catches drift before it skews dispatch decisions
Recalibrate BMS capacity estimates often
Keeps SOC and SOH readings accurate as cells age
Frequently Asked Questions
How much does a BESS degrade per year?
A well-run, grid-scale LFP system typically loses 20% to 30% of its capacity over ten years under good operating conditions. Fade is not perfectly linear year to year, so treat this as a decade-scale range rather than a fixed annual number.
What causes the most battery degradation in BESS?
Temperature and state of charge are the two biggest drivers, by far. High temperature speeds up nearly every aging mechanism at once. High state of charge speeds up calendar aging too, even when the battery sits idle.
Does battery degradation in BESS ever stop?
No. Degradation is steady and permanent. Good thermal management and SOC discipline can slow it a lot. But nothing stops it entirely.
Is LFP more resistant to degradation than other lithium-ion chemistries?
Yes. LFP is more stable than nickel-based chemistries like NMC. That is a big reason it leads in stationary storage. It still degrades, just more slowly and more predictably under the same conditions.
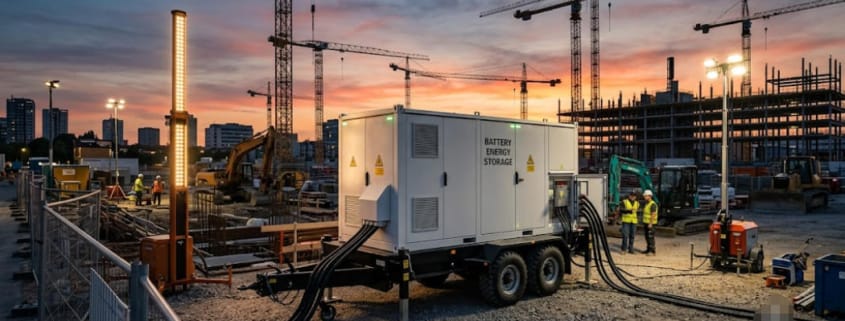
⚡ Quick Answer A Mobile BESS is a battery energy storage system built onto a trailer, truck bed, or skid. It stores electricity and discharges it on demand, so it can power a site with no fuel, no exhaust, and almost no noise.
What Is a Mobile BESS?
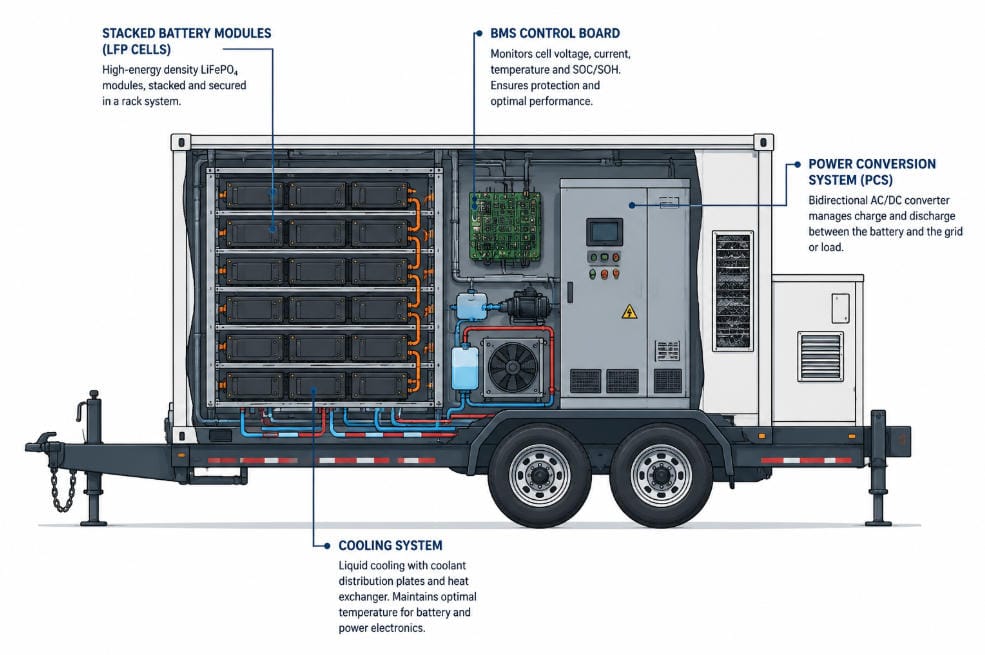
A Mobile BESS packs the same core parts as a fixed installation into a towable unit. Battery modules sit inside a weatherproof enclosure. Meanwhile, a power conversion system (PCS) turns stored DC energy into usable AC power, and a battery management system (BMS) tracks voltage, temperature, and charge level in real time.
In some designs, manufacturers split the battery pack and the PCS into separate trailers. As a result, an operator can pair several battery trailers with one shared PCS unit and add capacity without buying a new inverter each time.
Mobile BESS vs. Diesel Generators
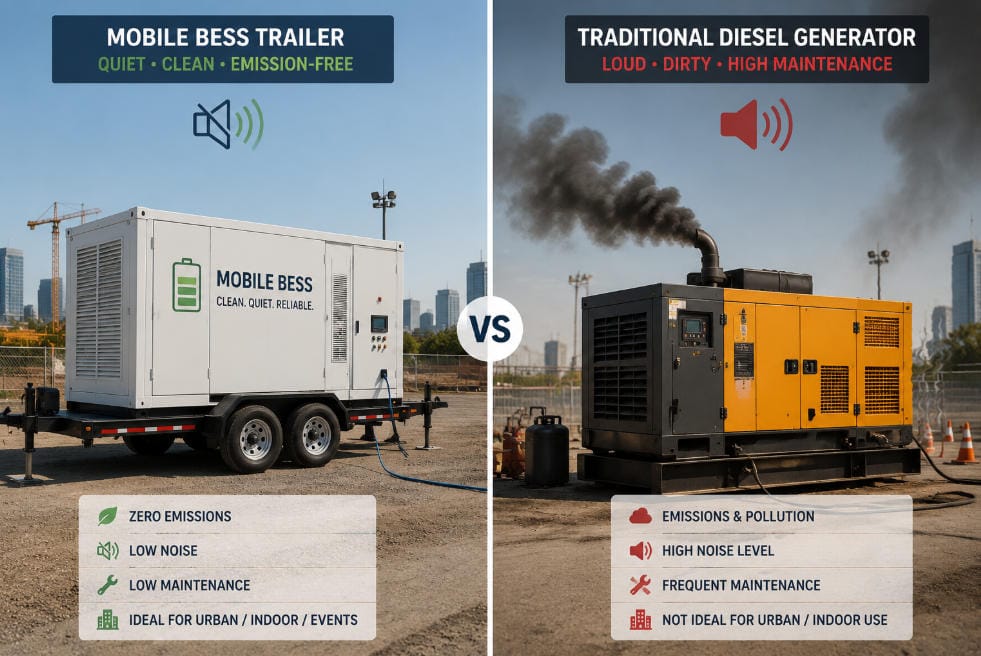
Diesel generators have powered temporary sites for decades. Today, though, a Mobile BESS competes for many of the same jobs. Since it works in a very different way, the table below compares the two side by side.
Factor
Mobile BESS
Diesel Generator
Emissions
Zero exhaust during discharge
Combustion exhaust, particulates, NOx
Noise
Near-silent operation
60-90+ dB at typical load
Fuel logistics
None during discharge; recharges from grid or solar
Ongoing diesel delivery and storage
Response time
Instant power, no warm-up
Seconds to minutes to reach stable output
Runtime
Fixed by battery capacity, then needs recharge
Runs as long as fuel supply lasts
Best fit
Short-duration, indoor, or noise-restricted sites
Long, continuous loads with no grid access
In practice, many sites pair the two instead of choosing one. First, a generator recharges the battery at its most efficient load point. Then it steps back while the Mobile BESS carries the load alone.
Because of this, the hybrid pattern can cut diesel use by roughly half. A generator that idles at partial load burns fuel poorly, so shifting the everyday load onto the battery saves real money over a multi-week job.
Mobile BESS Use Cases
Mobile BESS units solve an old problem in a new way. They provide temporary power where the grid hasn’t arrived yet, isn’t reliable, or isn’t allowed. Overall, six use cases account for most deployments today.
Construction Sites
Construction is the largest single market for mobile storage. Grid interconnection applications often take three to nine months, so a Mobile BESS closes that gap right away.
It can power tower cranes, welding gear, site offices, and electric machinery from day one. Because it makes no exhaust, crews can also run it in tunnels and basements, where diesel fumes would be unsafe.
Events and Film Production
Concerts, festivals, and film sets need power that stays out of the way. A Mobile BESS delivers clean sine-wave output and stays under roughly 55 dB, so it won’t hum in a live recording or flicker a sensitive light rig.
Simply put, a generator can’t match that at the power levels these shoots need.
Mobile BESS for Disaster Relief
When storms or wildfires knock out power lines, crews can truck in units within hours. They power emergency radios, medical gear, and temporary shelters, often arriving before utility crews finish permanent repairs.
Data Center Maintenance Windows
Data centers sometimes need to take a UPS or switchgear segment offline for maintenance without losing backup coverage. A Mobile BESS can stand in during that window, then leave once the permanent system is back online.
Mobile BESS for Grid Support
Utilities and developers increasingly use these units for temporary grid services: voltage support, short-term capacity, or bridging power for a solar or wind project still waiting on its permanent interconnection agreement. As a result, a finished generation asset keeps earning instead of sitting idle.
EV Charging Support
Pop-up EV charging is one of the fastest-growing uses. Because a Mobile BESS can buffer a weak grid connection, it can still deliver fast-charging bursts at events or in areas the grid hasn’t fully reached.
Mobile BESS Sizing and Chassis Configurations
Capacity varies widely, and the right size depends entirely on the job. Understanding a few typical bands makes it much easier to spec the right unit.
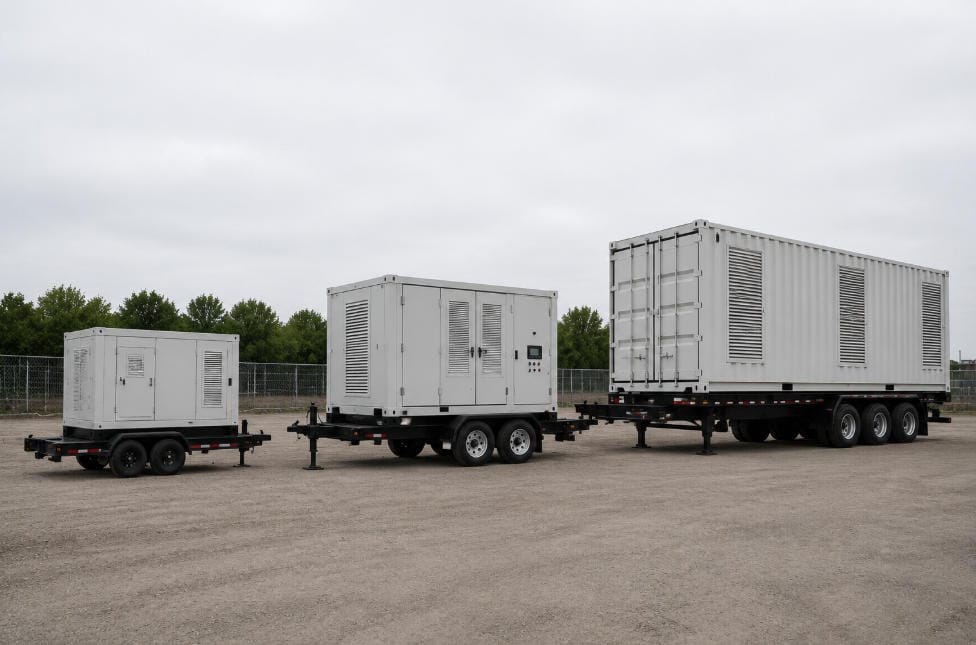
Chassis Types and Capacity
Compact truck-mounted units typically sit around 90 kWh. Power Up Connect’s Green Grid trailer is a good example: it carries UL 9540 and UL 9540A certification, and operators can daisy-chain up to 10 units for bigger jobs.
Meanwhile, mid-size trailer units generally run from about 250 kWh to 650 kWh. This band covers most construction and event work.
Utility-scale trailers sit at the top end. They often exceed 800 kWh and sometimes reach 2 MWh per unit. These usually ride on a 20-foot container platform or a dedicated semi-trailer, so teams can string several together for multi-megawatt-hour jobs.
Chassis Type
Typical Range
Best Fit
Compact flatbed / skid
~90 kW – 300 kWh
Small job sites, single-piece equipment, light-load events
Drawbar trailer
~250 kW – 650 kWh
Mid-size construction sites, festivals, multi-generator replacement
Container semi-trailer
800 kWh+ up to ~2 MWh
Utility-scale temporary power, large events, grid-support deployments
Road weight limits usually cap a single trailer’s size, not the battery technology itself. So past roughly 1-2 MWh, it’s typically easier to deploy multiple units side by side than to push one chassis larger.
Battery Chemistry and Cooling
LFP (lithium iron phosphate) leads this segment for good reason. It handles the shaking and heat swings of repeated transport well. Plus, its long cycle life (commonly rated 6,000-8,000+ cycles) suits frequent redeployment far better than higher-energy but less forgiving chemistries.
Smaller units, roughly under 300 kWh, typically use air cooling. It keeps the system light and easy to fix in the field.
Larger, higher-power trailers, however, generally switch to liquid cooling instead, since it manages heat better. This is the same crossover point used in stationary BESS design.
Chassis engineering: Dual-axle running gear, mechanical braking, and vibration-dampening brackets protect the battery pack through highway travel and rough job-site terrain. The chassis itself needs proper axle load ratings, DOT-compliant lighting and braking, and secure tie-down points.
Mobile BESS Safety and Compliance
A Mobile BESS still has to meet the same fire-safety and transport rules as any lithium battery system. However, it does earn a few specific carve-outs because it moves.
NFPA 855 Rules
NFPA 855, the Standard for the Installation of Stationary Energy Storage Systems, defines mobile ESS in Section 3.3.9.5. It then sets installation rules in Section 4.5. The most important carve-out is this: wheeled or trailer-mounted units don’t need to meet the seismic and structural load rules that apply to permanent installations.
Even so, standard separation distances still apply. Deployments need at least 10 ft (3 m) from public ways, stored combustibles, and hazardous materials. They also need 50 ft (15 m) from tents or seating areas holding 30 or more people.
That said, an Authority Having Jurisdiction (AHJ) can reduce these distances if large-scale UL 9540A fire test data backs it up. Regardless, deployed mobile ESS still can’t go indoors, in covered parking garages, on rooftops, below grade, or under building overhangs.
UL 9540 Listing for Mobile BESS
Mobile units still need UL 9540 listing, the core safety standard for energy storage systems. They typically undergo UL 9540A large-scale fire testing too, just like a stationary installation.
In short, mobility doesn’t exempt the battery system from certification — it only changes the foundation and seismic rules. For the full installation breakdown, see our NFPA 855 guide.
Transport Testing Under UN 38.3
Before a Mobile BESS can ship, its cells and battery packs must pass UN 38.3. This set of eight tests simulates real transport conditions: altitude, thermal cycling, vibration, mechanical shock, short circuit, impact, overcharge, and forced discharge.
The vibration test alone runs a sweep from 7 Hz to 200 Hz for three hours. Next, a shock test simulates a 150g/6ms or 50g/11ms impact. That’s a tough bar, since this system gets driven over real roads again and again, not installed once and left in place.
Road Transport Rules
In the US, moving an assembled lithium battery system by highway falls under 49 CFR 173.185, part of the DOT’s Hazardous Materials Regulations. Since it classifies lithium batteries as Class 9 dangerous goods, compliance means UN-spec packaging, correct labels, and proper shipping papers.
A good provider keeps UL 9540 listing documents and UN 38.3 test summaries ready on request. You shouldn’t have to wait while a provider scrambles for paperwork after a jurisdiction asks for it.
Certification Varies by Export Market
It’s also worth noting that certificates differ by market, not just by product. US and Canadian buyers look for UL 1973, UL 9540, and UL 9540A. EU buyers need CE marking plus IEC 62619 or IEC 62933. China requires CCC, Korea requires KC, India requires BIS, and Japan requires PSE. UN 38.3 applies everywhere, since it covers transport rather than installation. For the full regional breakdown, see our BESS certifications guide.
Mobile BESS vs. Stationary BESS
Factor
Mobile BESS
Stationary BESS
Installation
Deployed in hours; no permanent foundation
Weeks to months; foundation and permitting
Relocation
Built to move between sites
Fixed for the life of the asset
Typical use case
Temporary power, events, emergency response
Long-term grid support, solar firming
Seismic requirements
Exempt when on a wheeled chassis
Full seismic design required
Capacity ceiling
Practical limit near 1-2 MWh per trailer
Scales to tens or hundreds of MWh
Cost structure
Often rented per deployment
Capital asset with long depreciation
Choosing a Mobile BESS Provider
Providers increasingly sell Mobile BESS as a service rather than as a capital purchase. Because of that, the ownership model matters just as much as the hardware spec sheet.
Rental / deployment-based pricing — pay per project or per month, and the provider handles maintenance and recharge logistics
Battery-swap service — the provider delivers a fully charged replacement unit and takes the depleted one away, so on-site recharging is never your problem
Hybrid generator pairing — for sites where full battery replacement isn’t practical yet, running the BESS alongside a generator can still cut fuel use by roughly half
Outright purchase — makes sense when your organization deploys often enough that utilization beats rental economics
Before committing, it’s worth asking any provider a few direct questions:
Is the unit UL 9540 listed and UN 38.3 tested, with documentation available on request?
What is the actual site commissioning time, door-to-power-on, not just “rapid deployment” marketing language?
What is the noise rating at rated load, and is it independently measured or a vendor estimate?
Is the enclosure rated for indoor or enclosed-space use, or is it outdoor-only?
What happens if the unit needs service mid-deployment? Is there a swap or backup unit guarantee?
What’s included in the rental rate: transport, commissioning, decommissioning, and recharge, or are these billed separately?
Does the chassis carry standard DOT lighting, braking, and axle certifications for your transport route?
Mobile BESS Market Outlook
Fortune Business Insights values the mobile energy storage system market at $58.28 billion in 2025, and projects it will reach $207.03 billion by 2034. That’s a compound annual growth rate above 15%.
Several trends are driving this growth. For one, utilities and developers are swapping out diesel generators to cut emissions and noise complaints. At the same time, falling LFP battery costs make the switch more affordable each year.
Longer grid interconnection queues are pushing more projects toward temporary bridging power, too. And a growing rental and battery-swap model is lowering the barrier for construction and events firms that don’t want to own the asset outright.
So for project developers, the takeaway is simple. Mobile BESS has moved from a niche disaster-relief tool to a mainstream option, one worth considering any time a site needs power before, instead of, or alongside a permanent grid connection.
Mobile BESS Key Takeaways
Aspect
Key Point
Definition
A Mobile BESS is a trailer-, truck-, or skid-mounted battery storage system built for temporary deployment.
Chemistry
LFP dominates for thermal stability and 6,000-8,000+ cycle life.
Cooling
Air cooling under ~300 kWh; liquid cooling for larger, high-power units.
Sizing
Ranges from ~90 kWh truck units to 2 MWh utility-scale trailers.
Safety code
NFPA 855 Section 4.5 governs mobile ESS; seismic rules are waived on wheeled chassis.
Listing
UL 9540 listing and UL 9540A fire testing still apply.
Transport
Cells must pass UN 38.3 testing; US highway moves follow 49 CFR 173.185.
Market
Projected to grow from $58.28B (2025) to $207.03B (2034), a 15%+ CAGR.
Frequently Asked Questions
What Is a Mobile BESS Used For?
A Mobile BESS gives temporary, emission-free power for construction sites, live events, film sets, disaster relief, data center maintenance, EV charging, and short-term grid support. In short, it fits anywhere a diesel generator would normally go, but noise, exhaust, or setup speed favor a battery instead.
How Long Does a Mobile BESS Run Before Recharging?
Runtime depends on the battery’s energy capacity relative to the connected load, not a fixed number. Typically, a mid-size unit in the 250-650 kWh range can run critical loads for several hours to a full day before it needs recharging.
Providers usually size the system to match the job’s load profile. Many also offer battery-swap or hybrid generator support for jobs that need power longer than a single charge allows.
Is It Safe to Transport on Public Roads?
Yes, as long as the system carries the right certification. Cells and battery packs must pass UN 38.3 testing before they ship. In the US, road transport then falls under 49 CFR 173.185, which classifies lithium batteries as Class 9 hazardous material.
The chassis itself also needs standard DOT lighting, braking, and axle certifications. A reputable provider keeps this paperwork ready on request.
Does NFPA 855 Apply to a Mobile BESS?
Yes. NFPA 855 defines and regulates mobile energy storage systems directly in Section 4.5. It exempts wheeled, trailer-mounted units from seismic and structural load rules, but UL 9540 listing, minimum separation distances, and site-specific electrical rules still apply.
What Battery Chemistry Do Most Units Use?
Lithium iron phosphate (LFP) leads this segment. It handles the shaking and heat swings of repeated transport well, and its long cycle life suits frequent redeployment better than most alternatives.
BESS oversizing — deliberately installing more nameplate energy capacity than your immediate load demands — is one of the most debated decisions in battery storage project design. Therefore, getting this decision right has direct consequences for project ROI, battery longevity, and contracted performance guarantees. Furthermore, as storage markets mature and the Section 48E Investment Tax Credit continues to reshape project economics, understanding when BESS oversizing helps and when it hurts has never been more important.
In this guide, we break down the real pros and cons of BESS oversizing across residential, commercial and industrial (C&I), and utility-scale applications. Additionally, we provide a practical sizing framework, a direct comparison with the augmentation alternative, and clear guidance on how much oversizing is appropriate for each use case. For background on key BESS performance metrics, see our BESS specifications guide.
Key Takeaway BESS oversizing reduces average depth of discharge, extends cycle life, and provides a degradation buffer — but it carries real costs in capex, idle capacity, and calendar aging risk. Consequently, the right answer depends entirely on your use case, load profile, battery chemistry, and project economics.
What Is BESS Oversizing? Definition and Key Drivers
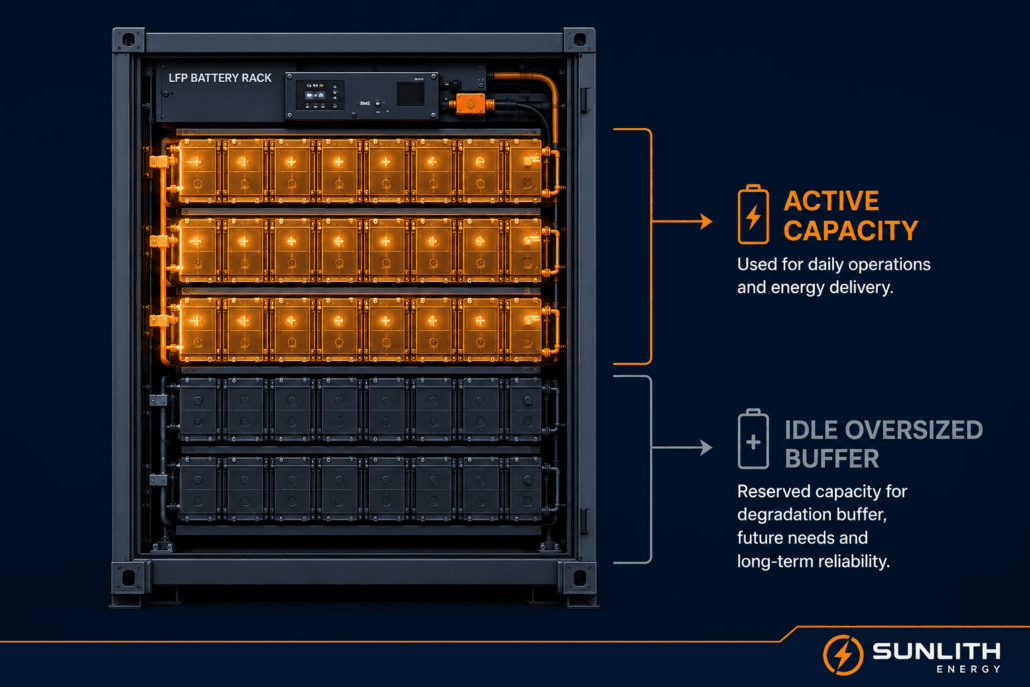
BESS oversizing means installing more nameplate energy capacity (kWh) or power capacity (kW) than the system is expected to dispatch on a daily basis under normal operating conditions. In other words, it is the deliberate act of selecting a battery system larger than the immediate load or solar coupling requirement.
The Four Main Reasons Projects Choose BESS Oversizing
Project developers and system designers choose BESS oversizing for four primary reasons. First, it provides a built-in degradation buffer — batteries lose capacity over time, so installing extra kWh upfront ensures the system still meets its contractual output at end of life (EOL). Second, it reduces the average depth of discharge (DoD), which significantly reduces electrochemical stress and extends cycle life. Third, it future-proofs the system against load growth — a facility adding EV chargers or expanding solar may outgrow a precisely sized BESS within three to five years. Finally, the ITC captures a larger credit on the full installed capacity at commissioning rather than on augmented modules added later.
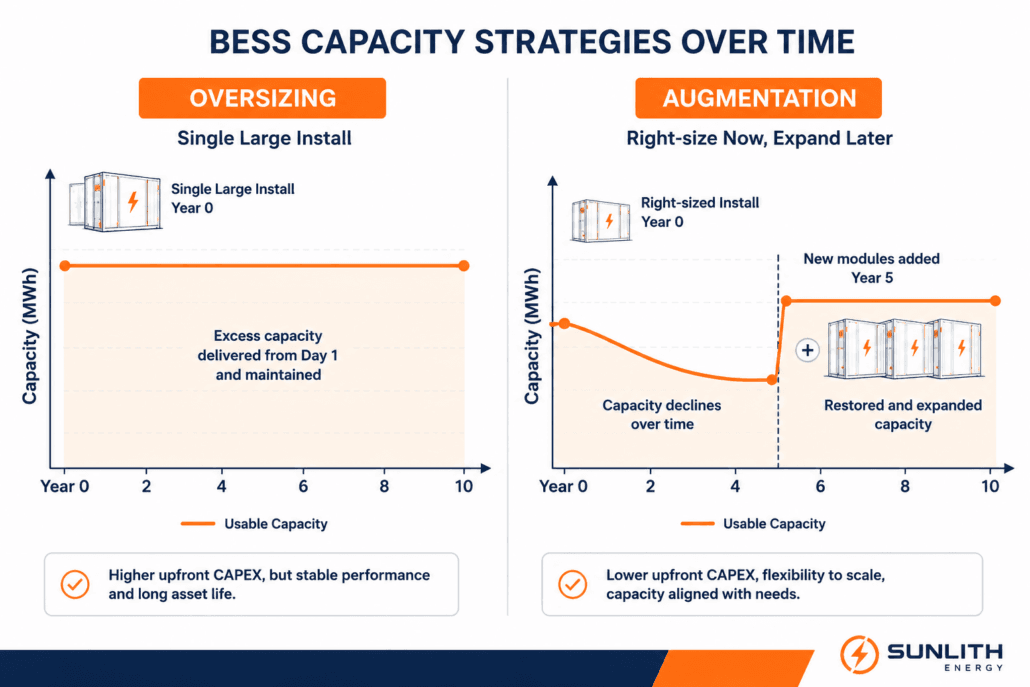
BESS Oversizing vs Augmentation: Two Different Strategies
It is important to separate two strategies that are frequently conflated: oversizing (installing more capacity upfront) and augmentation (adding capacity later). Both address the degradation problem, but they carry very different economic and technical profiles. Whereas oversizing locks in capex on Day 1, augmentation defers cost — but at the risk of losing ITC eligibility on the additional modules. We explore this comparison in detail in Section 5.
Pros of BESS Oversizing: 7 Technical and Financial Benefits
1. Extended Cycle Life Through Lower Depth of Discharge
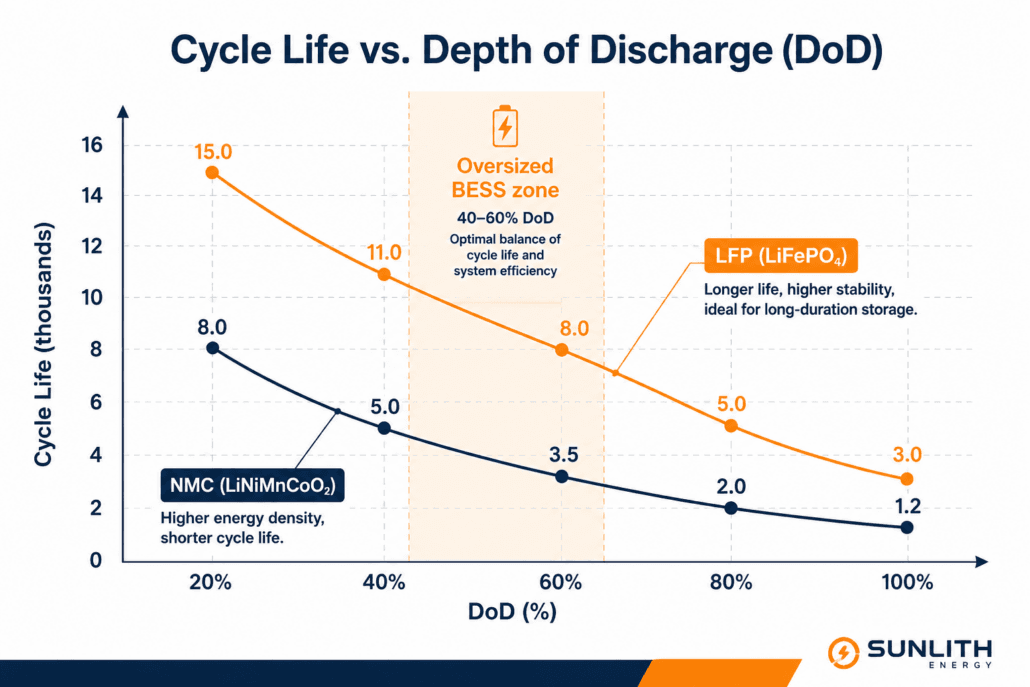
The single most significant technical benefit of BESS oversizing is the reduction in average Depth of Discharge (DoD). Battery cycle life is acutely sensitive to DoD: a LiFePO4 (LFP) cell discharged to 80% DoD typically delivers 3,000–6,000 cycles to 80% capacity retention, whereas the same cell cycled at 40% DoD can exceed 10,000 cycles. Moreover, for NMC chemistry, the spread is even wider. Therefore, oversizing directly reduces the daily DoD, keeping cells in the shallow-cycle, high-longevity operating zone. As a result, the total useful life of the system increases substantially — without any hardware change.
A peer-reviewed sizing study published in MDPI Energies confirmed that an oversized BESS consistently operates at approximately 30% DoD, significantly reducing cycling degradation compared to a precisely sized system. See our BESS cycle life comparison guide for detailed 0.5C vs 1C cycling data across liquid-cooled LFP formats.
2. Built-In Degradation Buffer for End-of-Life Performance
All BESS contracts and revenue agreements are written against end-of-life capacity, not nameplate. Consequently, a project designed to deliver 1 MWh at year 10 must either oversize at commissioning to absorb predicted capacity loss, or augment mid-life. BESS oversizing solves this directly: the 15–20% extra capacity at year 0 becomes the system’s normal operating capacity at year 8–10, after degradation has run its course. In addition, oversizing also enables developers to lock in capital expenditures at project outset, mitigating future cost uncertainty. For a deeper understanding of capacity fade mechanics, see our Battery State of Health (SoH) estimation guide.
3. Improved Round-Trip Efficiency at Partial Loads
Battery inverters and Power Conversion Systems (PCS) operate most efficiently when working well below their rated power ceiling. Therefore, an oversized BESS means the power electronics run at partial load more often, reducing switching losses and thermal stress. Across LFP systems, round-trip efficiency (RTE) typically reaches 90–95% in well-managed partial-load conditions versus 85–88% when the system is pushed to rated limits daily. Furthermore, professional system sizing guidelines recommend oversizing by 5–20% specifically to compensate for RTE losses over the project’s lifetime. For a full breakdown of how RTE impacts your PCS selection, visit our BESS PCS functions and features guide.
4. Future-Proofing for Load Growth
Commercial and industrial facilities are rarely static. An EV fleet charging infrastructure build-out, a new production line, additional HVAC loads, or expanded solar capacity can all push a precisely sized BESS into insufficiency within a few years. As a result, BESS oversizing provides headroom to absorb load growth without a full system redesign or costly inverter upgrades. For residential customers, similarly, oversizing by 10–20% accounts for future appliance electrification — heat pumps, EV charging, induction cooking — that increase household energy consumption over time. This is especially relevant given that electricity rates have increased 32% over the past decade and the trend is expected to continue.
5. Greater Resilience During Extended Outages
An oversized BESS provides substantially longer backup durations during grid outages. For instance, where a precisely sized system may sustain critical loads for 4–6 hours, a 25% oversized system of the same power rating extends that window to 5–7.5 hours without additional hardware. Consequently, for hospitals, data centres, manufacturing facilities, and off-grid microgrids, this resilience buffer is a core design requirement rather than an optional feature. In addition, BESS oversizing enables higher solar self-consumption ratios, because the system can absorb more excess PV generation that would otherwise be curtailed — especially in DC-coupled configurations. Our cylindrical vs prismatic LFP cell guide covers how cell format selection interacts with resilience design.
6. Tax Credit Maximisation Under Section 48E
Under the Section 48E Clean Electricity Investment Tax Credit, the ITC applies to the full installed nameplate capacity at commissioning. Projects beginning construction before 2033 can qualify for a base credit of 6% rising to 30% — or up to 50% with domestic content and labour standards — on the entire installed system. Therefore, oversizing at commissioning rather than augmenting later allows developers to capture ITC on the additional capacity now, when the credit is at its most generous. As documented by Energy-Storage.News, Pivot Energy uses optimisation models specifically to find the ‘sweet spot’ where overbuilding by 15–20% captures the full ITC while also reducing DoD and slowing the degradation curve.
7. Higher Solar Self-Consumption and Clipping Capture
In solar-plus-storage configurations, an oversized BESS absorbs more excess PV generation that would otherwise be curtailed — particularly in DC-coupled systems where the battery captures inverter clipping losses. Projects with aggressively sized solar arrays consequently benefit most from an oversized storage buffer, enabling higher self-consumption ratios and better time-of-use (ToU) arbitrage revenue. Additionally, the flat voltage profile of LFP cells means the battery can accept charge across a wider SoC range without significant efficiency loss, making it well-suited to absorbing variable clipping events.
Cons of BESS Oversizing: 7 Real Drawbacks to Weigh
1. Higher Upfront Capital Expenditure
The most obvious downside of BESS oversizing is cost. At current commercial LFP BESS pricing of $220–$320 per kWh (nameplate, installed), adding 15–25% extra capacity translates directly into a 15–25% larger capital outlay. For example, on a 1 MWh C&I project, the oversizing premium reaches $33,000–$80,000. On a 10 MWh utility-scale project, the figure climbs to $330,000–$800,000. As a result, higher capex extends payback periods, dilutes IRR, and increases financing costs. Moreover, the 20/80 rule for battery SoC management — explored in our 20/80 rule for batteries guide — shows that moving from a 90% DoD strategy to a strict 60% DoD strategy for the same usable energy requires installing roughly 33% more nameplate capacity, at a steep capex premium.
2. Idle Capacity — Stranded Capital
An oversized BESS, by definition, contains capacity that is not used every day. In a system with a 30% oversizing factor, approximately 23% of the installed kWh is functionally stranded under normal operating conditions — generating no direct revenue, not contributing to peak shaving, and not offsetting grid draw. Therefore, for merchant revenue projects where every kWh of contracted discharge must justify its hardware cost, idle capacity directly weakens the financial case. Consequently, a detailed financial model comparing oversized vs precisely sized scenarios is essential before committing to an aggressive oversizing strategy.
3. Calendar Aging at High State of Charge
There is a subtle but real risk in BESS oversizing: a battery that is rarely deeply discharged will consequently spend more time at a high state of charge (SoC) between cycles. For LFP, this matters less due to the flat voltage curve, but for NMC and NCA chemistries, sustained high SoC accelerates calendar aging through lithium plating and electrolyte decomposition. The EMS must therefore be configured with SoC upper limits (typically a 90% ceiling) to mitigate this risk, which further reduces the usable window — partially negating the oversizing benefit.
4. Larger Physical Footprint and Permitting Complexity
A larger BESS means more rack space, additional container units, larger electrical rooms, and more complex fire suppression under NFPA 855 setback requirements. For urban C&I projects, rooftop installations, or sites with constrained footprints, BESS oversizing may simply not be feasible without additional civil and structural engineering. As a result, the incremental cost of accommodating a larger system can erode or eliminate the economic benefit of the additional capacity.
5. Risk of Over-Engineering Against Inaccurate Load Projections
BESS oversizing is typically justified by load growth projections that may not materialise. A facility forecasting 30% energy consumption growth over five years but actually growing 10% has paid a significant capex premium for capacity that will never be fully utilised. Furthermore, the further into the future the projections extend, the less reliable they become — and the weaker the economic case for aggressive oversizing. Therefore, right-sizing discipline, grounded in real interval load data, is essential before committing to an oversizing strategy.
6. Interconnection Limit Conflicts
Utility interconnection agreements define the maximum allowable power at the Point of Common Coupling (PCC). An oversized BESS that exceeds the permitted inverter or PCS rating — or that pushes a project over the interconnection ceiling — may require expensive distribution upgrades, transformer replacements, or grid impact studies. As a result, always validate that the oversized system’s power rating remains within interconnection constraints before finalising the design.
7. Diminishing Returns on ROI for Thin-Margin Projects
For projects where the economics are already marginal — low ToU spreads, limited demand charges, or thin merchant power prices — the additional capex of BESS oversizing may not be recoverable within the project’s financial life. Therefore, a right-sizing discipline, rather than aggressive oversizing, often produces better risk-adjusted returns on projects operating in challenging market conditions. Additionally, if battery prices continue to fall, augmentation at year 5–7 may deliver the same EOL capacity guarantee at a lower total lifecycle cost than oversizing today.
BESS Oversizing Pros and Cons: Quick-Reference Comparison Table
PROS of BESS Oversizing
CONS of BESS Oversizing
Extends cycle life by reducing average DoD
Higher upfront capital expenditure
Slower capacity degradation over project lifetime
Idle capacity — underutilised asset
Buffer for future load growth without re-powering
Larger footprint and space requirements
Improves round-trip efficiency at partial loads
Additional BMS / thermal management complexity
Strengthens resilience during extended outages
Risk of battery sitting at high SoC, accelerating calendar aging
Lock in ITC / 48E tax credits on full capacity now
Diminishing returns if load growth projections are wrong
Reduces depth of discharge and thermal stress
Potentially overshoots interconnection limits
Supports higher solar self-consumption
Makes ROI harder to justify on thin-margin projects
BESS Oversizing vs Augmentation: Which Degradation Strategy Wins?
The BESS oversizing debate is inseparable from its primary alternative: augmentation — the strategy of adding battery modules at year 5 or 7 to restore degraded capacity. However, these strategies are not equivalent, and the right choice depends on several project-specific factors.
Factor
BESS Oversizing (Upfront)
Augmentation (Mid-Life)
Capex Timing
Higher Day-1 cost; lower total lifecycle cost
Lower Day-1 cost; uncertain future capex at year 5–7
ITC Eligibility
Full credit on entire capacity at commissioning
Augmented capacity may miss ITC or face FEOC risk
Degradation Benefit
Reduces DoD and slows degradation from Day 1
Addresses degradation after it has occurred
Space Planning
Must install full footprint upfront
Must reserve physical and electrical space for future modules
Falling Battery Prices
Locks in today’s cost for future capacity
May benefit from lower prices at year 5
Complexity
Lower operational complexity
Requires mid-project procurement and system rebalancing
C&I with budget constraints; markets with falling storage prices
As battery prices continue to fall, augmentation is becoming more attractive for some project types. Nevertheless, as Pivot Energy’s modelling demonstrates, for ITC-sensitive projects, oversizing by 15–20% upfront typically produces better risk-adjusted NPV than augmentation — particularly given the difficulty of qualifying augmented capacity for the same ITC rate under the One Big Beautiful Bill Act.
How Much BESS Oversizing Is Right? A Use-Case Sizing Guide
There is no universal BESS oversizing percentage. Instead, the right buffer depends on your use case, battery chemistry, load profile, and project economics. However, the table below provides a practical reference framework covering the most common project types:
Use Case
Recommended BESS Oversizing
Rationale
Key Risk if Under-Sized
Residential Solar + Storage
10–20%
Compensate for DoD and RTE losses; buffer seasonal variation
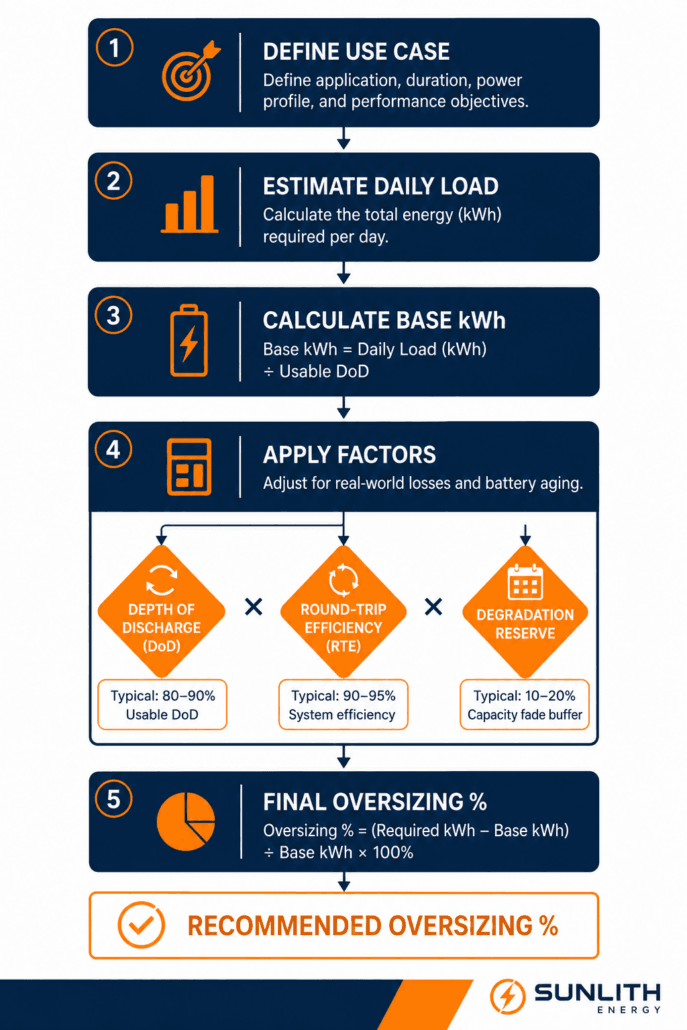
Example: 30 kWh/day load × 2 autonomy days = 60 kWh base ÷ 0.85 DoD × 0.92 RTE = 76.6 kWh nameplate minimum + 15% degradation buffer = approximately 88 kWh recommended nameplate capacity
Note: For LFP chemistry with a 90% DoD operating window, adjust DoD factor accordingly.
For LFP chemistry specifically, the degradation benefit of BESS oversizing is more modest than for NMC or NCA, because LFP already exhibits a flatter voltage curve and superior cycle life at high DoD. Therefore, the most rigorous approach — as recommended in NREL’s Energy Storage Modelling guidelines and the IEA’s Batteries and Secure Energy Transitions report — is to use simulation tools such as NREL’s SAM or PVsyst with real 15-minute interval load data to determine the optimal capacity that minimises LCOE while meeting the contracted capacity guarantee at EOL.
Does Battery Chemistry Change the BESS Oversizing Calculus?
Yes — significantly. However, the extent to which BESS oversizing is beneficial varies considerably by chemistry. Here is how the most common BESS chemistries interact with oversizing strategy:
LFP (LiFePO4): The Most Common Choice for Commercial BESS
LFP already offers exceptional cycle life — 6,000–10,000+ cycles at 0.5C to 80% SoH — a flat voltage curve that reduces SoC-related aging, and thermal stability above 270°C. Therefore, the benefit of BESS oversizing for LFP is real but more modest than for NMC. A 10–15% oversizing factor is typically sufficient for residential and C&I LFP projects, unless extended autonomy is a primary requirement. For a detailed comparison of LFP cell formats, see our cylindrical vs prismatic LFP guide.
NMC (Nickel Manganese Cobalt): Greater Benefit from Oversizing
NMC cells are more sensitive to both high SoC and high DoD. The cycle life penalty for deep discharging is steeper, and calendar aging at high SoC is more pronounced. Consequently, for NMC-based systems, BESS oversizing by 20–30% can provide meaningful cycle life extension. However, the EMS must be configured to avoid sustained high-SoC parking, which otherwise accelerates precisely the degradation the oversizing was intended to prevent.
NCA (Nickel Cobalt Aluminium): Strongest Case for Oversizing
NCA is even more sensitive to DoD extremes than NMC. Therefore, BESS oversizing is strongly recommended for NCA systems, alongside strict SoC window management — typically a 20–90% operational band. As a result, NCA-based utility-scale systems frequently carry 20–30% oversizing factors as a standard design requirement.
When to Choose BESS Oversizing — and When to Avoid It
Oversize Your BESS When These Conditions Apply
Your project carries a 10+ year contract or PPA with capacity guarantee provisions that must be met at end of life
You are qualifying for ITC / Section 48E and want to maximise the tax credit on the full installed capacity at commissioning
The site has a clear load growth trajectory — EV charging, electrification roadmap, or solar expansion planned
You are designing an off-grid or critical backup system where autonomy days are non-negotiable
NMC or NCA chemistry is specified and DoD reduction delivers a significant cycle life benefit
Your DC-coupled solar array is oversized relative to the inverter and the battery can capture clipping energy
The incremental capex of BESS oversizing is recoverable within the project financial model
Avoid BESS Oversizing When These Conditions Apply
Project economics are already thin and additional capex pushes IRR below the acceptable threshold
Load forecasts are highly uncertain and growth projections lack solid 15-minute interval data support
Physical space constraints make a larger system impractical or disproportionately expensive to install
The interconnection agreement caps power capacity at a level that already constrains daily dispatch
Battery prices are falling rapidly in your market and augmentation in year 5–6 will be substantially cheaper
LFP chemistry is specified and daily DoD is already inherently low (below 60%) with proper sizing
The Four-Step BESS Oversizing Decision Framework
Rather than guessing at an oversizing percentage, use this structured four-step framework to determine whether BESS oversizing is appropriate for your project and, if so, by how much. As a result, you will arrive at a defensible, financially grounded nameplate capacity rather than an arbitrary rule of thumb.
Step 1 — Load Analysis: Gather Real Interval Data
First, collect at least 12–24 months of 15-minute interval load data. Identify peak demand events, average daily consumption, and seasonal variation patterns. This step is non-negotiable: BESS oversizing justified by rough annual consumption estimates rather than interval data almost always produces either over-engineered or under-performing systems.
Step 2 — Base Capacity Calculation
Next, apply the standard sizing formula — daily load × autonomy days ÷ (DoD × RTE) — to establish the minimum required nameplate capacity. This gives you the floor, not the target. However, it also reveals exactly how sensitive the result is to your DoD and RTE assumptions.
Step 3 — Apply Chemistry and Use-Case Correction
Subsequently, determine your oversizing factor based on battery chemistry (LFP vs NMC vs NCA), use case (peak shaving vs backup vs grid services), and EOL capacity requirement. Reference the sizing guide table in Section 6 for starting-point percentages, then adjust based on site-specific factors including climate, cycling frequency, and interconnection limits.
Step 4 — Financial Validation: Model Both Scenarios
Finally, model the oversized vs precisely sized scenarios in a full project NPV and IRR analysis, incorporating ITC capture, degradation trajectory, load growth assumptions, and augmentation cost projections. As a result, you will arrive at the scenario that maximises risk-adjusted return while meeting contracted performance obligations. Choose the strategy with the superior risk-adjusted NPV — not the one that simply installs the most battery.
Conclusion: BESS Oversizing Is a Strategy, Not a Default
BESS oversizing is one of the most powerful tools in a storage developer’s arsenal — but only when applied with precision. When the economics support it, oversizing by 10–25% delivers longer cycle life, a built-in degradation buffer, greater resilience, higher solar self-consumption, and maximised ITC capture. Conversely, when applied without a sound load analysis and financial model, it simply commits capital to cells that will never discharge.
The right approach is always project-specific. Therefore, an LFP C&I peak shaving project with a 10-year capacity guarantee may need 15–20% BESS oversizing to meet EOL targets. A residential grid-tied backup system with low daily DoD requirements may need only 10%. An off-grid microgrid with strict autonomy requirements and no grid fallback may need 25–30%. Furthermore, as battery prices continue to fall, the break-even point between oversizing and augmentation will shift — making it essential to rerun the financial model on each new project rather than applying a fixed rule.
At Sunlith Energy, every BESS project we design goes through a rigorous sizing and degradation modelling process — using real interval load data, validated chemistry models, and financial sensitivity analysis. To learn more about how we approach BESS design, explore our BESS specifications guide, our Battery SoH estimation guide, or review the NLR Grid-Scale Battery Storage Technology Basics for independent technical context. The goal is never the largest battery — it is the right battery, sized correctly for your project’s lifetime.
Ready to size your BESS correctly? Contact the Sunlith Energy team for a technical consultation. We combine 14+ years of LiFePO4 expertise with advanced degradation modelling to design storage systems that perform at end of life, not just on commissioning day.