
Calendar Aging vs Cycle Aging in LFP Batteries
Every LFP battery in a BESS ages through two processes at once. One happens with the clock. The other happens with use. So calendar aging vs cycle aging is not really an either/or question. Also, both run all the time, and their effects stack together. Still, telling them apart matters. Still, each one responds to a different set of operating choices.
So this guide breaks calendar aging vs cycle aging down piece by piece, mechanism by mechanism. First, it covers what each process is on its own. Then it covers how the two interact in a real system. Finally, it covers how BESS operators separate the two in field data, since that is where the theory becomes useful.
| Quick Answer Calendar aging is time-based capacity loss that happens even when a battery is idle, driven mainly by state of charge and temperature. Cycle aging is use-based capacity loss driven by charge and discharge throughput, depth of discharge, and C-rate. Both processes run at once in a working BESS, and total degradation is roughly the sum of the two. |
Calendar Aging vs Cycle Aging: What Calendar Aging Is
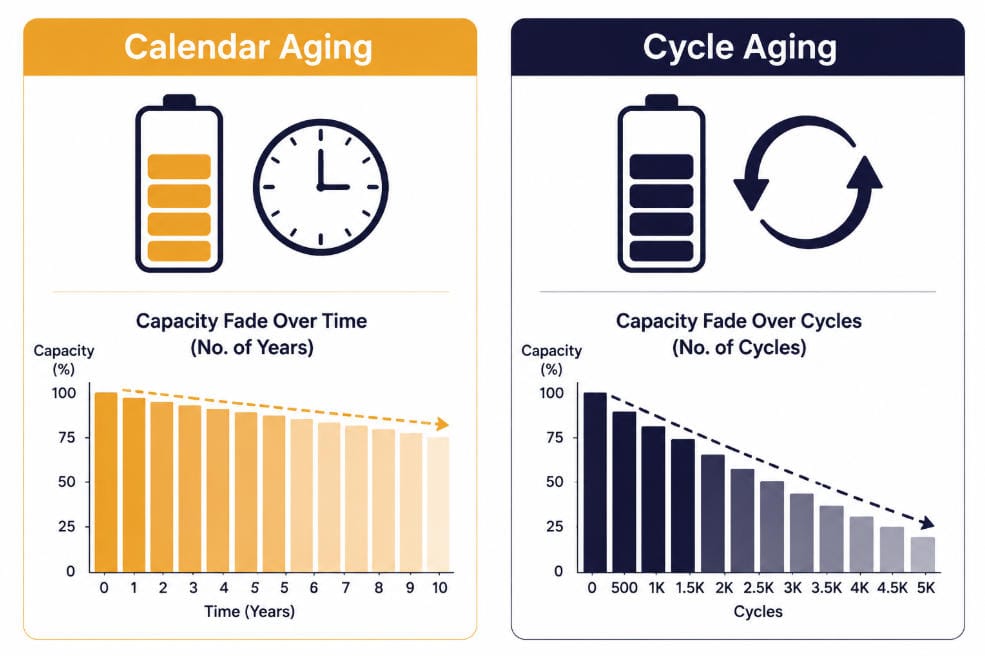
Calendar aging is capacity loss that happens purely with time. So it keeps going whether the battery is cycling, sitting idle, or somewhere in between. Think of it as a background process running underneath everything else.
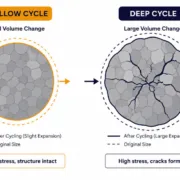
The root mechanism is growth of the solid electrolyte interphase, or SEI layer, on the anode. So this layer forms naturally, and it even serves a protective role at first. But it keeps growing slowly for the life of the cell. Then each time it thickens, it consumes lithium and electrolyte. That lithium never comes back.
So two variables drive how fast this happens. State of charge is the biggest one. Then temperature is close behind. A cell parked at high state of charge ages faster at rest than one held in a mid-range window. This is especially true near 100%. So does a cell sitting in a hot enclosure compared to a cool one.
So research backs this up clearly. A 2025 study on LFP pouch cells backs this up. It found that calendar aging is strongly governed by state of charge and temperature together. So higher values of either sped up capacity fade through faster SEI growth. Pressure, by contrast, had almost no measurable effect. Interestingly, the same study found something less obvious. Still, cells stored at 50% state of charge showed the largest rise in direct current resistance. This held true once they reached a given state of health, even though their capacity fade was not always the fastest. So that is a reminder that calendar aging vs cycle aging does not always degrade capacity and resistance in lockstep.
Calendar Aging vs Cycle Aging: What Cycle Aging Is
Cycle aging is capacity loss caused by the act of charging and discharging. Instead, it scales with how much energy passes through the cell, not just how much time goes by. A battery cycled hard sees more stress per day than one cycled gently. This holds even if both sit at the same average state of charge.
So several variables drive cycle aging. Depth of discharge is one. C-rate is another. Also, the state-of-charge range used during cycling matters too. A cell cycled between 20% and 80% takes less stress than one cycled between 0% and 100%. This holds even across the same number of cycles. Then temperature during active cycling also plays a role, on top of its calendar-aging effect at rest.
A long-running study on a commercial LFP and graphite cell ran cycle aging tests for 885 days. So it used 19 separate test points. Then these covered different combinations of temperature, C-rate, depth of discharge, and state-of-charge range. The results let researchers build a model that predicts cycle-driven fade from those four inputs. That kind of multi-variable model shows why cycle aging is harder to summarize in one sentence than calendar aging. So calendar aging vs cycle aging simply depends on more moving parts on the cycle side.
Cycle aging also tends to show up differently than calendar aging on a capacity curve. First, early cycles often cause a fast initial dip. Then fade slows into a steadier, more linear decline for a long stretch. Then late in life, fade can speed up again as the cell approaches end of life. Calendar aging, by contrast, tends to follow a smoother square-root-of-time pattern from the start.
How the Two Interact
Calendar aging vs cycle aging is a useful framing. But the two are not fully independent in practice. So a battery’s operating history shapes both at once. Take state of charge between cycles as an example. So it is itself set by how the cell was last used. That link between the two processes is one reason pure separation only works cleanly in a controlled lab setting.
Still, most aging models treat calendar and cycle aging as additive. Total degradation is modeled as roughly the calendar-aging contribution plus the cycle-aging contribution, calculated separately and then combined. So this additive approach is not perfectly accurate at the edges. But it holds up well enough to be the standard in both research and commercial degradation models.
One nuance is worth knowing here. But temperature drives both processes, and not always to the same degree. Research on large-format LFP cells built for stationary storage backs this up. So it found that temperature has the dominant effect on total aging. Still, the specific cycling protocol played a smaller secondary role. So keeping a system cool helps both pathways at once, even though the mechanisms underneath are different. For more on how temperature interacts with degradation broadly, see our guide on Battery Degradation in BESS: Causes, Mechanisms & Mitigation. It covers the full picture beyond calendar aging vs cycle aging alone.
Separating the Two in Real Field Data
In a lab, calendar aging and cycle aging can be isolated cleanly. So researchers run two sets of cells. One set only sits idle. The other only cycles. But in a live BESS, that kind of separation is not possible. So every cell has some combination of both happening constantly.
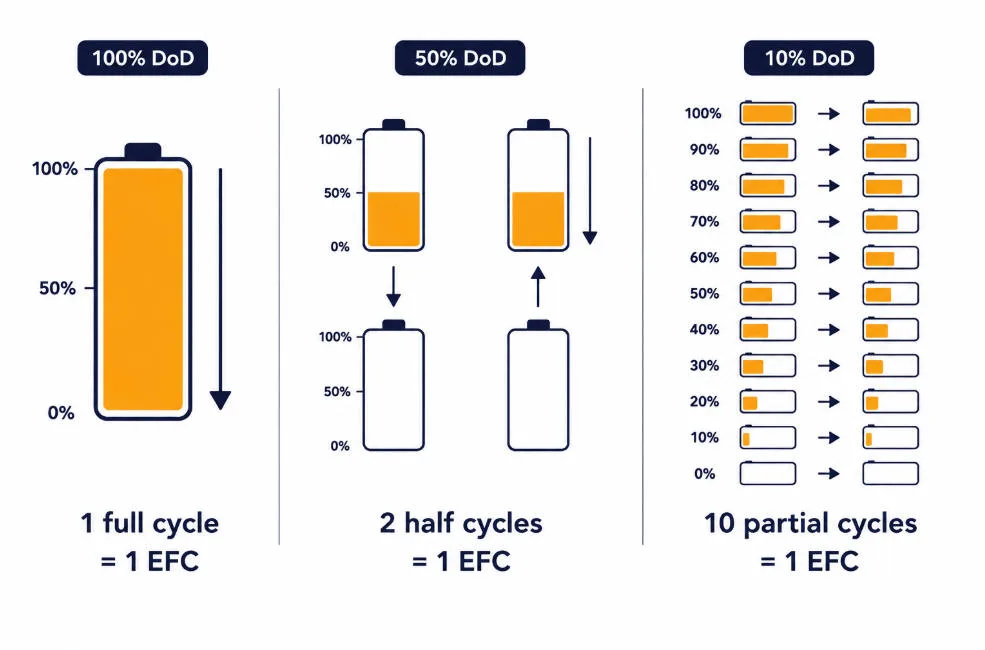
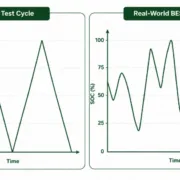
Operators handle this with a concept called the Equivalent Full Cycle, or EFC. An EFC converts partial cycles into a common unit based on energy throughput rather than raw cycle counts. So two 50% cycles count as one EFC. Ten 10% cycles also count as one EFC. So this puts shallow, frequent cycling and deep, occasional cycling on the same scale. That makes cycle-aging comparisons meaningful across very different usage patterns.
So with EFC as the throughput measure, operators can build a degradation model. It assigns a cycle-aging contribution per EFC and a calendar-aging contribution per unit of time. Then it sums the two. So LFP cells commonly rate between 2,500 and 9,000 EFC before reaching end-of-life thresholds. The exact number depends on the operating conditions and the EFC definition used. So that is a wide range. Still, cycling conditions like depth of discharge and C-rate largely explain why.
This EFC-based approach connects directly to how you track SOH in the field. Reference Performance Tests, run at fixed intervals, measure capacity and resistance directly. Between those tests, the EFC count and elapsed time both keep accumulating, feeding the additive model described above. For the full picture on tracking degradation as it happens, see our guide on BMS SOC Estimation Methods Explained. It covers how a BMS keeps that tracking accurate over time.
Modeling Calendar Aging vs Cycle Aging Together in a BESS
Most commercial degradation models treat calendar aging vs cycle aging as two curves added on top of each other. First, the calendar curve grows with elapsed time. Then the cycle curve grows with EFC count. At any point in a system’s life, total fade is close to the sum of both curves evaluated up to that point.
So this additive approach has a practical upside. It lets an operator run “what-if” scenarios without re-testing cells from scratch. Want to know how a change in dispatch strategy affects lifetime? Then increase the modeled EFC rate and hold the calendar term fixed. Want to know how a warmer siting location affects lifetime? Then adjust the temperature input feeding both curves and see how each one shifts.
Manufacturer degradation tables often build in this same logic, even when they present it as a single lookup chart. A table showing SOH by year and by cycling intensity is really just calendar aging vs cycle aging pre-combined into one surface. Reading the fine print on how that table was built tells you which usage pattern it assumes, which matters if your actual dispatch looks different.
Why the Distinction Matters for BESS Operators
Calendar aging vs cycle aging is not just an academic distinction. So calendar aging vs cycle aging changes what levers an operator actually has.
If calendar aging dominates a system’s degradation, the fix is mostly about resting state of charge and temperature. Idle capacity sitting at 100% SOC in a hot enclosure loses capacity every day, cycling or not. So that loss happens whether the asset is dispatched or parked. If cycle aging dominates instead, the fix is about how the system gets used. First, reducing depth of discharge helps. Then lowering C-rate helps too. Also, narrowing the SOC operating window targets cycle aging directly.
So most real systems have both pathways contributing. So the practical answer is usually “do both.” Keep resting SOC out of the high extreme when possible. Keep cells cool. Avoid unnecessary deep discharges. So none of these choices is exotic. What changes is which one matters most for a given system’s usage pattern. That depends on whether the system spends more of its life idle or more of its life cycling hard.
So application type is often the clearest signal. Take a solar-paired storage system as an example. It charges once a day, discharges once a day, and then sits mostly idle overnight. That pattern leans toward calendar-aging-dominant behavior. A frequency-regulation asset that cycles shallow and constant, day and night, leans toward cycle-aging-dominant behavior instead. So knowing which profile a system fits helps prioritize where to focus operating discipline.
Calendar Aging vs Cycle Aging: Quick Comparison
| Factor | Calendar Aging | Cycle Aging |
| Primary trigger | Time at rest | Charge/discharge throughput |
| Biggest driver | State of charge | Depth of discharge and C-rate |
| Secondary driver | Temperature | Temperature |
| Happens when idle? | Yes | No |
| Root mechanism | SEI growth at rest | SEI growth plus cycling stress |
| Typical fade pattern | Smooth, square-root-of-time | Fast early dip, then linear |
| Main mitigation | Avoid high resting SOC | Reduce DOD, C-rate, SOC range |
| Field measurement unit | Time (days, months) | Equivalent Full Cycles (EFC) |
Frequently Asked Questions
Can a battery have high cycle aging but low calendar aging?
Yes. A system cycled hard, rarely left at high state of charge, and kept cool can show cycle-driven fade as the dominant effect. So this pattern is common in frequency-regulation applications with constant, shallow cycling.
Does calendar aging stop once a battery starts cycling?
No. Calendar aging keeps happening in the background the entire time a battery exists, including during active use. Instead, cycle aging simply adds on top of it, not in place of it.
In calendar aging vs cycle aging, which one causes more capacity loss in a typical BESS?
It depends on the application. So systems that sit mostly idle at high SOC lean toward calendar-aging-dominant fade. Systems that cycle constantly, like frequency regulation assets, lean toward cycle-aging-dominant fade instead.
What is an Equivalent Full Cycle and why does it matter?
An EFC converts partial charge and discharge events into a standard unit based on energy throughput. So it lets operators compare cycle aging across very different usage patterns on the same scale. But raw cycle counts cannot do that on their own.
Is calendar aging vs cycle aging always split 50/50 in a real system?
No. Instead, the real split varies a lot by application and even by season. A system that sits idle through a hot summer may see calendar aging spike temporarily. Then it can settle back once cycling resumes and temperatures drop.
Further Reading
Battery Degradation in BESS: Causes, Mechanisms & Mitigation
BMS SOC Estimation Methods Explained: OCV vs Coulomb Counting vs Kalman Filter
Cold-Climate BESS Design: Discharge-Side DCIR and Premature Cutoffs





Trackbacks & Pingbacks
[…] the full picture on how SEI growth connects to calendar and cycle aging together, see our guide on Calendar Aging vs Cycle Aging in LFP Batteries. It covers the aging side of SEI layer growth and lithium plating in more […]
[…] For a deeper look at how to split these two effects in real data, see our full guide on Calendar Aging vs. Cycle Aging in LFP Batteries. […]
Leave a Reply
Want to join the discussion?Feel free to contribute!