

Cell Internal Resistance: What It Is, Why It Rises, and How to Measure It
| ⚡ Quick Answer: Cell Internal Resistance in Brief Cell internal resistance is the opposition a lithium-ion cell presents to current flow. It combines ohmic resistance (foils, tabs, electrolyte), charge-transfer polarization (the reaction barrier at the electrode surface), and diffusion polarization (ion movement inside the electrode). It is measured in milliohms, rises with age, cold temperature, and extreme state of charge, and directly governs heat generation, round-trip efficiency, and available power. ACIR, DCIR, and EIS are the three standard ways to measure it. |
What Is Cell Internal Resistance?
Every lithium-ion cell acts like a small resistor. It sits in series with an ideal voltage source. So when current flows, part of the cell’s energy turns into heat. It never reaches the terminals as usable power. This loss is called cell internal resistance, or Cell IR for short.
Cell IR is not one single part. Instead, it is a combined value. It captures several resistive and electrochemical processes happening at once. As a result, Cell IR changes with temperature, state of charge (SOC), and age. In fact, this is also why two test methods, ACIR and DCIR, can report different numbers for the same cell.
The Three Components of Cell Internal Resistance
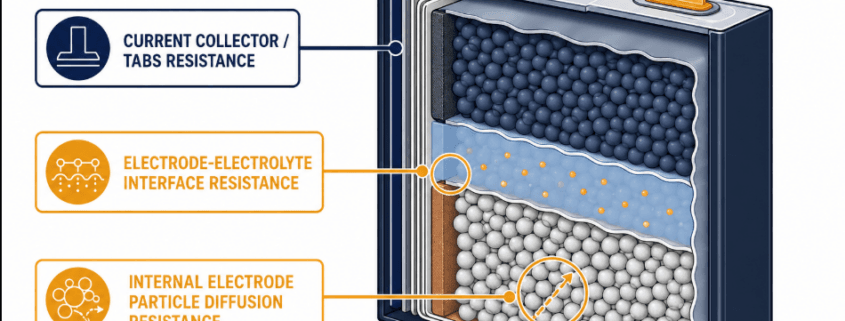
According to electrochemical impedance spectroscopy (EIS) research, cell internal resistance splits into three physical parts. Each part dominates over a different timescale.
| Component | What It Physically Represents | When It Dominates |
|---|---|---|
| Ohmic resistance | Current-collector foils, tabs, weld joints, separator, and electrolyte conductivity — a true, frequency-independent resistance | Instantaneous; measured directly by 1 kHz ACIR |
| Charge-transfer (activation) polarization | The energy barrier lithium ions must overcome to cross the electrode–electrolyte interface | Milliseconds to seconds into a current pulse |
| Diffusion (concentration) polarization | Ion movement and concentration gradients inside the solid electrode particles and electrolyte | Seconds to minutes; dominant during sustained load |
Ohmic resistance responds right away. Diffusion resistance, by contrast, builds up slowly over time. So the length of the test pulse changes what you actually measure. That, in short, is why a 1 kHz ACIR reading and a multi-second DCIR pulse test rarely agree on the same cell.
Key Takeaways: Cell Internal Resistance at a Glance
| Attribute | Summary |
|---|---|
| Typical unit | Milliohms (mΩ) for large-format cells; the value scales with electrode/tab area, so small cylindrical cells read much higher than large prismatic cells |
| Large-format LFP prismatic cells (280–314 Ah) | Commonly 0.15–0.5 mΩ ACIR at 1 kHz, 25 °C, ~30% SOC, varying by manufacturer and grade |
| Primary heat mechanism | Joule heating, P = I²R — heat rises with the square of current |
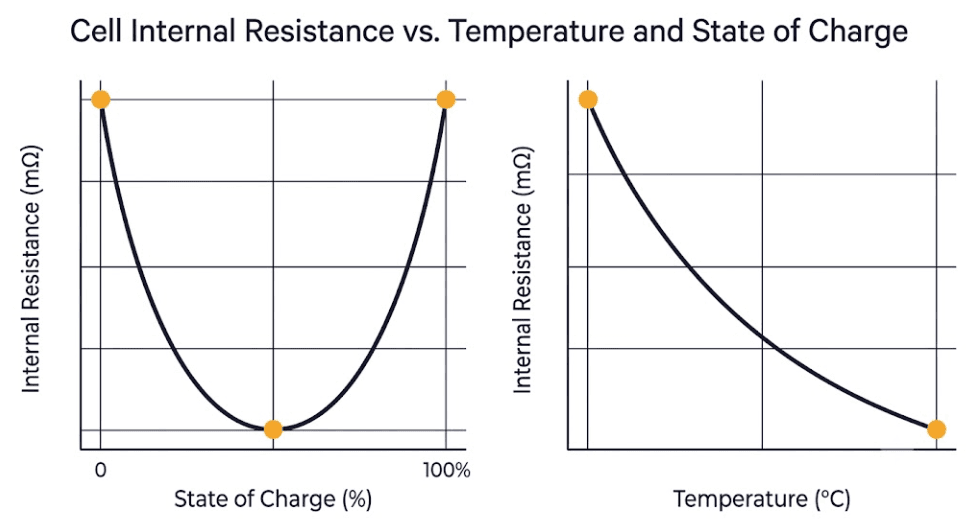
| Rises with | Cell aging/cycling, cold temperature, and SOC extremes (very low or very high) |
| Lowest at | Mid-range SOC (roughly 30–70%) and moderate temperature (roughly 15–35 °C) |
| Standard measurement methods | ACIR (1 kHz AC), DCIR (DC pulse), EIS (frequency sweep) |
| BMS relevance | Cell matching/sorting, thermal design margin, voltage-sag protection thresholds, SOH estimation |
Why Cell Internal Resistance Matters
1. How Cell Internal Resistance Generates Heat
Cell IR is the main source of heat inside an operating cell. Heat generation follows Joule’s law: P = I²R. In other words, heat rises with the square of current. So, even a small increase in resistance causes a large rise in thermal load at high C-rates. That is why, in practice, BESS designers usually size cooling systems around worst-case DCIR rather than nameplate ACIR.
2. Cell IR and Round-Trip Efficiency
Every milliohm of resistance turns some charge and discharge energy into waste heat. This happens instead of usable throughput. Consequently, this resistive loss is one of the main contributors to round-trip efficiency. It sits alongside power-conversion and thermal-management losses.
3. Cell IR, Available Power, and Voltage Sag
Under high current draw, resistance causes the terminal voltage to sag below the open-circuit voltage. If resistance is high enough, that sag can push the terminal voltage below an inverter’s cutoff threshold. This can happen even while real charge remains in the cell. In practice, then, it is a nuisance trip that looks like a capacity problem. In fact, it is a resistance problem.
4. Cell IR as a Leading Indicator of Aging
Cell IR, particularly DCIR, tends to rise before rated capacity visibly degrades. As the solid-electrolyte interphase (SEI) layer thickens with cycling, resistance climbs steadily. For this reason, resistance tracking is a standard input to State of Health (SOH) estimation.
What Changes Cell Internal Resistance
Cell IR is not a fixed number on a datasheet. Instead, it is a dynamic value that shifts with operating conditions. So, the factors below explain most of the variation seen in the field.
| Factor | Effect on Internal Resistance |
|---|---|
| Temperature | Resistance falls as temperature rises (faster ion mobility) and climbs sharply below roughly 0 °C; temperature swings of ±10 °C can shift measured resistance by around 20% |
| State of charge (SOC) | Follows a U-shaped curve — lowest in the mid-SOC range, rising again at very high and especially very low SOC as diffusion polarization increases |
| Aging / cycle count | Rises steadily over cell life as the SEI layer thickens and active material loses contact; DCIR growth of roughly 50–150% over a cell’s usable life is commonly reported, with LFP tending to show faster proportional resistance growth than NMC |
| C-rate / pulse duration | Longer, higher-current pulses capture more diffusion polarization, so DCIR measured over several seconds reads higher than a short 1 kHz ACIR snapshot on the same cell |
| Cell format and design | Large-format prismatic and pouch cells generally report lower resistance per cell than small cylindrical formats, because tab and current-collector area — not just chemistry — governs the ohmic term |
| Manufacturing quality / grade | Electrode coating uniformity, electrolyte wetting, and weld quality all shift the ohmic term; grading by resistance is a standard incoming-QC step for large-format LFP cells |
Cell Internal Resistance: LFP vs. Other Chemistries
Lithium iron phosphate (LFP) cells usually start life with low, stable resistance. This is true compared with nickel-based chemistries. In fact, it is one reason LFP has become the default choice for stationary BESS. However, field research on LFP cell aging shows resistance growth speeds up faster, in relative terms, than in NMC cells as cycling progresses. As a result, resistance trending is a more important monitoring parameter for LFP-based systems over a 10–15 year project life. For a full chemistry-level safety comparison, meanwhile, see NMC Battery vs LFP Safety: The Complete BESS Risk Breakdown.
How Cell Internal Resistance Is Measured
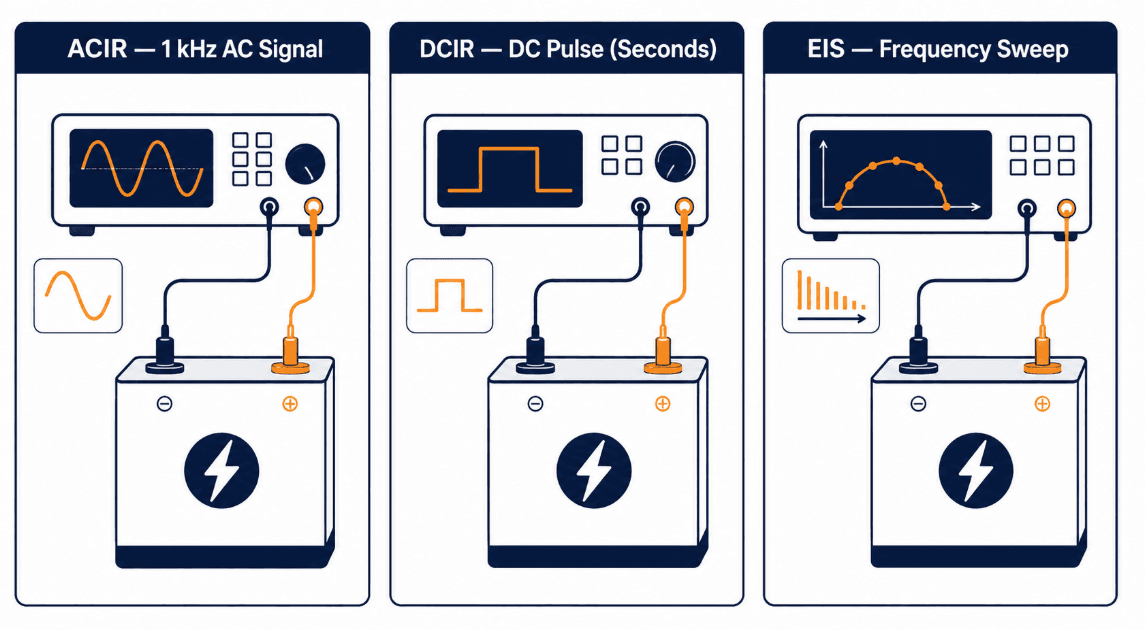
Three methods dominate industrial and BESS-integrator practice. Each one, however, answers a slightly different question. So this section compares all three, to help you choose the right one.
| Method | Signal Type | What It Captures | Typical Use |
|---|---|---|---|
| ACIR | Small AC current at 1 kHz | Ohmic resistance only — fast, repeatable, standardized | Incoming cell QC, sorting, and grading |
| DCIR | DC current step or pulse (seconds) | Ohmic + charge-transfer + diffusion polarization together | System-level power modeling, thermal design, real-world performance |
| EIS | AC sweep from mHz to tens of kHz | Separates all three components individually across frequency | Root-cause diagnostics, R&D, degradation-mechanism analysis |
ACIR is fast, taking under a second per cell. It is also highly repeatable. For this reason, it is the standard tool for grading incoming cells at the factory. DCIR, on the other hand, takes longer. But it reflects how a cell actually behaves under a real grid-power pulse. Therefore, it is the preferred input for thermal and power-delivery modeling, as Keysight’s ACIR and DCIR measurement methodology explains. EIS, meanwhile, is the slowest and most instrument-intensive method. So it is reserved for diagnostic work, where engineers need to know exactly which resistance component is degrading.
| Further technical detail This article covers the fundamentals shared by all three methods. For a full methodology breakdown, read The 1 kHz Window: ACIR for LFP Cell Grading and The Power Test: Why DCIR Is the True Measure of BESS Performance. |
Cell Internal Resistance in Pack and BMS Design
Cell IR and Cell Matching
Cells assembled into a series string should be matched on capacity and open-circuit voltage. However, they should also be matched on Cell IR. A cell with much higher resistance than its neighbors heats faster and sags further under load. It also drifts out of SOC balance faster. This, in turn, speeds up imbalance, even when the BMS works correctly.
Cell IR and Thermal Design Margin
Heat scales with resistance and the square of current. Therefore, thermal designers size cooling capacity around worst-case DCIR at end-of-life, not fresh-cell ACIR. Ignoring resistance growth over the warranty period, unfortunately, is a common cause of undersized thermal margin in early-life system designs.
SOH Estimation and Voltage-Sag Protection
DCIR climbs in a predictable way with age. Because of this, it is one of the standard inputs a BMS uses to estimate State of Health without a full capacity test. Resistance data, in addition, informs voltage-sag-aware cutoff thresholds. In turn, this prevents the BMS from tripping early on a cell that still has usable charge but momentarily high resistance under load.
Frequently Asked Questions
What is a normal cell internal resistance for a LiFePO4 cell?
It depends heavily on cell size. Large-format prismatic LFP cells used in BESS (280–314 Ah) typically measure around 0.15–0.5 mΩ ACIR at 25 °C and roughly 30% SOC. This, of course, varies by manufacturer and grade. Smaller cylindrical LFP cells, by contrast, have much less current-collector and tab area. So they commonly measure in the tens of milliohms.
Does cell internal resistance always increase with age?
In normal operation, yes. Resistance trends upward over a cell’s cycle life as the SEI layer thickens and internal contact degrades. However, the rate varies by chemistry, temperature history, and depth of discharge. Notably, a sudden, sharp resistance spike, rather than a gradual trend, is more likely to signal a fault than normal aging.
Why does Cell IR increase in cold weather?
Low temperature slows lithium-ion movement in the electrolyte. It also slows the electrochemical reactions at the electrode surface. Together, these effects raise both the ohmic and polarization parts of resistance. This is why cold-climate BESS enclosures use insulation and heating elements. As a result, cells stay within their optimal temperature band before drawing high power.
Is lower resistance always better?
Lower resistance generally means less heat, higher efficiency, and more available power. However, resistance is only one design variable among several. Some manufacturers, in fact, accept a modest resistance trade-off for a formulation that prioritizes thermal stability or cycle life. Overall, then, resistance should be evaluated alongside safety margin and cycle-life data, not in isolation.
Is ACIR or DCIR more accurate?
Neither is universally more accurate; they simply answer different questions. ACIR is the more repeatable, standardized snapshot of ohmic resistance. So it works best for comparing cells to each other. DCIR, on the other hand, reflects how the cell behaves under an actual power pulse. This, in turn, makes it the better input for system-level thermal and performance modeling.
Further Reading
- The Power Test: Why DCIR Is the True Measure of BESS Performance
- The 1 kHz Window: ACIR for LFP Cell Grading
- Demystifying LiFePO4 Battery Testing: How Manufacturers Grade Their Cells
- Battery Management System (BMS) Explained
- BMS SOC Estimation Methods Explained
- NMC Battery vs LFP Safety: The Complete BESS Risk Breakdown
- A Practical Guide to Battery Cycle Standards: DOD, SOH & EOL
- Understanding BESS Specifications: The Complete 2026 Guide