

Energy Arbitrage Battery Storage: The Real Economics
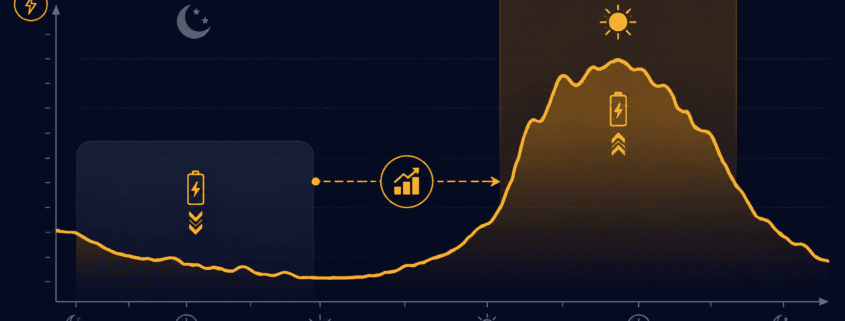
Energy arbitrage is the simplest revenue strategy in battery storage. A battery charges when electricity is cheap. Then, it discharges when electricity is expensive. The gap between those two prices is the spread. Capturing that spread is the entire strategy.
However, the full spread is never pure profit. Efficiency losses shrink it. Battery wear shrinks it further. This guide walks through how the strategy actually earns money, which costs cut into that revenue, and how to calculate the spread a project truly needs. For how this fits alongside other revenue streams, see our C&I BESS economics guide and our peak shaving vs. load shifting comparison.
How the Strategy Works
The pattern repeats daily. First, prices drop overnight, when demand is low. A battery charges during these cheap hours. Then, prices climb during the day. They often peak on hot afternoons, when air conditioning load surges. As a result, the battery discharges during these expensive hours, selling stored energy back at the higher rate.
Market structure shapes how much a project can actually earn. Deregulated markets tend to see more price swings, and those swings are what create opportunity in the first place. Grid congestion adds a second layer of upside. When transmission lines hit their limits, prices can vary sharply by location. So, a battery placed in the right zone can capture that gap too, on top of the daily time-based one.
Three Hidden Costs That Cut Into Your Margin
A visible price gap doesn’t automatically mean a profitable trade. Three factors quietly shrink that spread before it becomes real revenue.
- Round-trip efficienc:. No battery returns 100% of the electricity it stores. Lithium-ion systems typically land in the 83–92% range, depending on chemistry, C-rate, and cooling. In other words, 10 kWh charged in might only return 8.5–9.2 kWh usable. Because of this, the sell price has to clear the buy price by more than the visible gap suggests — not just match it.
- Battery degradation: Each cycle wears the battery down a little. In fact, one widely cited analysis of MISO market data found that degradation cut arbitrage revenue by roughly 12–46%, depending on the model used. This is easy to overlook, since it’s tempting to model efficiency losses and stop there.
- Market fees and upkeep: Wholesale trading usually carries transaction fees. Meanwhile, the storage system itself needs ongoing maintenance. Both come out of the spread before any of it reaches the bottom line.
Put together, these three costs mean the sticker-price spread overstates the real opportunity. So, a strategy needs enough room to absorb all three and still turn a profit.
Calculating the Spread You Actually Need
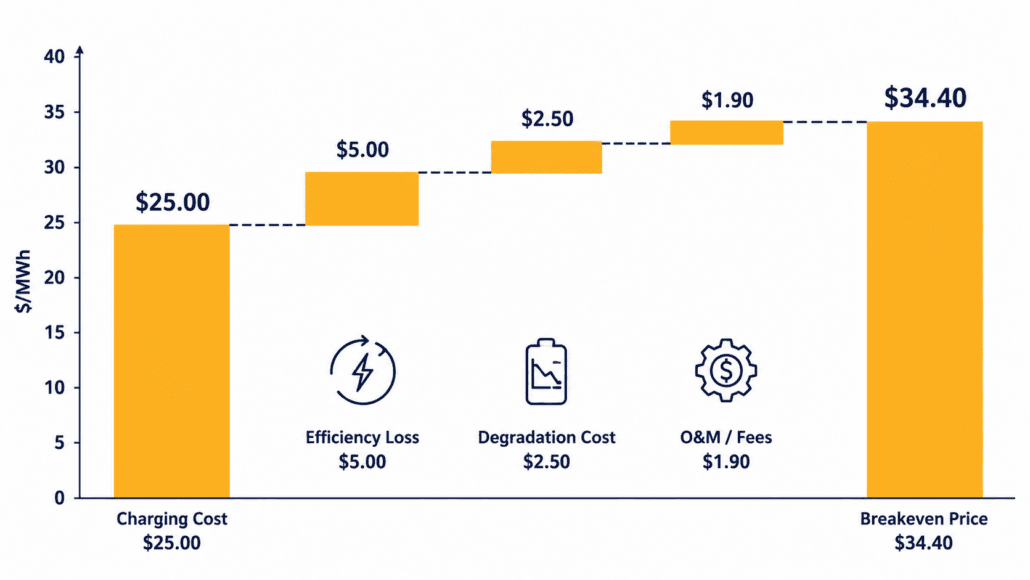
Think of this as your breakeven point — the minimum price gap before the strategy is worth pursuing. Here’s the formula:
Breakeven Spread ($/MWh) = (Charging Cost ÷ Round-Trip Efficiency) + Degradation Cost per Cycle + O&M/Fee Allocation
Here’s how that plays out in a simple, illustrative example:
| Metric | Value |
|---|---|
| Off-peak charging cost | $25/MWh |
| Round-trip efficiency | 88% |
| Effective charging cost | $25 ÷ 0.88 = $28.40/MWh |
| Degradation cost per cycle (illustrative) | $4/MWh |
| O&M and market fee allocation (illustrative) | $2/MWh |
| Breakeven discharge price | $28.40 + $4 + $2 = $34.40/MWh |
In this example, the battery needs to sell above $34.40/MWh just to break even. That’s well above the $25/MWh most people assume is the real bar. Anything captured beyond that line becomes genuine margin. This is exactly why a headline spread can look attractive on paper, yet still produce thin or negative returns in practice.
What Actually Moves the Market
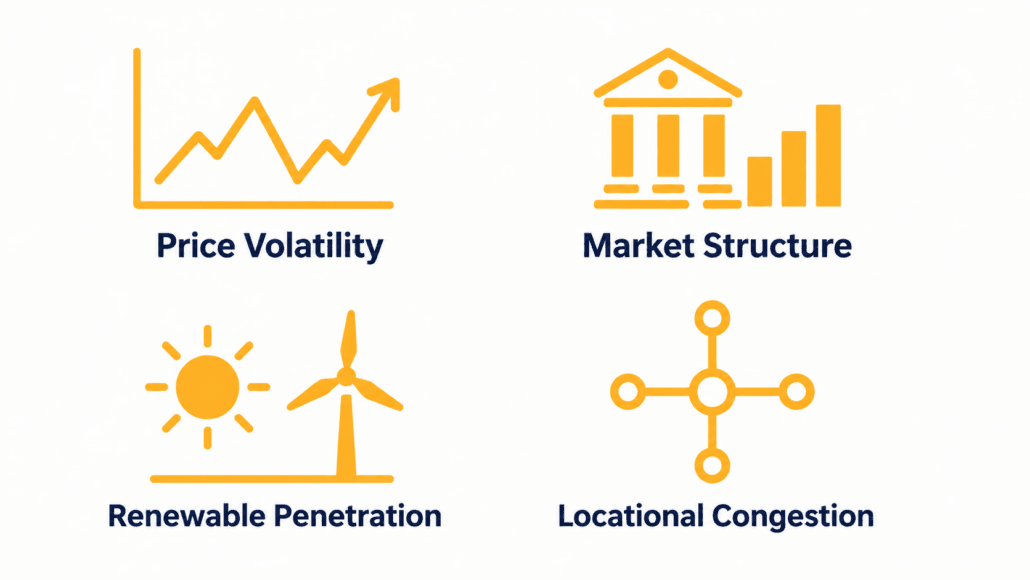
- Price volatility: The wider and more frequent the daily swings, the more spread there is to capture. Flat, low-volatility tariffs, on the other hand, produce little to no opportunity.
- Market structure: Deregulated wholesale markets generally offer more trading opportunity than fixed-tariff regulated ones.
- Renewable penetration: Heavy solar and wind generation can trigger fast, large price swings — sometimes even negative prices during oversupply — which widens the gap available to a well-positioned battery.
- Locational congestion: Grid bottlenecks create price differences between zones. Therefore, batteries sited near congestion points can capture that gap too, in addition to the daily one.
Analysts commonly benchmark this opportunity using “top-bottom” (TB) spreads — the gap between a market’s highest- and lowest-priced hours — as a standard way to compare potential across regions and durations. For broader market cost trends, the EIA’s battery storage market analysis is a useful reference point.
Why Most Projects Don’t Rely on This Alone
In practice, few BESS projects lean on a single revenue stream. Instead, layering in demand charge reduction, frequency regulation, or capacity payments spreads risk across multiple sources. As a result, this generally improves overall project economics compared to going it alone. See our peak shaving savings breakdown for how demand charge reduction stacks alongside this strategy, or our BESS cost per kWh and LCOS guide for the full project economics picture.
Merchant projects — ones relying entirely on wholesale price spreads with no fixed contract — carry real risk. Revenue depends on spreads that can shrink if market conditions or rules change. Contracted revenue, or a blended approach, generally reduces that exposure.
Energy Arbitrage Frequently Asked Questions
What is energy arbitrage in battery storage?
Energy arbitrage is the practice of charging a battery when electricity prices are low and discharging it when prices are high, capturing the price difference as revenue.
How much does round-trip efficiency affect energy arbitrage revenue?
Lithium-ion systems typically operate at 83–92% round-trip efficiency. That lost 8–17% means the discharge price must clear the charging cost by more than the visible spread suggests, not just match it.
Does battery degradation really cut into arbitrage profits?
Yes, substantially. Research using historical MISO market data found degradation reduced arbitrage revenue by roughly 12–46%, depending on the degradation model used. It’s one of the most commonly underestimated costs in arbitrage economics.
Is energy arbitrage alone enough to justify a BESS project?
Rarely as a standalone strategy. Most successful projects stack energy arbitrage with demand charge reduction, frequency regulation, or capacity payments to diversify revenue and improve overall project economics.
Next Steps
Ready to model your own numbers? Start with your local wholesale or time-of-use price spread. Then, apply the breakeven formula above, and compare it against your battery’s round-trip efficiency and degradation curve. For the full system cost picture, see our BESS cost per kWh and LCOS guide, or explore how this strategy stacks with other revenue streams in our C&I BESS economics guide.