
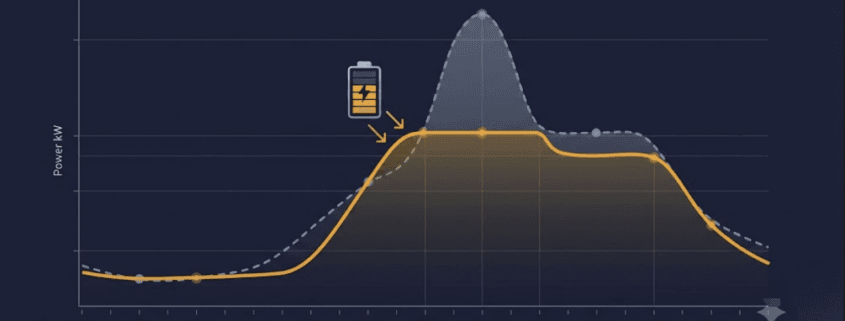

Peak Shaving Savings: How Much Can You Cut Demand Charges?
Peak shaving with a battery energy storage system typically cuts demand charges by 20–40%. That range depends on two things: your load profile, and your local utility’s tariff structure. So what does this look like in dollars? For a commercial site paying $15/kW in demand charges with a 500 kW peak, that’s often $1,500–$3,000 in monthly savings. In other words, a mid-size BESS can pay for itself in 4–7 years, even before you add other revenue streams on top.
This guide walks through exactly how those savings are calculated. First, we’ll cover what drives the range up or down. Then, we’ll work through a real example you can adapt to your own utility bill. If you’re new to the concept itself, start with our full peak shaving vs. load shifting guide — this page focuses specifically on the dollars.
How Demand Charges Work
Most commercial and industrial tariffs bill two separate components. First, energy charges (¢/kWh) are based on total consumption. Second, demand charges ($/kW) are based on your single highest usage spike in the billing period, usually measured over a 15- or 30-minute window. As a result, demand charges can account for 30–70% of a commercial electric bill. Unlike energy charges, one short spike sets the rate for the entire month, regardless of how briefly it occurred. For a deeper look at how utilities structure these rates, the EIA’s guide to electricity pricing factors is a useful primer. For the full mechanics of how demand is measured and billed for BESS applications specifically, see our complete peak shaving guide.
How Much Can Peak Shaving Actually Save?
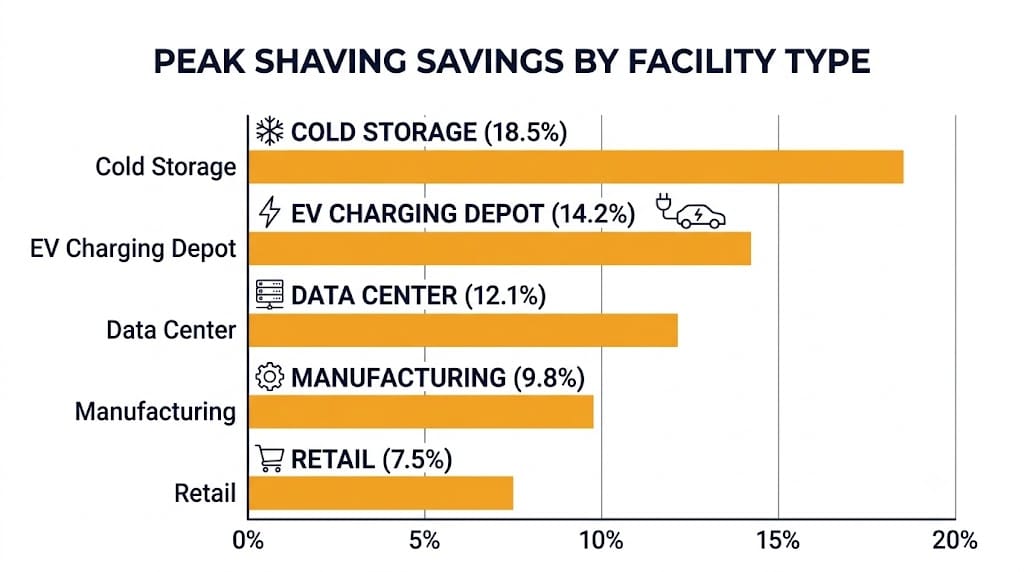
Savings scale with two factors: how “peaky” your load is, and how aggressive your local demand charge rate is. Specifically, sites with a high peak-to-average ratio see the largest percentage reduction. Why? Because a BESS only needs to shave the top of the curve, not carry the full load.
| Facility Type | Typical Peak-to-Average Ratio | Typical Demand Charge Reduction |
|---|---|---|
| Retail / light commercial | 1.3 – 1.6x | 15–25% |
| Manufacturing (batch processes) | 1.8 – 2.5x | 30–45% |
| Data center / server room | 1.1 – 1.3x | 10–15% |
| EV charging depot | 2.5 – 4x+ | 40–60% |
| Cold storage / refrigeration | 1.6 – 2.2x | 25–35% |
Manufacturing and EV charging sites tend to see the largest savings. That’s because their load spikes are sharp, short, and predictable — exactly the profile a BESS handles best. Data centers, on the other hand, run a comparatively flat load around the clock. Consequently, there’s simply less peak to shave.
Worked Example: Calculating Your Peak Shaving Savings
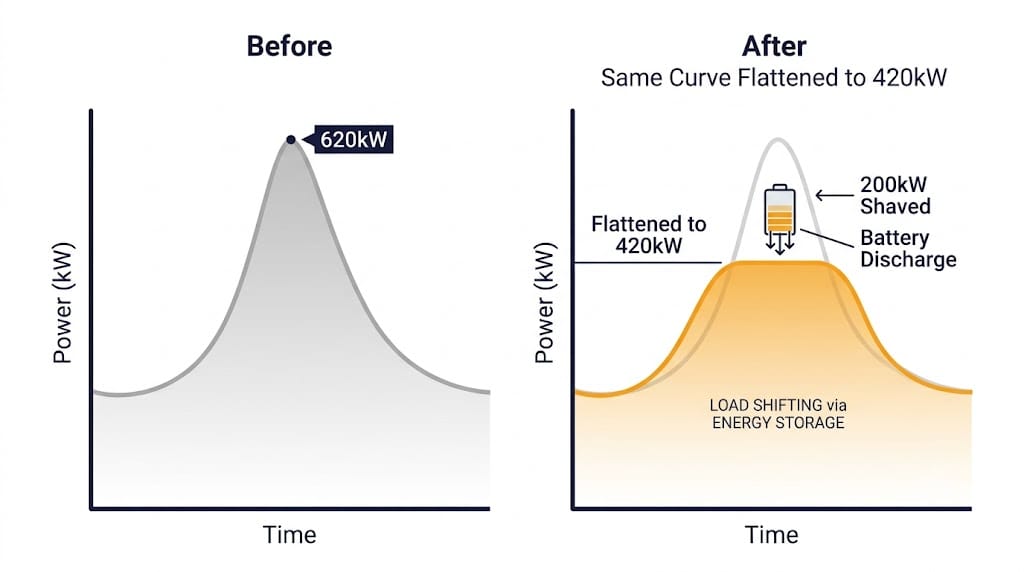
The core formula is simple:
Monthly Savings = (Peak Reduction, kW) × (Demand Charge Rate, $/kW)
Here’s how that plays out for a manufacturing site on a typical tariff. First, the site starts with a 620 kW peak demand and a $14.50/kW demand charge rate. Next, a 200 kW BESS shaves the peak down to 420 kW. As a result, the monthly savings come to 200 kW × $14.50 = $2,900. Over a year, that’s $34,800 in demand charge savings alone.
It’s worth noting this example doesn’t include energy arbitrage — charging during off-peak rates and discharging during on-peak ones. Nor does it include any grid services revenue. Both stack on top of pure demand charge savings; see our energy arbitrage guide for that math.
Payback Period and ROI
Payback period depends on three things: system cost per kWh, financing structure, and how many revenue streams the BESS is stacking. As a rough guide, here’s what demand-charge-only paybacks typically look like:
| BESS Size | Typical Installed Cost | Monthly Savings (demand only) | Simple Payback |
|---|---|---|---|
| 100 kWh / 50 kW | $35,000 – $50,000 | $700 – $1,000 | 4 – 6 years |
| 400 kWh / 200 kW | $140,000 – $190,000 | $2,500 – $3,200 | 4.5 – 6.5 years |
| 1 MWh / 500 kW | $320,000 – $420,000 | $6,000 – $8,500 | 4 – 5.5 years |
Installed cost ranges reflect LFP BESS pricing; see our BESS cost per kWh breakdown for the full cost model.
Layering in energy arbitrage or frequency regulation typically shortens payback by 20–35%, compared to demand-charge-only savings. For the full revenue-stacking model, see our C&I BESS economics guide.
What Affects Your Specific Savings
- Utility tariff structure. Flat demand rates and time-of-use (TOU) demand rates produce very different math. As a result, TOU sites often see larger savings, since their peaks align with the highest-priced windows. You can check your own utility’s rate structure using the DOE’s Utility Rate Database.
- Load profile predictability. Predictable, repeating peaks — like manufacturing shifts or EV charging schedules — are easier to shave accurately than erratic, one-off spikes.
- Battery sizing accuracy. An undersized BESS shaves less of the peak than needed. Conversely, an oversized one adds unnecessary capital cost without proportional savings. For this reason, proper sizing requires 12 months of interval data, not a single bill.
- Existing power factor correction. Sites without PF correction sometimes see apparent demand charge inflation that a BESS alone won’t fully resolve.
- Ratchet clauses. Some utilities set your demand charge based on the highest peak in the past 11–12 months, not just the current month. Therefore, this changes the payback calculation, and usually favors more aggressive peak shaving.
Frequently Asked Questions
How much does peak shaving save on electricity bills?
Most sites see 20–40% reductions in demand charges, which typically make up 30–70% of the total bill. However, actual savings depend on your peak-to-average load ratio and local demand charge rate.
What size battery do I need for peak shaving?
Size the power rating (kW) to your target peak reduction, and the energy capacity (kWh) to cover your typical peak duration — usually 1–3 hours for commercial sites. That said, a proper sizing study needs 12 months of 15-minute interval data.
Is peak shaving worth it for small commercial sites?
It depends. Sites with demand charges above $10/kW and a peak-to-average ratio over 1.5x generally see paybacks under 6 years. On the other hand, flatter-load sites — like most data centers — see smaller percentage savings.
Does peak shaving pay back faster with revenue stacking?
Yes. Adding energy arbitrage or grid services typically cuts payback by 20–35%, since the same battery capacity earns value in multiple ways across the day.
Next Steps
Ready to model your own savings? Start by pulling 12 months of interval data from your utility bill. Then, use our BESS cost per kWh guide to estimate installed cost, and apply the formula above to project payback. For the broader strategic picture, including how peak shaving compares to load shifting, see our complete peak shaving vs. load shifting guide.