
CAPEX vs LCOS: The BESS Cost Trap
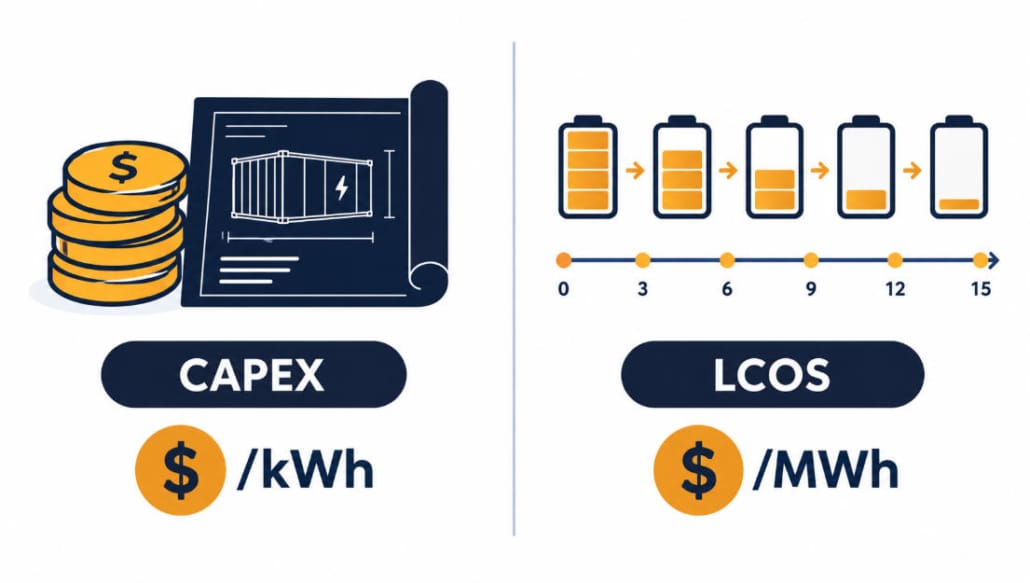
BESS CAPEX vs LCOS confusion causes real problems. It shows up whenever you compare storage quotes. CAPEX tells you what a system costs to build. LCOS, however, tells you the lifetime cost of each kWh it delivers. A project with attractive upfront CAPEX can still show a materially higher LCOS. This happens because it cycles infrequently, degrades faster than expected, or charges from expensive electricity.
| Quick Answer CAPEX and LCOS are different BESS cost metrics. CAPEX is the upfront installed cost per unit of battery capacity, commonly expressed in $/kWh. LCOS is the lifetime cost per unit of electricity discharged, commonly expressed in $/MWh or $/kWh delivered. For example, $65–$150/MWh equals $0.065–$0.150/kWh of delivered energy. |
Why CAPEX vs LCOS Gets Confused
Vendors, developers, and investors often use “cost per kWh” loosely. Sometimes they mean CAPEX. Sometimes they mean LCOS. In short, the two numbers measure very different things.
First, CAPEX ($/kWh) is simple. It is the upfront cost to install one kWh of storage. It covers battery cells, the power conversion system, balance of system, and EPC work.
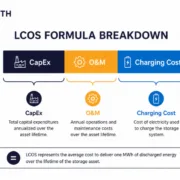
LCOS ($/kWh or $/MWh), by contrast, works differently. It is the lifetime cost of each kWh the system actually discharges. It folds in CAPEX, O&M, charging electricity, efficiency losses, and degradation.
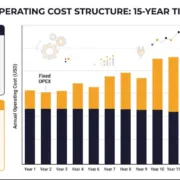
To see how annual O&M, charging cost, insurance, software, and future augmentation are modeled, read our BESS OPEX and operating cost model.
Mixing up CAPEX vs LCOS leads to bad comparisons. For instance, a system with low CAPEX can still post a high LCOS. This happens because it cycles rarely, degrades fast, or charges from costly power.
Which one should you use? Use CAPEX to compare build costs. Then use LCOS to compare long-term value. For a full LCOS walkthrough with formulas and worked examples, see our Cost of Storing Energy: BESS LCOS Calculator Guide.
To build an early-stage installed-cost estimate before comparing it with LCOS, see our BESS CAPEX calculation guide.
2025–2026 BESS Cost Benchmarks
Recent industry cost benchmarking gives a useful reality check for 2026 budgeting and LCOS modeling.
However, these are directional market benchmarks, not vendor-quote substitutes. Scope varies by duration, geography, delivery terms, inclusion of EPC and interconnection, tax treatment, warranty coverage, and augmentation assumptions.
Benchmark figures in this section reflect 2025–2026 industry analyses, including BloombergNEF, Ember, and Lazard reporting. Project-specific results may vary substantially by duration, location, operating profile, and procurement scope.
Utility-Scale CAPEX ($/kWh)
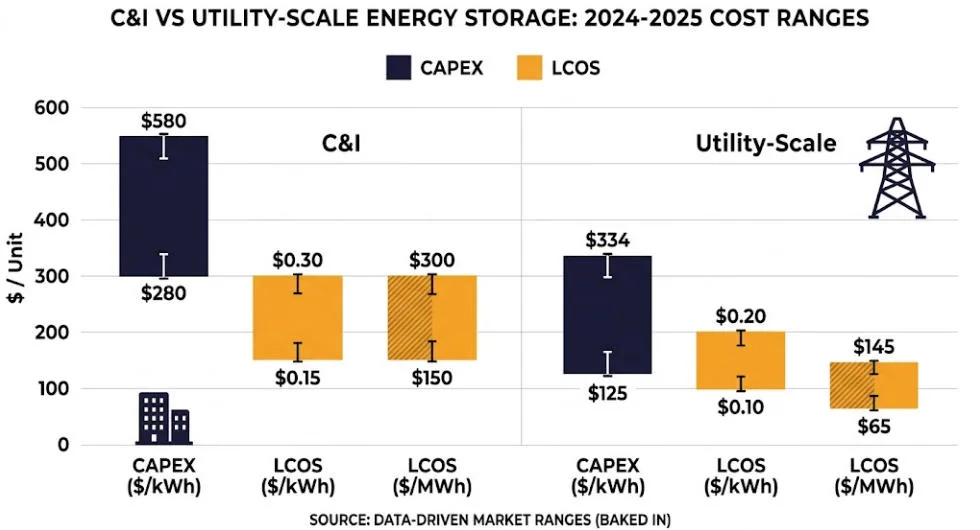
Global average turnkey BESS pricing landed near $117/kWh in 2025 (BloombergNEF, 2025). All-in 4-hour-plus utility projects outside the US and China, meanwhile, ran closer to $125/kWh in late 2025 (Ember, 2025). Utility-grade LFP cell prices sat around $55–$75/kWh. Full system costs run higher once PCS, balance of system, and EPC work get added.
C&I CAPEX ($/kWh)
Typical commercial and industrial installed costs run $250–$450/kWh, depending on duration, site complexity, and local balance-of-system costs. However, larger, standardized containerized C&I systems can fall toward $180–$300/kWh in favorable markets.
LCOS Benchmarks ($/MWh)
Well-sited 4-hour LFP projects often show an LCOS of $65–$150/MWh in 2025. The exact number depends on cycles, financing, and local electricity prices. Recent US utility-scale analysis, for example, covers unsubsidized 2-hour and 4-hour systems in 2026 (Lazard LCOS analysis, 2026). It points to a wider $210–$414/MWh range, varying by use case and region. These ranges show why context matters for BESS CAPEX vs LCOS comparisons. Once you factor in duration, cycles, and local costs, LCOS can shift by two to three times, even between projects with similar CAPEX.
The Simple BESS CAPEX vs LCOS Formula
For quick comparisons, use a simplified LCOS formula:
| LCOS ≈ Total Lifetime Costs ÷ Total Lifetime Energy Delivered |
Total Lifetime Costs equal CAPEX plus lifetime O&M plus lifetime charging cost, plus augmentation if needed, minus residual value.
Meanwhile, Total Lifetime Energy Delivered is every kWh discharged over the project life, after accounting for round-trip efficiency and degradation.
A more rigorous version discounts future costs and energy to present value. It also models degradation and augmentation explicitly. Discount rate matters here: a project with the same physical performance can show a higher LCOS when financing costs are higher, or when more of its usable energy arrives later in its life. You don’t need the full discounted formula for every conversation. But it’s the right mental model once you compare long-duration storage, different chemistries, or PPAs.
Worked Example: BESS CAPEX vs LCOS for a 1 MWh C&I System
Assume a 1 MWh, 2-hour C&I BESS with these simplified assumptions:
- CAPEX: $350,000 ($350/kWh)
- Life: 15 years
- Cycles: 250 per year
- Round-trip efficiency: 90%
- O&M: 1.5% of CAPEX per year (about $5,250/year)
- Average charging cost: $0.04/kWh
- No augmentation, no residual value
Step 1: Lifetime energy delivered. First, annual discharged energy comes to 1,000 kWh × 250 cycles × 0.90 efficiency, or 225,000 kWh per year. So, over 15 years, that totals 3,375,000 kWh.
Step 2: Lifetime costs. Next, add up the costs. CAPEX runs $350,000. Then O&M adds $78,750 over 15 years. Charging cost, once you account for the 90% efficiency, works out to about $150,000 over the same period. In total, lifetime cost lands near $578,750.
Step 3: Simple LCOS. Finally, divide $578,750 by 3,375,000 kWh. The result is roughly $0.17/kWh, or $171.5/MWh. That sits at the higher end of the C&I range, because fewer cycles and a higher installed cost pull it up.
Add battery degradation, such as 1.5% annual capacity fade, and lifetime energy falls. LCOS then rises. This is exactly why serious project models need to include degradation explicitly.
Instead of a full project-ROI model, this simplified example excludes financing, taxes, demand-charge savings, incentive value, replacement or augmentation, downtime, and end-of-life value. It illustrates LCOS only. LCOS tells you the cost of delivered stored electricity. It doesn’t by itself show whether demand-charge reduction, resilience, capacity payments, or ancillary-service revenue makes a C&I system profitable.
How to Lower Your LCOS
A handful of levers consistently pull LCOS down, regardless of chemistry or vendor:
- Increase effective cycles. Align operation with price signals so the battery cycles more often without excess degradation.
- Extend duration where it makes sense. For example, spreading CAPEX over more MWh often lowers LCOS, especially for 2 to 4-hour systems.
- Reduce charging cost. Instead, use time-of-use arbitrage, renewable co-location, or PPAs to lower the average price of the electricity you charge with.
- Choose low-degradation designs. LFP chemistry and strong thermal management, such as liquid cooling, help sustain throughput over 10 to 15-plus years. Since duration and C-rate choices drive this trade-off too, see our BESS C-Rate guide for how sizing affects cost and cycle life.
- Standardize BOS and EPC. Containerized, repeatable designs cut soft costs and installation risk, especially across multi-site C&I portfolios.
C&I vs Utility: BESS CAPEX vs LCOS Compared
| Aspect | C&I BESS | Utility-Scale BESS |
|---|---|---|
| Typical duration | 1–4 hours | 2–6+ hours |
| Main use cases | Demand charge reduction, backup, limited arbitrage | Renewable firming, capacity, ancillary services, arbitrage |
| Installed CAPEX | ~$250–$450/kWh (as low as $180–$300/kWh for large standardized systems) | ~$117–$125/kWh in selected global 4-hour-plus utility-scale benchmarks (2025); project quotes vary by region and scope |
| Cycles per year | Often 150–300 | Often 300–700+, depending on market |
| Typical LCOS | ~$150–$250/MWh, highly site-specific | ~$65–$150/MWh for well-sited 4-hour LFP; higher for shorter duration or costly regions |
| Primary value driver | Demand-charge management, resilience, tariff optimization, behind-the-meter value | Capacity, wholesale arbitrage, ancillary services, renewable integration |
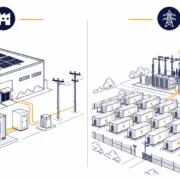
The pattern is consistent: because C&I projects usually carry higher CAPEX and run fewer cycles, LCOS lands higher per MWh than a utility project. However, that doesn’t make them worse investments. Instead, value comes from demand charge savings, resilience, and local grid services, not from LCOS alone.
What to Ask Your BESS Vendor
Move past headline dollar-per-kWh numbers by, instead, asking vendors and EPCs:
- What cycle profile, in cycles per year, depth of discharge, and C-rate, sits behind your cost and performance claims?
- What degradation warranty do you offer, such as percent capacity remaining after 10 years at a stated cycle rate?
- How do you model round-trip efficiency and auxiliary loads in your LCOS or yield estimates?
- Which CAPEX components are included: cells, PCS, balance of system, EPC, interconnection, commissioning, O&M?
- Can you provide an LCOS or cash-flow model with sensitivity to electricity price, cycles, and degradation?
Our BESS specifications guide walks through the datasheet numbers behind these questions. Because of that, it helps you compare vendor quotes on equal terms, not just a single headline figure. In practice, these questions push the conversation past upfront cost. They put it on a consistent, lifetime-value basis instead.
Frequently Asked Questions
Why Does BESS CAPEX vs LCOS Matter for My Project?
CAPEX only tells you what a system costs to build. LCOS, however, tells you what it actually costs to run over its life. Because of this, a project decision based on CAPEX alone can miss a system that costs less per kWh delivered over 15 years.
Is a Lower CAPEX Always Better for BESS?
Not necessarily. A lower-CAPEX system can still post a higher LCOS. Poor cycle life, fast degradation, or low efficiency can all cause this. So, always weigh CAPEX together with expected cycles, degradation, and O&M.
What Is a Good LCOS for BESS in 2026?
It depends on your market and use case. Well-sited 4-hour utility LFP projects commonly land around $65–$150/MWh in current industry benchmarking. C&I projects often sit higher, because fewer cycles and higher installed cost drive that gap. Even so, demand charge savings and resilience can still make them attractive.
How Does Degradation Affect BESS Cost Over Time?
Degradation shrinks the total energy a battery can deliver over its life. Because of that, LCOS rises if CAPEX and other costs hold steady. Even 1–2% annual capacity fade, for example, can meaningfully change your cost per kWh and your payback period.
Further Reading
- Cost of Storing Energy: BESS LCOS Calculator Guide
- BESS C-Rate: How Charge, Discharge Rate & Price Are Linked
- Understanding BESS Specifications: The Complete 2026 Guide
- The Economics of BESS: Calculate ROI for Your Energy Storage
- U.S. Department of Energy, Office of Electricity: energy storage program overview




Trackbacks & Pingbacks
[…] year, small fee changes can shift LCOS by tens of dollars per MWh. For deeper background, see our CAPEX vs LCOS guide and our BESS CAPEX calculation […]
[…] the full cost picture, pair this figure with an LCOS model. Our CAPEX vs LCOS guide explains why these two numbers differ. It also covers 2025-2026 price benchmarks. Our LCOS […]
[…] the difference between an upfront BESS quote in $/kWh and a lifetime LCOS value in $/MWh? Read our BESS CAPEX vs LCOS guide for a practical comparison of the two metrics, current benchmark context, and questions to ask a […]
Leave a Reply
Want to join the discussion?Feel free to contribute!