
BMS Cycle Counting Explained: EFC vs. Rainflow Algorithms
| ⚡ Quick Answer: What Is BMS Cycle Counting? BMS cycle counting turns raw current and SOC data into a wear metric. First, most systems track Ah/kWh throughput and convert it into Equivalent Full Cycles (EFC). Next, advanced platforms run a rainflow algorithm that splits a messy SOC trace into discrete, depth-weighted cycles. Finally, premium BMS platforms add a stress-weighted layer for C-rate and temperature. As a result, BMS cycle counting feeds SOH and RUL models, not just a simple warranty odometer. |
BMS cycle counting sounds simple. In reality, it is one of the least understood functions inside a Battery Management System. Every BESS datasheet shows a number like “6,000 cycles to 80% SOH.” Few buyers ask the obvious follow-up question: how does the BMS actually reach that count in the field? A grid-connected battery rarely swings cleanly from 100% to 0% and back. Instead, it moves up 12%, down 4%, up 20%, down 7%, dozens of times a day. Dispatch signals, solar variability, and frequency-regulation events all drive this pattern. Because of this, converting a noisy trace into one clean cycle number is a genuinely hard firmware problem.
This guide explains exactly how BMS cycle counting works today. First, we cover why simple threshold counting fails for BESS. Next, we break down the rainflow algorithm, borrowed from mechanical fatigue analysis. Then, we show how it solves the partial-cycle problem. Finally, we explain why the datasheet number rarely matches what your BMS reports in the field. For the state-estimation layer this article builds on, see our guides to BMS SOC estimation methods and BMS algorithms explained.
1. Why BMS Cycle Counting Is Harder Than It Sounds
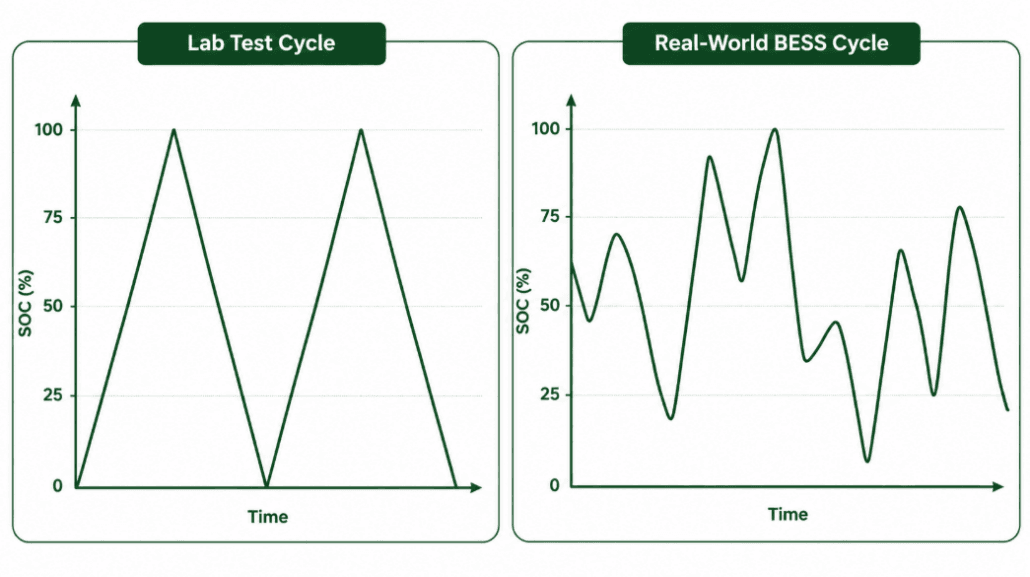
A cycle sounds easy to count: full charge, full discharge, done. However, “one cycle” has no single agreed definition outside the lab. A cell tested for its datasheet rating runs controlled, repeatable 100%–0% swings at a fixed C-rate and temperature. However, a cell inside a grid-connected BESS does nothing of the sort.
In practice, real-world SOC traces look like a jagged mountain range. Hundreds of small reversals happen every day. A dispatch instruction, a passing cloud, or a short frequency-regulation event can each trigger one. If BMS cycle counting logged every reversal as a cycle, one day of frequency regulation could register thousands of cycles. That would badly overstate wear. On the other hand, a threshold-only method misses just as much. A peak-shaving BESS that stays within the 20–80% band could show almost zero full cycles. Yet it may still have years of hard use behind it.
Neither outcome helps warranty tracking or SOH modelling. For this reason, BMS and EMS firmware rely on purpose-built cycle-counting algorithms instead of simple threshold logic. According to Energy-Storage.News, the industry still lacks one universal definition of a cycle. That gap is exactly why several competing counting methods exist side by side today.
2. Method 1: Simple Threshold-Based BMS Cycle Counting
The most basic form of BMS cycle counting sets two SOC thresholds, typically near 95% and 5%. Firmware then adds one to a counter each time the pack completes a full traverse between them. This approach is cheap to build and easy to explain. As a result, it shows up often in low-cost consumer BMS platforms.
For stationary BESS, though, this method falls short. Most BESS installations rarely complete a true top-to-bottom swing. Dispatch strategies deliberately avoid the SOC extremes to protect cycle life (see our guide on the 20/80 rule for batteries). Consequently, a system cycling between 20% and 80% SOC may never trigger a single “full cycle” under this method. That can happen even after years of heavy use. This undercount is precisely why the industry moved toward throughput-based BMS cycle counting instead.
3. Method 2: BMS Cycle Counting With Ah-Throughput (EFC)
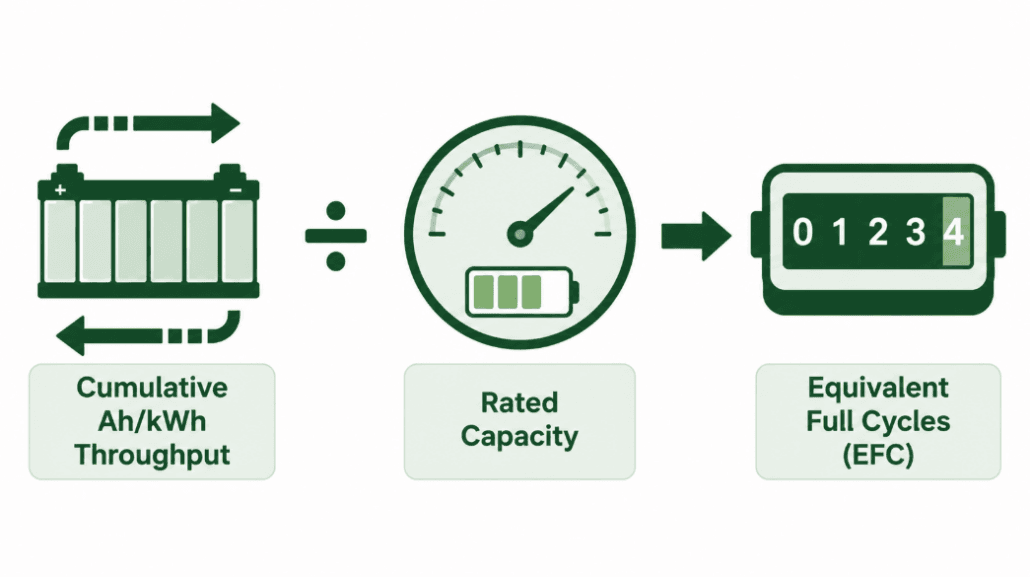
This method sits behind almost every commercial BESS warranty. Rather than watching for full swings, the BMS integrates current over time. It uses the same Coulomb-counting math built for SOC estimation. In other words, it adds up every amp-hour that flows in or out of the pack, in either direction. The BMS then divides that cumulative throughput by the pack’s rated capacity. The result is Equivalent Full Cycles, or EFC.
For example, a 500 kWh BESS that has processed 1,000 kWh of cumulative throughput has logged 2 EFC. This version of BMS cycle counting is simple. In addition, it is cheap to run continuously. And it works no matter how the pack is actually cycled, since it never requires a full 100–0% swing.
The Core Blind Spot of EFC Tracking
EFC has one well-known limitation: it treats every amp-hour the same, no matter how deep the swing was. As Energy-Storage.News notes, EFC alone cannot tell one cycle at 100% depth of discharge apart from two cycles at 50% DoD, or ten cycles at 10% DoD. Yet these three patterns stress the cell chemistry quite differently. So, shallow frequent cycling and deep infrequent cycling can log an identical EFC number. Even so, they age the pack at very different rates.
Many BMS platforms partly correct for this. They re-base the EFC denominator against current estimated capacity instead of nameplate capacity. That keeps the figure accurate as the pack fades. Even so, the core blind spot remains. This gap is exactly what rainflow-based BMS cycle counting was built to close.
4. Method 3: Rainflow-Based BMS Cycle Counting for Partial Cycles
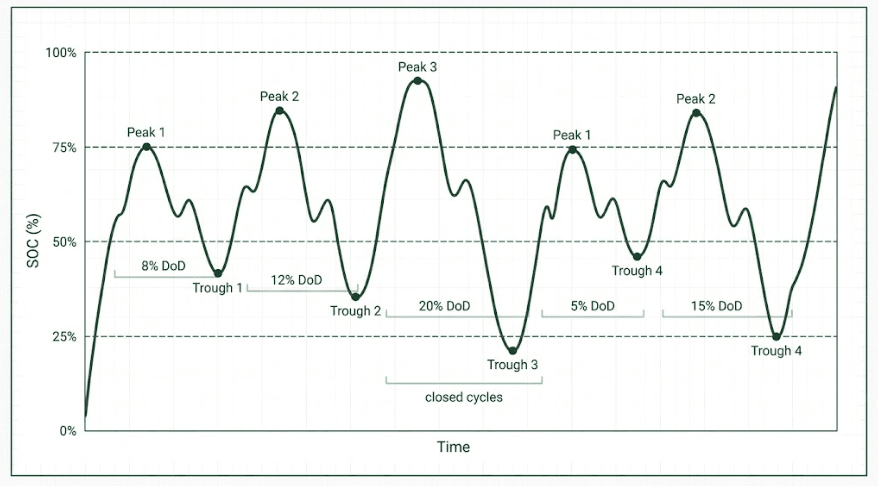
Rainflow counting began as a tool for mechanical fatigue analysis. Engineers used it to turn a noisy load history into a clean set of discrete stress cycles. Battery researchers later adapted the same logic for SOC traces. A peer-reviewed ScienceDirect study on grid-integrated BESS cycle counting confirms it as the most widely used cycle-counting algorithm in the field today. Rainflow-based BMS cycle counting solves what EFC cannot: it identifies the depth of every individual swing, not just the running total.
How the Rainflow Algorithm Works Step-by-Step
- The BMS records every local extremum in the SOC trace. In other words, it logs every point where the pack switches from charging to discharging, or back again.
- It then calculates the SOC delta between each set of three consecutive extrema.
- Consequently, If the middle delta is smaller than or equal to both neighbours, that segment counts as one closed, complete cycle at that specific depth.
- The BMS removes those two points. Then it repeats the comparison on the remaining trace — much like water draining off a stepped rooftop, which is where the algorithm gets its name.
- The output is a list of discrete cycles, each tagged with its own depth of discharge. For example: “47 cycles at ~80% DoD, 1,200 cycles at ~15% DoD,” instead of one flattened EFC figure.
One detail matters here: rainflow-based BMS cycle counting applies to depth of discharge, not absolute SOC. A swing from 80% down to 70% and a swing from 20% down to 10% both register as the same 10%-DoD event. Both count as equivalent stress. This lines up with how degradation models actually work, since most treat wear as a function of cycle depth, not the absolute SOC band it happens in.
Because rainflow output preserves depth data, it feeds straight into the DoD-weighted models used by SOH and RUL algorithms. That is the same layer we cover in our guide to BMS algorithms explained.
5. Method 4: Stress-Weighted BMS Cycle Counting
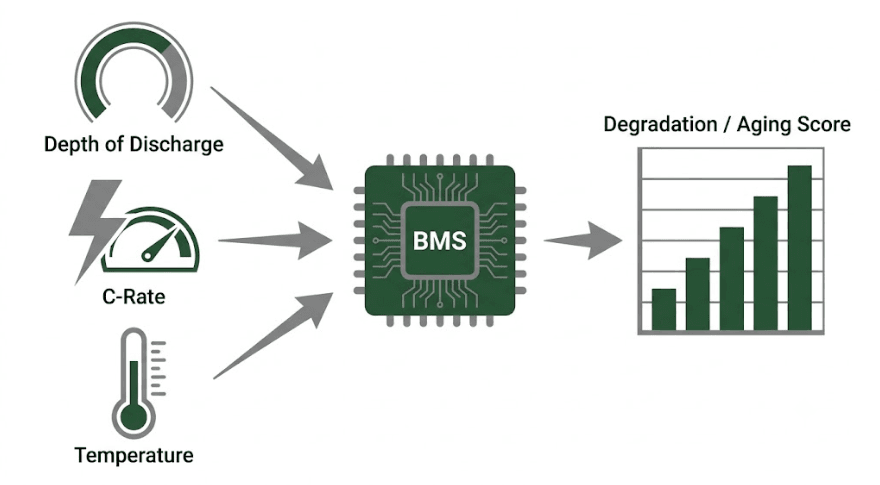
The most advanced BMS and EMS platforms push rainflow-based BMS cycle counting one step further. Instead of tallying cycles by depth alone, each identified cycle passes through a stress function. That function also factors in the C-rate and cell temperature present during that specific cycle. For instance, a 60%-DoD cycle at 0.2C and 25°C is far gentler than the same 60%-DoD cycle at 1.5C and 40°C. A stress-weighted counter reflects that difference clearly.
Rather than reporting a raw cycle count, this method builds a running “degradation” or “aging” score. That score, not the raw EFC number, feeds the most accurate RUL models. This is also why two BESS units with an identical EFC count can end up with very different projected remaining life.
6. How Firmware Filters Noise Before BMS Cycle Counting Begins
Raw current-sensor data is noisy. Grid-frequency jitter, brief EMS corrections, and normal sensor tolerance all create tiny, meaningless direction reversals in the SOC trace. Sometimes there are hundreds per hour. Feed that data straight into a rainflow algorithm, and the result is an explosion of trivial micro-cycles. Those micro-cycles overstate wear.
To prevent this, production BMS cycle counting firmware applies a minimum-delta, or hysteresis, threshold. A direction reversal only counts as a genuine local extremum once SOC has moved by some minimum amount, commonly 1–2%. Only then does it enter the counting algorithm. Firmware treats smaller reversals as noise and ignores them.
This single design choice separates a BMS that produces warranty-defensible cycle data from one that does not. Set the threshold too low, and cycle counts inflate from sensor noise. Set it too high, and the BMS misses genuine shallow cycling that still adds to ageing. Therefore, always ask your BMS supplier what hysteresis threshold their firmware applies. Datasheets rarely publish this figure. Yet it directly shapes every downstream SOH and warranty number.
7. Comparing the Four Cycle-Tracking Methods
| Method | What It Captures | DoD-Aware? | Best For | Main Limitation |
|---|---|---|---|---|
| Threshold counting | Full 95%–5% traverses only | No | Simple consumer packs | Badly undercounts partial-cycling BESS |
| Ah-throughput (EFC) | Cumulative current throughput | No | Warranty reporting, simple dispatch | Cannot distinguish deep vs. shallow cycling |
| Rainflow counting | Each discrete swing, by depth | Yes | SOH modelling, mixed dispatch profiles | More compute-intensive; needs clean extrema |
| Stress-weighted counting | Depth + C-rate + temperature | Yes | RUL prediction, warranty defensibility | Requires a validated stress model per cell type |
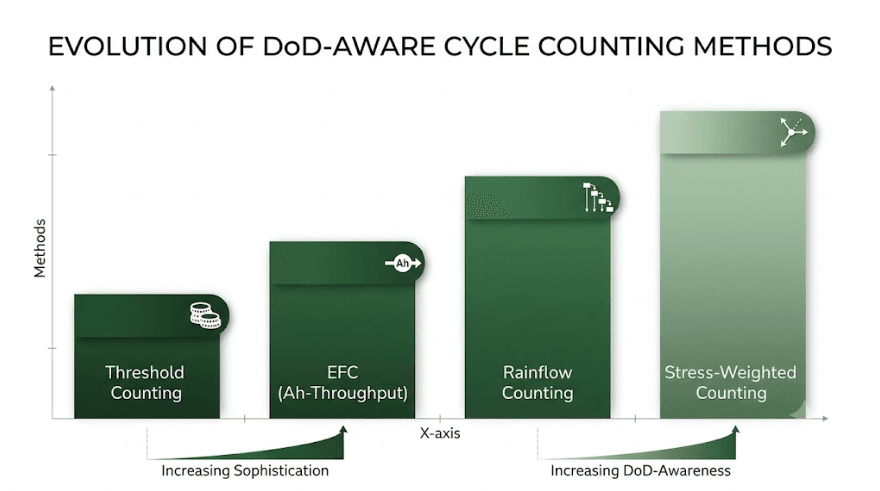
Most premium BMS platforms do not rely on just one method. Instead, they report EFC for simple dashboards and warranty tracking. Meanwhile, they run rainflow and stress-weighted BMS cycle counting in the background to feed SOH and RUL models. If a supplier says their BMS “counts cycles” without naming a method, ask directly. The gap between threshold counting and stress-weighted rainflow counting can differ by an order of magnitude in reported wear.
8. Why Datasheet Numbers Rarely Match Real-World Wear
A supplier’s “6,000 cycles to 80% SOH” claim is almost always a lab-derived EFC figure. Labs measure it under fixed, controlled conditions. That means a specific depth of discharge, often 80–90%, a specific C-rate, often 0.5C–1C, and a specific ambient temperature, often 25°C. Change any one of these variables in the field, and the real cycle-life outcome shifts. Sometimes it shifts substantially. We cover this relationship in detail in our guide to how temperature affects LFP battery cycle life. You can also model your own scenario with our battery cycle life calculator. For a broader reference on stationary lithium battery testing conditions, see IEC’s battery safety and performance standards.
In practice, your BMS’s in-field EFC or rainflow-weighted count measures a different operating profile than the datasheet number. A BESS running frequent shallow cycles at moderate temperature may outlive its rated cycle count in calendar terms. Meanwhile, one running deep cycles at high ambient temperature may fall short of it. Neither outcome means the datasheet number was wrong. It simply means BMS cycle counting and lab-rated cycle life measure two related, but distinct, things.
9. Questions to Ask About Your Supplier’s BMS Cycle Counting Method
- Which cycle-counting method does the firmware run: threshold, raw EFC, rainflow, or stress-weighted? A BMS that only reports raw EFC cannot show how deep-cycling patterns affect real degradation.
- What minimum-delta, or hysteresis, threshold filters noise before a reversal counts as a cycle? An unpublished or unreasonably low threshold can quietly inflate cycle counts.
- Is the EFC denominator based on nameplate capacity or current estimated capacity? Using nameplate capacity for the pack’s whole life understates EFC as the cell ages.
- Does the cycle-counting output feed the SOH and RUL algorithms directly, or are they calculated separately? Disconnected pipelines often cause inconsistent SOH and warranty reporting.
- What DoD, C-rate, and temperature conditions does the warranty’s rated cycle-life figure assume? This baseline is what your field cycle count should be compared against, not treated as a universal number.
For the broader procurement framework this fits into, see our guide to evaluating a BESS supplier’s BMS.
10. Worked Example: EFC vs. Rainflow Counting
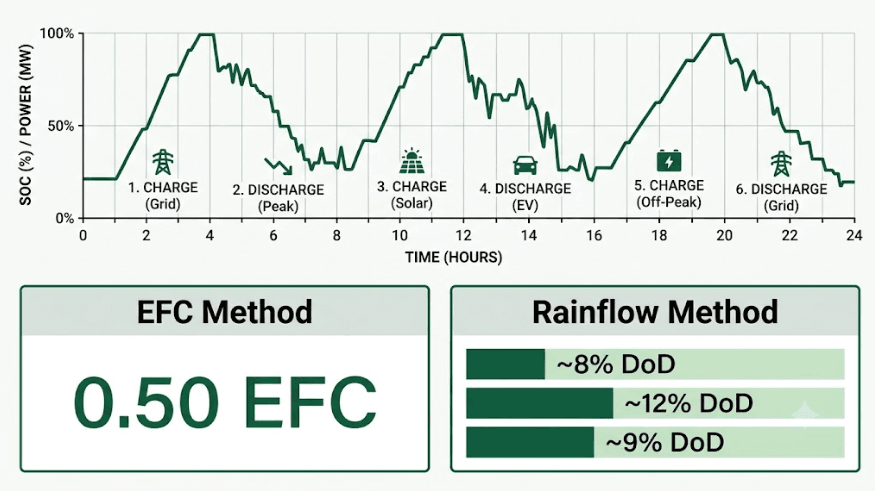
Consider a 100 kWh BESS module running a frequency-regulation profile for one day. It discharges 8 kWh, charges 5 kWh, discharges 12 kWh, charges 10 kWh, discharges 6 kWh, and charges 9 kWh. That adds up to 50 kWh of cumulative throughput.
| Method | Calculation | Result |
|---|---|---|
| Ah-throughput (EFC) | 50 kWh cumulative throughput ÷ 100 kWh rated capacity | 0.50 EFC for the day |
| Rainflow (illustrative) | Decomposed into 3 discrete cycles at ~8%, ~12%, ~9% DoD | 3 shallow cycles logged, none flattened into one number |
While both numbers are technically correct, they answer different questions. The 0.50 EFC figure shows up on a simple throughput dashboard and feeds warranty-cycle tracking. The rainflow breakdown, however, is what a SOH model actually needs. Three shallow 8–12% DoD cycles age a cell differently than one 50%-DoD cycle would. That holds true even though both scenarios can produce the same EFC total.
Conclusion: BMS Cycle Counting Is a Modelling Choice, Not a Simple Tally
A BMS does not count cycles the way a person counts laps around a track. Instead, it reconstructs a cycle metric from a continuous current and SOC trace. Each method trades simplicity for accuracy differently. Threshold counting is too crude for real BESS dispatch. EFC is the industry-standard warranty metric, yet it stays blind to depth of discharge. Rainflow-based BMS cycle counting recovers that missing depth information. It breaks messy, real-world SOC traces into discrete, weighted cycles. Stress-weighted counting goes further still. It folds in C-rate and temperature to build the aging score that actually drives accurate RUL prediction.
For BESS buyers and operators, the lesson is simple. Do not take “the BMS tracks cycle count” at face value. Instead, ask which method it uses. Ask how it filters sensor noise. And ask how that number connects to the SOH and RUL figures you will eventually rely on for warranty claims and second-life valuation.
| ☀️ Need a BMS Cycle Counting and SOH Methodology Review? SunLith Energy reviews BMS cycle counting implementation, EFC and rainflow methodology, and SOH-RUL linkage for BESS projects from 50 kWh upward. Contact us before you commit to a supplier. |
Frequently Asked Questions
How does BMS cycle counting work?
BMS cycle counting converts raw current and SOC data into a wear metric. Most systems first calculate cumulative Ah or kWh throughput. They then convert it into Equivalent Full Cycles. More advanced platforms add a rainflow algorithm on top. It breaks the SOC trace into discrete cycles at their true depth of discharge, filtering out small reversals below a set noise threshold.
What is an Equivalent Full Cycle (EFC) in BMS cycle counting?
An EFC is the standard unit behind most BMS cycle counting for warranty purposes. The BMS sums all Ah or kWh throughput — every unit of charge or discharge, in either direction. It then divides that total by the pack’s rated or current estimated capacity. Two cycles at 50% depth of discharge, and one cycle at 100% depth of discharge, both produce 1 EFC.
Why does depth of discharge matter if EFC already tracks total throughput?
Because EFC only tracks the total charge moved, not how it was distributed. A cell that goes through one deep 100%-DoD cycle experiences different stress than one that goes through ten shallow 10%-DoD cycles. Yet both can produce the same EFC total. Rainflow-based BMS cycle counting exists specifically to preserve this depth information for accurate SOH and RUL modelling.
What is rainflow counting, and why does BMS cycle counting use it?
Rainflow counting is an algorithm first built for mechanical fatigue analysis. Applied to a battery’s SOC trace, it identifies local turning points. It then pairs them into discrete, complete cycles at their true depth of discharge, instead of one flattened throughput number. This makes it the preferred method for BMS cycle counting on BESS platforms with irregular, partial-cycling dispatch profiles.
Why doesn’t my BESS ever seem to reach the cycle count on its datasheet?
The datasheet figure is almost always measured under fixed lab conditions: a specific depth of discharge, C-rate, and temperature. If your system cycles more shallowly, at a gentler C-rate, or at cooler temperatures, its real-world BMS cycle counting output accumulates more slowly than the lab figure implies. The reverse is true under harsher conditions.
Can two BESS units show the same cycle count but have different remaining life?
Yes. Raw EFC, and even simple cycle counts, do not capture the temperature and C-rate conditions each cycle occurred under. This is why advanced BMS cycle counting adds a stress-weighted layer. It produces a degradation score rather than a plain cycle number, which feeds more accurate Remaining Useful Life predictions than cycle count alone.






Trackbacks & Pingbacks
[…] use the simpler count. Your dispatch pattern still decides how fast the cells age, so learn how equivalent full cycles and throughput records are tracked in the […]
[…] BMS Cycle Counting Explained: EFC vs. Rainflow Algorithms […]
Leave a Reply
Want to join the discussion?Feel free to contribute!