

Active Balancing Topologies Compared: Which Circuit Fits Your BESS?
Every BMS spec sheet lists “active balancing” as a feature, but few explain which circuit is doing the work. Active balancing topologies vary widely in cost, speed, and design.
Active balancing topologies compared side by side reveal real trade-offs. Cost, speed, and how the pack gets built all differ by circuit.
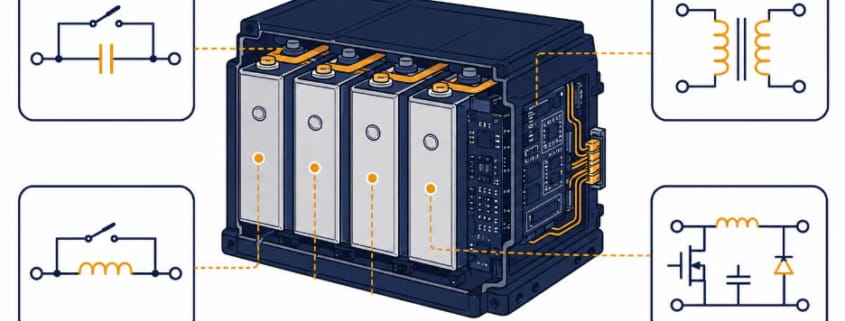
Switched-capacitor, switched-inductor, transformer-based, and DC-DC converter circuits all move charge between cells. They are not interchangeable.
Each one changes the balancing current you get and the board space it needs. Each one also scales differently as your string grows.
| Quick Answer Active balancing topologies compared: switched-capacitor and switched-inductor circuits are cheapest but only balance adjacent cells. Transformer-based (flyback) circuits balance any cell directly but cost more and add magnetic complexity. Bidirectional DC-DC converter circuits offer the best flexibility and efficiency at the highest component count. Most BESS packs use switched-inductor or converter-based designs. |
Key Takeaways
- Active balancing topologies fall into four hardware families: capacitor-based, inductor-based, transformer-based, and DC-DC converter-based. Each is defined by the element that temporarily stores energy during transfer.
- Switched-capacitor and switched-inductor circuits are the cheapest and simplest. Both are generally limited to adjacent-cell balancing, which slows equalization across a long string.
- Transformer-based (flyback) circuits can move charge between any two cells directly, improving equalization speed. They need bulky isolation transformers and usually aren’t bidirectional.
- A 2025 peer-reviewed prototype of a switched-inductor BMS balanced 22 series cells. It measured 84% energy transfer efficiency and a 908 mA balancing current, cutting a 1.18V pack imbalance to 0.47V in under 2.5 hours.
- For LFP BESS strings, the practical choice is usually switched-inductor circuits for cost-sensitive designs, or bidirectional DC-DC converter circuits where balancing speed matters more than component cost.
Why Active Balancing Topologies Matter for BESS Design
Passive balancing burns off excess charge as heat through a resistor. It’s cheap and simple, but it wastes energy and only ever removes charge — it can’t move it anywhere.
Active balancing takes a different approach. It transfers energy from higher-charge cells to lower-charge ones instead of dissipating it. Ideally, almost none of the pack’s total energy is lost in the process.
That difference matters more in a BESS than in a phone or laptop pack. A BESS string has hundreds of cells cycling daily for a decade or more. Manufacturing tolerances, thermal gradients across a rack, and uneven aging all pull cells apart in state of charge over time.
Active balancing topologies compared on paper all claim to solve this. In practice, the circuit topology decides more than the “active” label alone.
It sets how fast a pack re-balances, what it costs per cell, and whether the design scales to a 200+ cell string.
Switched-Capacitor Balancing: How It Works and Where It Fits
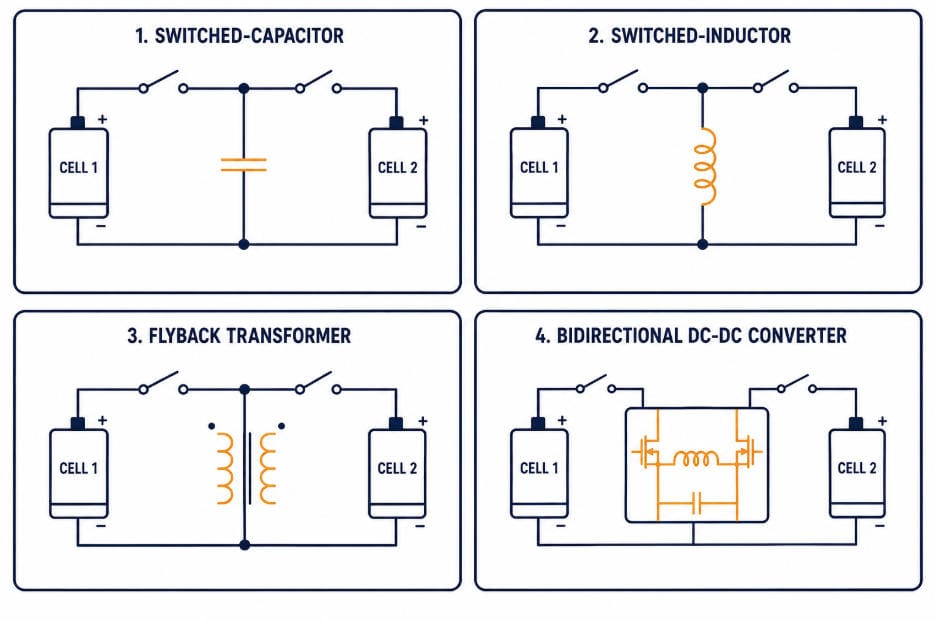
A switched-capacitor circuit places a capacitor between two adjacent cells, along with a set of switches. The switches alternately connect the capacitor across the higher-voltage cell, then the lower-voltage cell.
Each switching cycle moves a small packet of charge between the two.
This is the simplest active topology to build. It needs no inductor or transformer, uses relatively few components, and keeps voltage stress on the switches and capacitor low.
Among active balancing topologies, this is the simplest to build. The tradeoff is scope: a basic clocked switched-capacitor circuit only transfers energy between neighboring cells.
To move charge from one end of a long string to the other, it has to hop cell-by-cell. That’s slow, and it compounds switching losses at every hop.
Research on this topology also notes it works best when the voltage gap between cells is meaningful.
LFP’s voltage curve stays unusually flat across most of the state-of-charge range. A small SOC gap barely shows up as a voltage difference there, which limits how well a capacitor-based circuit can detect real imbalance.
Switched-Inductor Balancing: How It Works and Where It Fits
A switched-inductor circuit works similarly to a switched-capacitor one. It stores energy in an inductor’s magnetic field instead of a capacitor’s electric field.
Two switches alternate. One path pulls current from the higher-voltage cell into the inductor; the other pushes that stored energy into the lower-voltage cell.
A 2025 peer-reviewed study built and tested a switched-inductor BMS designed to balance 22 series-connected cells per submodule. The full-scale prototype measured an 84% energy transfer efficiency between adjacent cells and a 908 mA average balancing current.
On a real pack, the same prototype cut an initial 1.18V voltage difference down to 0.47V in about 2 hours and 30 minutes. The equivalent SOC gap fell from 91.2% to 49.4% over that window.
Switched-inductor is one of the more common active balancing topologies in EV and BESS designs. It shares the same adjacent-cell limitation as switched-capacitor designs, but inductors tolerate higher currents and voltage differentials better.
That’s part of why this topology shows up often in EV and stationary BMS designs needing faster balancing than a capacitor-only circuit delivers.
One caution applies here: a generic multi-chemistry BMS platform often runs conservative balancing current and thresholds that don’t suit LFP’s flat voltage curve well.
The circuit topology only pays off if the balancing algorithm triggers it at the right SOC threshold.
Transformer-Based Balancing: Flyback and Multi-Winding Topologies
Transformer-based circuits are the active balancing topologies best suited to non-adjacent cell balancing. They use a transformer, rather than a single capacitor or inductor, as the energy-storage element.
In the common flyback arrangement, energy from a higher-voltage cell is stored in the transformer core. It’s then released to a specific lower-voltage cell chosen by the control circuit.
The real advantage here is reach. The transformer can route energy to any winding, so these circuits can balance non-adjacent cells directly — cell 1 to cell 20, for example — without hopping through every cell in between.
That comes at a real cost. Isolation transformers are physically bulky compared to a capacitor or inductor, which matters in a dense BESS rack.
Multi-winding designs, where one primary winding serves many secondary cell taps, also demand tight parameter matching across every winding. That gets harder as cell count grows.
Flyback-based circuits also typically aren’t bidirectional the way DC-DC converter designs are. Energy generally flows one direction per switching cycle — source cell into the transformer, out to the target cell.
Despite the added cost, transformer-based balancing remains attractive where balancing speed across a long string matters more than per-cell hardware cost. Grid-scale BESS racks with hundreds of series cells are a plausible fit.
Bidirectional DC-DC Converter Balancing: The Newer Approach
Bidirectional DC-DC converters are the newest of the four active balancing topologies covered here. They use a full converter — often a buck-boost or bidirectional design — as the balancing circuit itself.
These circuits generally offer the best mix of efficiency, control precision, and bidirectional flexibility. Energy can flow either direction between any two points in the pack, under closed-loop control.
Recent research on bidirectional DC-DC converter balancing, including designs that route excess pack energy to an auxiliary battery, points to this family as the direction most new active-balancing research is heading.
The cost is component count and control complexity. A full converter needs more semiconductors, more sophisticated switching control, and more careful thermal design than a passive switched circuit.
For most BESS integrators, that cost is justified only when balancing speed or precision genuinely limits pack performance — not as a default upgrade.
Active Balancing Topologies Compared: Efficiency, Cost, and Scalability
Put side by side, the four hardware families trade off in predictable ways. No single topology wins on every axis.
| Topology | Balancing scope | Relative cost | Relative complexity | Typical fit |
| Switched-capacitor | Adjacent cells only | Lowest | Low | Small strings, cost-sensitive designs |
| Switched-inductor | Adjacent cells (higher current than capacitor) | Low–moderate | Moderate | EV packs, LFP BESS submodules |
| Transformer-based (flyback) | Any cell, non-adjacent | High | High (magnetic design, matching) | Long strings needing fast cross-pack balancing |
| DC-DC converter (bidirectional) | Any cell, bidirectional | Highest | Highest (control + semiconductors) | Precision-critical or research-grade designs |
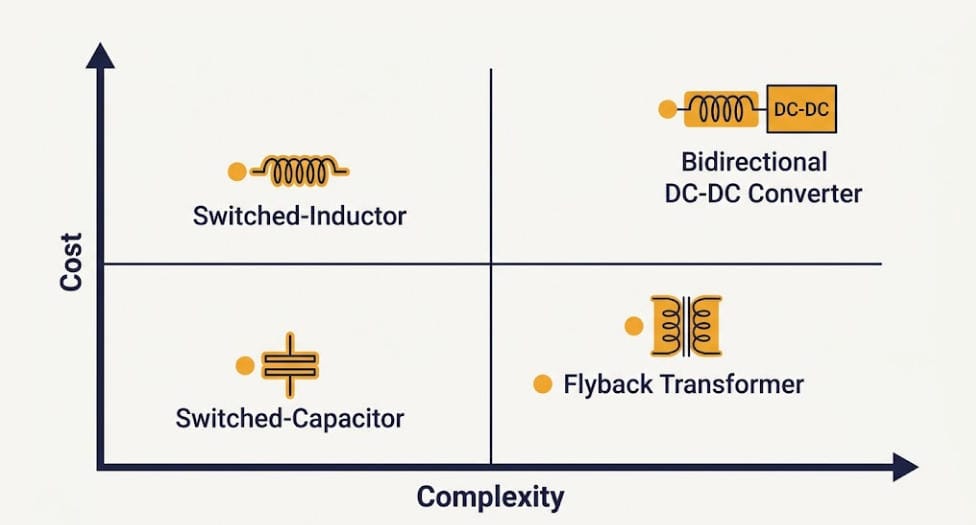
Cost and complexity climb together for a reason. Reaching non-adjacent cells, or making energy flow bidirectionally, both need more active control over the switching network — not just a bigger version of the same simple circuit.
Choosing Among Active Balancing Topologies for BESS
Weighing active balancing topologies for most utility-scale and C&I LFP BESS designs, switched-inductor circuits remain the practical default. They deliver meaningfully higher balancing current than a capacitor-based design, at a cost most BMS suppliers can integrate at scale.
Transformer-based or DC-DC converter circuits earn their added cost in two situations: very long strings where adjacent-cell hopping slows equalization, or applications where balancing current itself needs to be large enough to matter for pack-level performance.
Whichever topology a supplier uses, the hardware only matters if the control logic triggers it correctly. See our guide on BMS algorithms for how balancing decisions actually get made.
And see our BMS for LiFePO4 batteries guide for the balancing-current and threshold questions worth asking a supplier directly.
Frequently Asked Questions
Is active balancing always better than passive balancing for BESS?
Not always. Active balancing avoids wasting energy as heat and corrects larger imbalances faster, which matters for high-cycle BESS applications.
But it adds cost and complexity that isn’t justified for small residential systems with high cell quality and low cycle frequency. Passive balancing is often the more practical choice there.
Which active balancing topologies are most common in BESS packs today?
Switched-inductor circuits are common in current EV and BESS BMS designs. They offer meaningfully higher balancing current than switched-capacitor circuits at a moderate cost increase.
Transformer-based and DC-DC converter circuits appear more often in research prototypes and higher-end designs, where balancing speed matters more than component cost.
Why don’t switched-capacitor circuits work well with LFP cells?
LFP’s voltage curve stays nearly flat across most of the state-of-charge range. A capacitor-based circuit senses and acts on voltage differences.
So a real SOC gap between LFP cells can show up as only a tiny voltage difference. That limits how much genuine imbalance the circuit can detect and correct.
Can a BMS combine more than one balancing topology?
Yes. Some designs pair two active balancing topologies — a fast adjacent-cell method like switched-inductor with a slower non-adjacent method for periodic full-pack equalization. This hybrid trades added control complexity for better overall balancing coverage.
How fast should active balancing correct a real imbalance?
There’s no universal target — it depends on balancing current and pack size.
As a reference point, a peer-reviewed 22-cell switched-inductor prototype reduced a 1.18V imbalance to 0.47V in about 2.5 hours, at a measured 908 mA balancing current. Slower or faster designs are both normal, depending on the topology and current rating chosen.
Further Reading
Battery Management System (BMS) Explained
BMS for LiFePO4 Batteries: Requirements, Parameters, and What to Check Before You Buy
BMS Algorithms Explained: SOH Estimation, SoP, SoE, Cell Balancing, and Safety Diagnostics for BESS

Flow-Based Market Coupling & Grid Congestion: How TSO Bottlenecks Shape BESS Dispatch in Central Europe
Central Europe’s power market no longer clears prices on simple, static border limits. Since June 2022, thirteen countries in the Core region have used flow-based market coupling to set day-ahead prices. This method models the physical grid, not just contract borders.
It has made transmission bottlenecks visible in a new way. Redispatch is the fix TSOs use when the market can’t physically deliver.
That fix has become one of the fastest-growing costs in European electricity bills. BESS developers need to understand how flow-based market coupling exposes congestion, and where storage can relieve it.
That understanding is now central to the investment case in Germany, Austria, and their Core-region neighbors.
| Quick Answer Flow-based market coupling is the day-ahead pricing method used across Central Europe’s Core region since June 2022. It replaces flat cross-border limits with a physics-based model of grid constraints. When those constraints near their limits, TSOs must redispatch power. Localized BESS can relieve that congestion directly. |
Key Takeaways
- Flow-based market coupling models real grid limits, called critical network elements, instead of flat cross-border caps. That is why congestion inside bidding zones, not just at borders, now drives market outcomes.
- Germany’s total grid congestion management costs have climbed sharply. They rose from about €187 million a decade ago to roughly €2.95 billion in 2024, and about €3.07 billion in 2025, per Bundesnetzagentur/SMARD data.
- Wind-heavy northern Germany and load-heavy southern Germany sit on opposite ends of a constrained corridor. The 2018 Germany-Austria bidding zone split was a direct response to the loop flows this mismatch caused across Poland, Czechia, and Slovakia.
- TSOs are now deploying transmission-connected battery storage as “storage-as-transmission-assets.” These projects are moving from pilot to rollout on the German grid, targeting the corridors with the highest redispatch volumes.
- Academic modeling shows preventive congestion management alone rarely clears as a standalone BESS business case. Revenue stacking with balancing and wholesale markets is what makes the economics work.
What Flow-Based Market Coupling Actually Does
Before 2015, most European day-ahead markets cleared against net transfer capacity, or NTC. This method set one fixed MW limit per border. It ignored what was happening elsewhere on the grid.
NTC is simple to run, but it gets the physics wrong. Electricity does not follow contract paths. It flows along the path of least resistance across a meshed AC network.
Flow-based market coupling replaces that fiction with a real physical model. It centers on critical network elements, or CNECs — the specific lines and transformers whose loading actually limits trade.
For each CNEC, TSOs calculate power transfer distribution factors against every bidding zone. Together, these form a “flow-based domain.”
The market-clearing algorithm treats this domain as its real constraint set. That replaces a string of separate bilateral limits.
The Core Capacity Calculation Region covers Germany, France, the Benelux countries, Austria, Poland, Czechia, Slovakia, Hungary, Slovenia, Croatia, and Romania.
This region went live with day-ahead flow-based market coupling on 8 June 2022. It built on a Central Western Europe pilot that had run since May 2015.
For BESS operators, the practical effect is simple. Market prices in the Core region now reflect grid physics far more closely than they did a decade ago.
But the model still can’t fully replace physical intervention. When a network element overloads after the market has cleared, someone still has to act. That gap is where redispatch, and storage, comes in.
Why TSOs Still Hit Bottlenecks Under Flow-Based Market Coupling
Germany’s grid shows the structural problem clearly. Wind generation is concentrated in the north. Turbines run offshore in the Baltic and North Seas, and onshore across the northern plains.
The largest industrial and urban load centers sit in the south and west. Conventional generation there, including nuclear, has been retired fastest.
Moving that northern power south needs corridor capacity. In many hours, that capacity simply doesn’t exist yet.
Until 2018, Germany, Austria, and Luxembourg formed one bidding zone. The market cleared huge volumes of scheduled trade between German wind and Austrian demand.
It never priced the physical constraint of actually delivering that power. Electricity that couldn’t take the direct path flowed instead through neighboring grids.
It moved through Poland, Czechia, Slovakia, and Hungary as unplanned “loop flow.” Those TSOs then had to intervene to protect their own networks.
After years of complaints to the EU’s Agency for the Cooperation of Energy Regulators, the joint zone split on 1 October 2018.
That split introduced an explicit bidding zone border and congestion management at the Germany-Austria interconnection.
Post-split research on cross-border flows found real gains. The split reduced unplanned flows across the Germany-Austria, Czech, and Slovak borders.
But Poland saw unplanned flows increase over the same period. Central Europe’s grid is interconnected enough that a fix at one border can shift pressure elsewhere.
The underlying mismatch between renewable generation and demand geography hasn’t gone away. Flow-based market coupling just makes its cost visible, instead of absorbing it silently.
The Cost of Congestion: Redispatch Spending Under Flow-Based Market Coupling
Redispatch happens after the market clears. Day-ahead and intraday trading produce a dispatch pattern that fits the flow-based domain.
But real-time conditions change: forecasts update, outages happen, grid topology shifts. A specific network element can still push toward its physical limit.
TSOs then pay generators to cut output in the oversupplied area. They pay others to raise output where the power is needed. In effect, they re-solve part of the dispatch problem after the market has already closed.
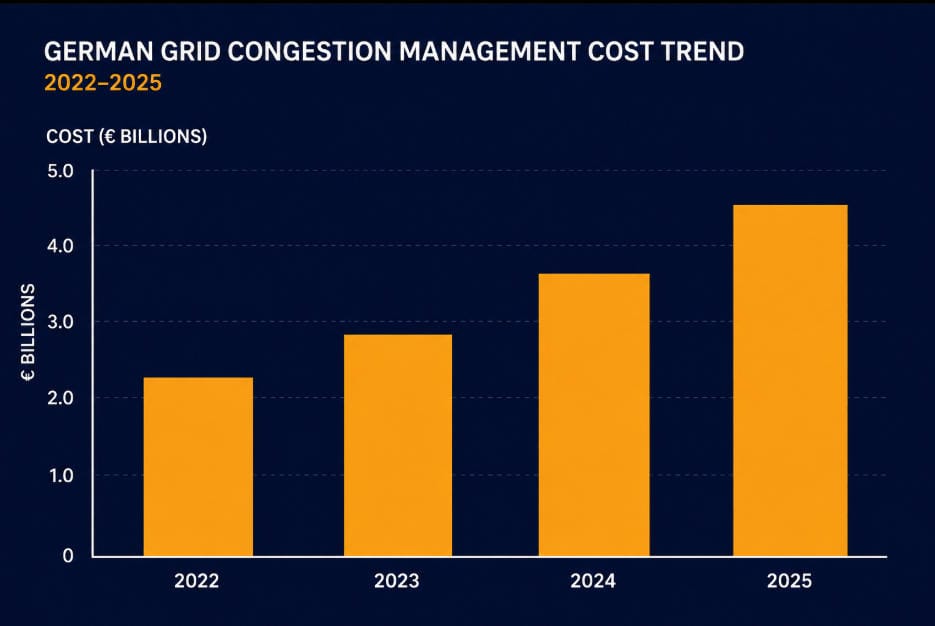
Germany’s Bundesnetzagentur tracks this spending under “Netzengpassmanagement,” or grid congestion management, and publishes the full-year figures through its SMARD platform. The total includes conventional redispatch, renewable curtailment compensation, and reserve power plant activation.
| Year | Total congestion management cost | Notes |
| ≈2014 | ≈ €187 million (est.) | Baseline implied by the roughly 15-fold increase to 2024 |
| 2022 | ≈ €4.2 billion | Energy-crisis year; sharp rise in gas-fired redispatch costs (figure not independently re-verified against a Bundesnetzagentur primary release — confirm before publish) |
| 2023 | ≈ €3.3 billion | Bundesnetzagentur/SMARD; near-record renewable curtailment |
| 2024 | €2.95 billion | Bundesnetzagentur/SMARD; 9.4 TWh curtailed (3.5% of renewable output); €554m curtailment compensation |
| 2025 | €3.07 billion | Bundesnetzagentur/SMARD; conventional redispatch €1.18bn; curtailment compensation fell 22% to €433m |
Two patterns stand out. First, the mix of costs is shifting. In 2025, conventional redispatch and reserve power plant activation — not curtailment compensation — made up the largest cost blocks.
Second, these costs track gas prices closely. TSOs often ramp gas-fired plants in southern Germany to fill the gap left by curtailed northern wind. When gas is expensive, redispatch gets expensive too.
Both patterns point the same way: relieving congestion with storage, rather than fossil generation, cuts both cost and emissions.
From Curative to Preventive: How BESS Relieves Bottlenecks Under Flow-Based Market Coupling
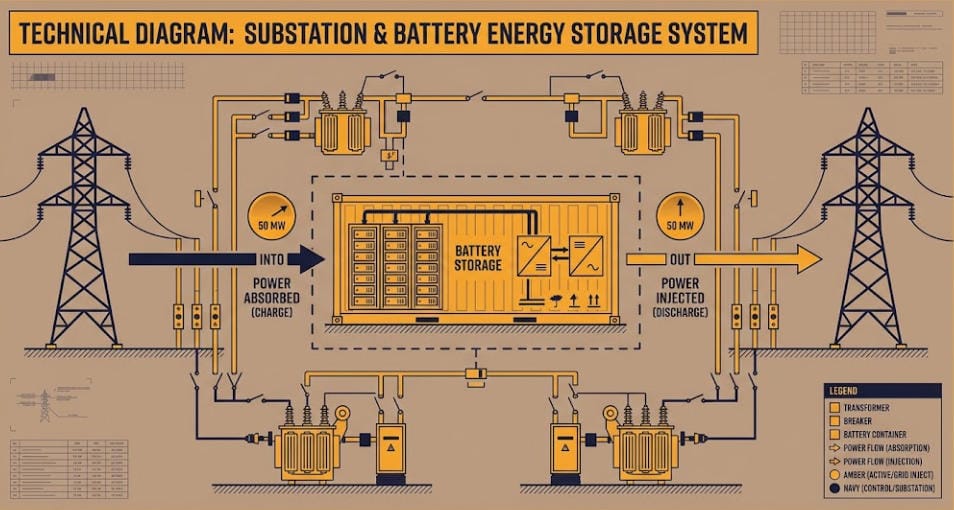
Conventional redispatch is a curative measure. It responds to congestion that has already appeared, close to real time.
Transmission-connected battery storage adds a second option: preventive congestion management. Here, a battery sits directly on a constrained corridor.
It charges and discharges to keep power flows within limits. That happens before an intervention becomes necessary.
German TSOs have started deploying utility-scale battery storage for exactly this purpose. The concept is often called the “Grid Booster,” or storage-as-transmission-asset (SATA).
Functionally, these systems act like a virtual transmission line. A new overhead line can take years to permit and build.
A battery at a key substation works faster. It absorbs excess generation on the constrained side of a corridor.
It then injects that power back on the other side, raising the effective use of the existing transmission asset.
One 250 MW project on the southern German grid went live in 2025. A second 250 MW system, on a different corridor, has been approved for service by 2028.
Beyond congestion relief, these installations are typically specified to also provide synthetic inertia, dynamic voltage control, and contingency reserves. That stacks several transmission-support functions onto one asset.
Academic modeling is more cautious about the limits. One widely cited techno-economic analysis of grid-operator-owned BESS for the German transmission system reached a clear conclusion.
Using a battery exclusively for preventive congestion management does not, on its own, clear economically out to 2030. The capital and operating costs don’t pay back against congestion-relief value alone.
The same research found something else. Combining dynamic line rating with distributed static series compensators was, in some scenarios, more cost-effective than batteries used alone for relieving wind-driven congestion.
For developers, the practical lesson is clear. Congestion relief works best as one revenue stream among several, not the sole reason for a project.
Where Storage Delivers Most Value: Locational Economics of Congestion Relief
Flow-based market coupling prices the zone, not the node. Germany’s day-ahead market still clears at a single national price, even though the underlying grid is congested internally.
That single-price design means a battery’s locational value for congestion relief never shows up in the wholesale price signal. It only shows up in what a TSO is willing to pay.
That payment comes through a SATA contract, an innovation tender, or a flexibility procurement mechanism, tied to a specific corridor.
Siting decisions hinge on proximity to the critical network elements that recur most often in TSO congestion forecasts and Network Development Plan corridors.
That typically means the north-south transmission backbone through Lower Saxony, Thuringia, and Baden-Württemberg. It also includes interconnection points along the Germany-Austria and Germany-Poland borders.
ENTSO-E’s own market design guidance for utility-scale storage frames this as a broader question. Transmission congestion is one of several distinct system needs storage can address.
The others include renewable curtailment risk, balancing reserve requirements, and voltage stability.
But each need requires its own market signal to attract the right asset to the right location. Where that locational signal is weak or absent, storage tends to cluster wherever wholesale arbitrage is largest. That is not necessarily where the grid needs it most.
Regulatory Tailwinds: The EU Electricity Market Design Reform
The EU’s Electricity Market Design reform was published in the Official Journal on 26 June 2024. It gives Member States a formal way to close that locational gap.
TSOs and DSOs must now submit a harmonized methodology for flexibility needs assessments to ACER.
Member States whose renewable flexibility investment falls short of that assessed need can then run Non-Fossil Flexibility Support Schemes, or NFFSS. These are support payments for new storage and demand-response capacity.
They can explicitly include locational criteria. The scheme must still keep the asset exposed to normal price and market risk.
This reform matters directly for flow-based market coupling regions. A national single-price zone like Germany’s doesn’t reward a battery’s corridor-specific value on its own — a dedicated support scheme can.
For BESS developers, this creates a legitimate, EU-sanctioned route for a congestion-driven siting premium. Developers no longer need to rely solely on a bilateral SATA contract with a single TSO.
A separate 2024 study for the European Commission’s Joint Research Centre covered redispatch and congestion management. It set the analytical groundwork both the flexibility needs assessments and NFFSS design now draw on.
Grid Reinforcement vs. Redispatch vs. Battery Storage-as-Transmission-Asset
In flow-based market coupling regions, these three tools work together rather than compete. Each solves a different part of the congestion problem.
| Factor | Grid reinforcement | Conventional redispatch | BESS (storage-as-transmission-asset) |
| Typical lead time | 10–15 years (permitting, construction) | Immediate, recurring operational cost | 2–4 years (siting, procurement, grid connection) |
| Cost driver | Steel, land, permitting, right-of-way | Spread between curtailed and ramped-up generation, gas-price sensitive | CAPEX plus O&M, offset by revenue stacking |
| Reversibility | Permanent, fixed capacity | Fully reversible, but recurring every constrained hour | Redeployable; can relocate as corridor needs shift |
| Primary role | Long-term structural capacity increase | Short-term correction after market clearing | Preventive and curative; bridges the gap until reinforcement is built |
| Consumer cost exposure | Financed via grid fees over decades | Passed through annually via grid fees | Can reduce both reinforcement need and annual redispatch spend |
Designing a Congestion-Relief BESS for Flow-Based Market Coupling Regions
Projects aimed at TSO congestion relief carry a different technical profile than a standalone frequency-response or wholesale-arbitrage asset. They need to perform reliably across several duty cycles at once.
- High cycling tolerance: Preventive and curative dispatch often means frequent partial cycles, not one clean cycle per day. That favors LFP chemistry’s cycle-life margin over higher energy-density alternatives.
- Fast, bidirectional response: Curative interventions close to real time need sub-second to few-second response. That is a similar profile to FCR products, even though the revenue mechanism differs.
- Siting discipline: Value concentrates at specific substations and corridor pinch points identified in TSO Network Development Plans. Proximity to the recurring critical network element matters more than proximity to load or generation alone.
- Revenue stack design: Congestion relief alone rarely clears a standalone business case. Contracts should let the asset also join balancing markets like aFRR and mFRR, or wholesale arbitrage, when congestion relief isn’t required.
These are largely the same asset traits that already govern the balancing-reserve cluster on this site — see the existing coverage of aFRR and mFRR, the MARI platform, and FCR response requirements. A well-specified BESS is often designed to serve congestion relief and frequency products from the same hardware. Dispatch priority is then set by contract, not by design.
Frequently Asked Questions
What’s the difference between flow-based market coupling and net transfer capacity?
Net transfer capacity (NTC) sets one fixed MW limit per border, independent of conditions elsewhere on the grid. Flow-based market coupling instead models the loading of specific critical network elements across the whole region.
It lets the market clear against that physical constraint set. This generally allows more cross-zonal trade, while representing congestion more accurately.
Why did Germany’s redispatch costs rise so sharply?
The core driver is a geographic mismatch. Most new wind capacity sits in the north, while demand and retiring conventional generation are concentrated in the south.
Transmission build-out hasn’t kept pace. Rising gas prices compound the effect, since TSOs often ramp southern gas plants to replace curtailed northern wind during congestion events.
Can a BESS actually replace the need for grid reinforcement?
Not entirely. Storage-as-transmission-assets can defer or reduce the scale of reinforcement and cut annual redispatch spend on a specific corridor. But transmission planning studies generally treat storage as a complement to reinforcement, not a permanent substitute for new transmission capacity.
Is preventive congestion management alone a viable BESS business case?
Independent modeling of the German transmission system found that using a BESS exclusively for preventive congestion management does not clear economically on its own out to 2030.
Projects that also join balancing markets or wholesale arbitrage alongside congestion relief have a materially stronger case.
How does the EU’s 2024 Electricity Market Design reform affect storage investment for congestion relief?
It requires TSOs and DSOs to formally assess flexibility needs and report them to national regulators. It also lets Member States run Non-Fossil Flexibility Support Schemes with explicit locational criteria, when private investment falls short of that assessed need.
That gives regulators a more direct policy channel for siting storage where congestion is worst.
Further Reading
Frequency Restoration Reserve (FRR): aFRR and mFRR Explained
Frequency Containment Reserve (FCR) Explained
The MARI Platform: Cross-Border mFRR Balancing
Fast Frequency Response (FFR): How BESS Stabilizes Grid Frequency

The MARI Platform: How mFRR Balancing Energy Trades Across Europe
The MARI platform is the piece of European market infrastructure that turns national mFRR reserves into one shared, cross-border pool. For a BESS asset manager, understanding how it clears bids is not optional background reading. It is the difference between a bid that earns revenue and one that never activates.
This guide goes beyond the platform basics covered in our Frequency Restoration Reserve overview, focusing on how the mechanics translate into bidding strategy for BESS asset managers.
| Quick Answer The MARI platform matches mFRR balancing energy bids across TSOs every 15 minutes. It builds a shared merit order list and clears at a marginal price per direction, but only if enough cross-border capacity exists. For asset managers, that capacity constraint often decides whether a bid clears. |
What Is the MARI Platform?
MARI stands for Manually Activated Reserves Initiative. It launched in October 2022, connecting five TSOs at first, under Article 20 of the EU’s Electricity Balancing Guideline.
The MARI platform exists to solve one problem. National mFRR markets used to clear in isolation. A shortage in one country and a surplus next door could not offset each other. MARI lets that offsetting happen automatically.
From National Markets to a Common Merit Order List
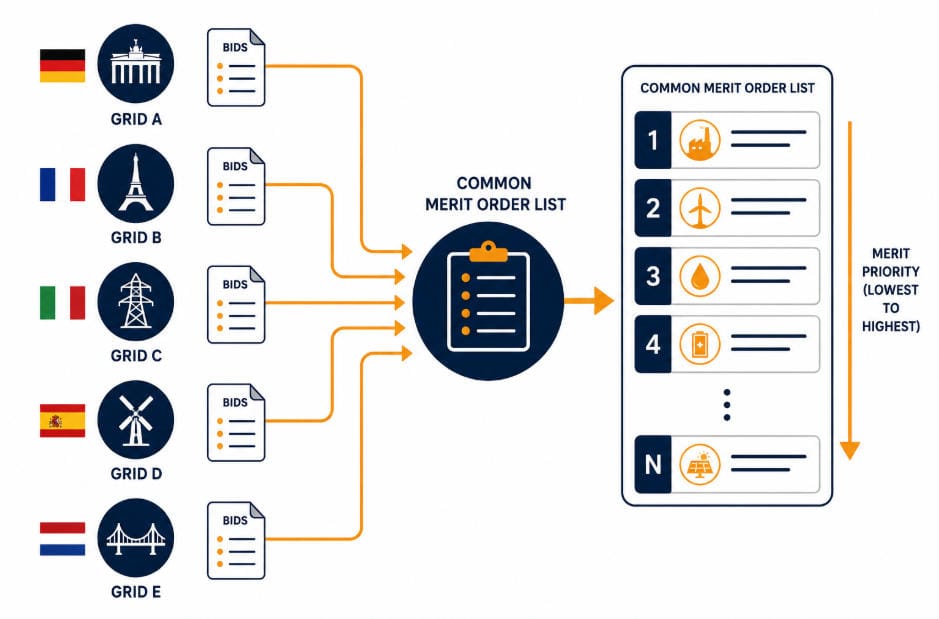
Every participating TSO submits its standard mFRR bids into a shared Common Merit Order List, or CMOL. The MARI platform rebuilds this list every 15 minutes, a period it calls a Market Time Unit.
An Activation Optimization Function then selects bids from the CMOL. Its first goal is maximizing total economic surplus. Only after that, it also tries to minimize how many cross-border exchanges the platform needs to meet demand.
How Bids Clear on the MARI Platform
Clearing on the MARI platform is not simply “lowest price wins.” Two separate conditions both have to hold.
First, the bid has to fall inside the accepted portion of the merit order. This applies for its direction and Market Time Unit specifically. Second, enough Cross Zonal Capacity has to exist on the transmission path between the bidder’s zone and the demand.
That second condition is easy to overlook. A BESS asset can offer the cheapest bid on the entire MARI platform. It can still miss clearing, simply because the interconnector between its zone and the TSO with the shortfall sits congested.
Direct vs. Scheduled Activation on the MARI Platform
The MARI platform runs two activation modes side by side. Direct activation is continuous. A pool of bids sits ready. The platform matches a TSO’s balancing need against that pool instantly, whenever it arises.
Scheduled activation, in contrast, works more like the older national mFRR process. It just runs coordinated across the shared platform now, instead of staying confined to one country. Both modes draw from the same underlying CMOL.
Marginal Pricing and Indivisible Bids
Every bid that clears on the MARI platform in a given direction earns the same marginal price. The most expensive accepted bid sets that price, not what each bidder originally offered. This pay-as-cleared structure rewards accurate cost estimation over aggressive underbidding.
Bids can also carry an indivisible tag. An indivisible bid clears entirely or not at all. For a BESS operator, a smaller, divisible bid size can sometimes clear more reliably than one large indivisible block, even at the same price.
MARI Platform Bidding Strategies for Asset Managers
Understanding the mechanics is the starting point. Turning that understanding into a bidding strategy is where the real economics live.
Balancing Markets Are Getting More Complex to Bid Into, Not Less
European balancing markets, including mFRR, are moving toward gate closures set closer to real-time delivery. Bid and price resolutions are shrinking too. That combination opens the market to more participants. It also makes correctly positioning a bid harder than it used to be.
An asset manager bidding on the MARI platform faces this trend directly. A bidding process built around slow, infrequent adjustments falls behind. Reviewing and adjusting bid levels closer to each Market Time Unit keeps pace with how the market has evolved, more than setting a static schedule days ahead ever could.
Treat Bidding and Dispatch as One Decision, Not Two
A common mistake: design a bid in isolation, then react to whatever activates. Research on value-stacking in adjacent European reserve markets, covering FCR alongside imbalance participation, points to a better approach instead. Shape the bid itself around the asset’s later dispatch flexibility, not after the fact. The same logic carries over to mFRR bidding on the MARI platform.
This matters most when a BESS stacks mFRR revenue from the MARI platform with other services. Think FCR and FRR, the products this platform sits alongside. A bid that looks optimal for mFRR in isolation can quietly eat into the state-of-charge headroom another service needs later the same day.
Consider the Cost of Capacity Withholding
Larger BESS portfolios face a different question entirely. Should the operator bid a smaller volume than what’s physically available? Doing so can influence the clearing price instead of simply accepting it. Broader research on storage bidder market power has derived formal bounds on this behavior, validated in simulations calibrated to the ISO New England market. It shows when capacity withholding still pays off, and when it turns self-defeating.
For most independent asset managers, this is more caution than strategy. A BESS large enough to move the clearing price also draws more regulatory scrutiny. Still, the underlying principle explains something real: very large storage fleets sometimes bid less aggressively than their full capacity would suggest, even outside the specific market that research examined.
Do Not Ignore Congestion Risk in Bid Placement
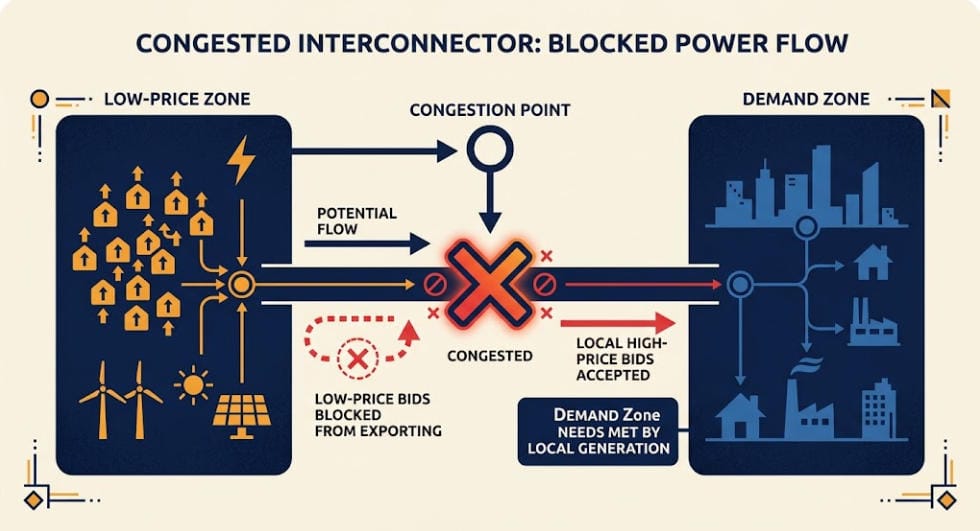
Cross Zonal Capacity gates every clearing decision on the MARI platform. Because of this, a BESS asset manager should treat interconnector congestion forecasts as seriously as price forecasts. A bid priced to win on the merit order alone can still miss clearing when the path to demand runs constrained.
Diversifying bid exposure across delivery windows helps too. Concentrating volume only in the most profitable hours raises the odds that one congestion event wipes out a day’s expected mFRR revenue.
MARI Platform vs. PICASSO
| Platform | Reserve | Activation | Pricing |
| MARI | mFRR | Manual, TSO instruction | Marginal, pay-as-cleared |
| PICASSO | aFRR | Automatic, centralized | Marginal, pay-as-cleared |
The MARI platform and PICASSO share the same underlying logic: a shared merit order and cross-border clearing. Each applies that logic to a different reserve product, with different activation timing.
FAQ
What does MARI stand for?
MARI stands for Manually Activated Reserves Initiative. It is the European platform that clears mFRR balancing energy bids across participating TSOs.
How often does the MARI platform clear bids?
The MARI platform rebuilds its Common Merit Order List and clears bids every 15 minutes. The platform defines this period as a Market Time Unit.
Why would a competitively priced bid fail to clear on the MARI platform?
Price alone is not enough. If not enough Cross Zonal Capacity exists between the bidder’s zone and the TSO with the balancing need, the bid cannot clear, no matter how competitive its price is.
Can a BESS asset manager bid into both MARI and PICASSO?
Yes. MARI handles mFRR and PICASSO handles aFRR separately. A BESS can participate in both, but sizing and state-of-charge planning need to account for both duty cycles at once.
Further Reading
Frequency Restoration Reserve (FRR)
Frequency Restoration Reserve (FRR): aFRR, mFRR, and How BESS Fit In
Grid frequency does not stay balanced on its own once primary reserve acts. Frequency Restoration Reserve (FRR) is the next layer that finishes the job, restoring frequency rather than just holding a line.
FRR is the collective term for two related services, aFRR and mFRR. Together, they bring frequency all the way back to its target value. They do more than just stop the drift.
| Quick Answer Frequency Restoration Reserve (FRR) restores grid frequency after primary reserve contains a deviation. It covers two products: aFRR activates automatically within about 5 minutes. mFRR activates manually within about 12.5 minutes. Both pay a capacity fee for standing ready, plus an energy fee when dispatched. |
What Is Frequency Restoration Reserve (FRR)?
FRR sits second in the grid balancing stack, right after primary reserve. Primary reserve only halts a frequency drift. Frequency Restoration Reserve pushes frequency the rest of the way back to 50 Hz.
FRR splits into two distinct products. Automatic FRR, or aFRR, is also called secondary reserve. Manual FRR, or mFRR, is also called tertiary reserve.
Each product differs mainly in what triggers it, not in its overall goal. Both aim to restore frequency and free up primary reserve for the next event.
FRR vs. FCR: Where It Sits in the Reserve Stack
Frequency Containment Reserve (FCR) acts first, within 30 seconds. It only stops a deviation from growing worse — see our full Frequency Containment Reserve (FCR) guide for how that first layer works. FRR follows, and actually restores the frequency.
Think of FCR as an emergency brake. Frequency Restoration Reserve is the driver correcting course afterward, over the following minutes. Neither product works well without the other.
aFRR: Automatic Frequency Restoration Reserve
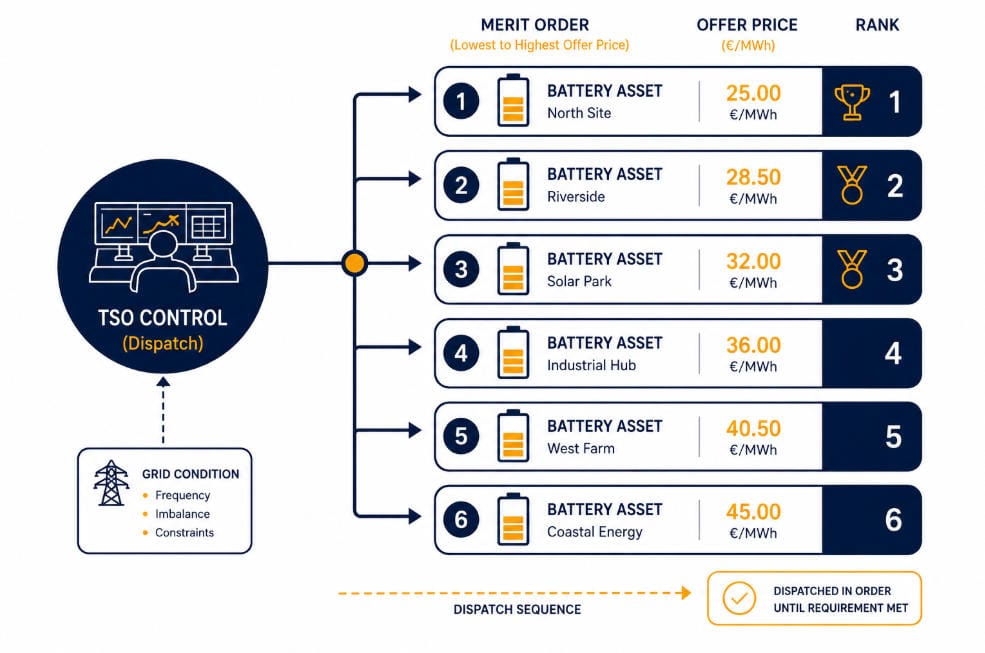
A centralized TSO controller dispatches aFRR. Local frequency measurement does not trigger it. This is a key difference from FCR, which reacts locally at each individual asset.
Because dispatch is centralized, the TSO can rank available assets by cost. Operators call this ranking a merit order. It also lets the TSO account for grid congestion when choosing which assets to call on.
Under the harmonized European framework, aFRR assets must reach full output within about 5 minutes of an activation signal. That five-minute window is the deadline for full power, not the start of the response — the asset begins adjusting output within seconds of each signal, then ramps to full power over the five minutes that follow.
Signals typically arrive every few seconds. Instead of a single discrete instruction, setpoints are continuously adjusted in real time.
The PICASSO Platform
European TSOs coordinate aFRR through PICASSO, a shared cross-border platform. It lets balancing energy flow across country borders. This spares each grid from staying siloed inside a single control area.
More than two dozen TSOs now participate in the platform. As a result, a BESS in one country can, in effect, help balance a neighboring grid during a shortfall.
mFRR: Manual Frequency Restoration Reserve
mFRR, in contrast, requires an explicit instruction from the TSO. A human operator or an automated dispatch system tells the asset when to activate. The asset does not react entirely on its own.
Under the same harmonized framework, mFRR assets must reach full output within about 12.5 minutes. After activation, a bid must sustain that output for a minimum of 5 minutes.
mFRR steps in when aFRR alone cannot cover an imbalance. A large, sudden loss of generation, for example, can exhaust the available aFRR capacity fast.
The MARI Platform
Just as PICASSO handles aFRR, the MARI platform coordinates mFRR trading across European TSOs. It works toward the same cross-border balancing goal.
National mFRR auctions still exist alongside this shared platform in many markets today. Full integration is still an ongoing process across the continent.
Read the full MARI platform guide for how the Common Merit Order List clears bids across borders, plus bidding strategies for BESS asset managers.
Market Structure for Frequency Restoration Reserve
TSOs do not sell FRR as a single product. Both aFRR and mFRR split into separate capacity and energy markets, each with its own rules.
The capacity market pays for standing ready, whether or not the TSO calls on the asset. This market typically settles pay-as-bid. So each accepted bid earns exactly what it offered, not a shared clearing price.
The energy market, on the other hand, pays only for power actually delivered during an activation. This market typically settles pay-as-cleared. Every accepted bid then earns the same clearing price, regardless of what it originally bid.
Auction timing also differs by product. aFRR capacity auctions often close in the morning before delivery. mFRR auctions typically close slightly later the same day.
Why BESS Fit Well Into aFRR
A BESS can shift output in either direction almost instantly. This suits the merit-order, centrally dispatched nature of aFRR well.
One European TSO, for example, runs a two-phase aFRR structure: assets first reserve capacity ahead of each operational period. The TSO then dispatches them just-in-time within it, with a response time around 30 seconds after each call.
Operators can submit bids in that structure up to 25 minutes before each delivery window. They split into separate upward and downward regulation. A BESS’s ability to bid cleanly on both sides, from the same hardware, gives it a real edge. Most thermal assets cannot match that flexibility.
Because of this, BESS operators participating in Frequency Restoration Reserve markets often stack aFRR with other revenue streams. This spreads risk across several products instead of relying on just one.
Sizing a BESS for FRR Duty
An FRR asset needs enough usable capacity to sustain a full activation for the required duration. A simple instantaneous power rating is not enough on its own.
This matters more for mFRR, since its minimum delivery duration runs longer than a quick FCR burst. That means energy content, not just power rating, drives the sizing math.
State-of-charge management still applies here too, though less aggressively than under constant FCR cycling. Because activations are less frequent, the BESS has more time to recover between events.
But designers still need to plan for that recovery window, not simply assume it. A poorly sized recovery buffer can leave a BESS unable to respond to the next Frequency Restoration Reserve call.
Frequency Restoration Reserve in Practice: FCR vs. aFRR vs. mFRR
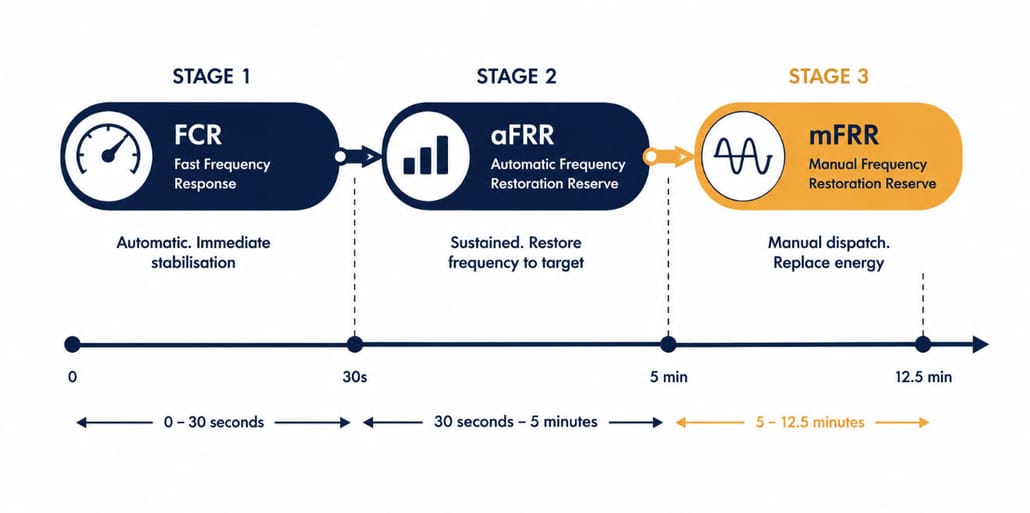
| Reserve | Trigger | Full Activation Time | Minimum Duration |
| FCR | Automatic, local | 30 seconds | 15–30 minutes |
| aFRR | Automatic, centralized | About 5 minutes | Varies by market |
| mFRR | Manual, TSO instruction | About 12.5 minutes | 5 minutes |
So the three products form a relay. FCR buys the first 30 seconds. Frequency Restoration Reserve then takes over in two stages. aFRR covers the next several minutes, and mFRR closes out anything that remains.
FAQ
What is the difference between aFRR and mFRR?
aFRR activates automatically through a centralized TSO signal. mFRR requires a manual instruction from the operator. aFRR also responds faster, typically within 5 minutes versus about 12.5 minutes for mFRR.
Is FRR the same as FCR?
No. FCR only contains an initial frequency deviation, within 30 seconds. Frequency Restoration Reserve, covering aFRR and mFRR, then restores frequency back to its nominal value over the following minutes.
Can the same BESS provide both FCR and FRR?
Some BESS do stack services. But sizing and controls must account for both duty cycles at once, since FCR and Frequency Restoration Reserve stress a system differently. A BESS designed only for FCR’s rapid, shallow cycling does not automatically suit FRR’s longer, sustained activations.
How is FRR paid?
Both aFRR and mFRR pay through separate capacity and energy markets. Capacity payments typically settle pay-as-bid. Energy payments typically settle pay-as-cleared.
Further Reading
Frequency Containment Reserve (FCR) for BESS: Sizing, Revenue & Degradation
Grid frequency must stay close to its normal value at all times. This holds true whether the source is a coal plant, a wind farm, or a battery. Frequency Containment Reserve (FCR) is the automatic response that holds this balance across all of them.
So when power supply and demand drift apart, FCR assets react within seconds. Battery energy storage systems have become top Frequency Containment Reserve providers. They respond faster than almost any other technology on the grid.
| Quick Answer Frequency Containment Reserve (FCR) is the fastest layer of grid balancing. It restores the power balance within 30 seconds of a frequency drop or spike. Batteries sense frequency locally and respond in milliseconds. Operators earn a steady payment for staying ready, whether the reserve activates or not. |
What Is Frequency Containment Reserve (FCR)?
FCR is the first line of defense against grid frequency swings. European rules define Frequency Containment Reserve as the active power reserve that contains frequency right after an imbalance hits.
FCR is also called primary reserve. In Germany, people call it Primärregelleistung.
But it does not push frequency all the way back to 50 Hz. It only stops the drift. It buys time. Then, slower reserves step in and finish the job.
Primary, Secondary, and Tertiary Control
Grid operators stack three response types on top of each other. First, Frequency Containment Reserve acts, and it acts fastest of the three.
Next comes Frequency Restoration Reserve (FRR). It responds between 30 seconds and 12.5 minutes after an event. Finally, manual reserves close out the recovery over the following minutes.
Frequency Containment Reserve 30-Second Response Window
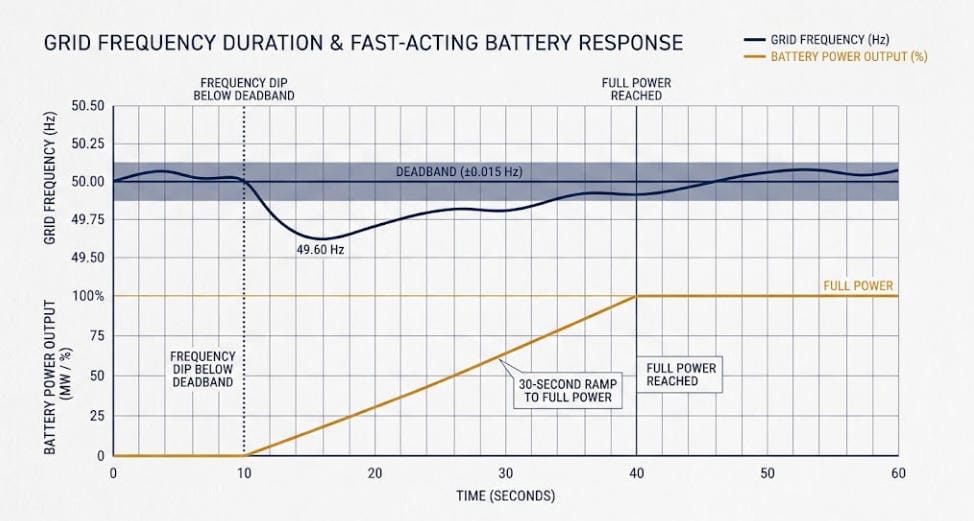
Frequency Containment Reserve assets must adjust their output based on the size of the frequency deviation. In Continental Europe, full activation kicks in once the deviation hits 200 mHz.
At that point, the asset has 30 seconds to deliver its full contracted capacity. So once activated, it must hold that output for 15 to 30 minutes, depending on the region.
Suppliers measure frequency locally, right at the point of generation or use. Because of this, the response runs on its own. No signal from the grid operator is needed first.
The Deadband
A small deadband sits around normal frequency. In the Continental Europe FCR market, this band runs from 49.99 Hz to 50.01 Hz.
Inside the deadband, no response is required. Outside it, however, providers must deliver the volume they promised.
FCR-N vs. FCR-D: The Nordic Split
Nordic countries split Frequency Containment Reserve into two separate products. FCR-N covers normal, everyday swings within about ±0.1 Hz.
FCR-D, on the other hand, covers bigger disturbances that fall outside that range. This split allows finer control across two very different event types.
So, FCR-N assets cycle often, but only shallowly. FCR-D assets sit idle most of the time. Then they respond hard during rare, larger events.
Battery duty cycles differ sharply between the two products. Because of this, the gap matters for sizing and for degradation planning.
Why Batteries Excel at Frequency Containment Reserve
Batteries hold a clear edge over generators for FCR duty. A power electronics-based asset can shift from zero to full output in milliseconds.
A generator, in contrast, needs several seconds just to change its governor setpoint. That gap matters, since FCR is a symmetric product.
Providers must move power in both directions, up and down, from the same asset. A battery handles this cleanly. It still needs a dedicated state-of-charge controller to stay ready on both sides at once.
So, FCR has become one of the strongest early revenue streams for grid-scale batteries. It often beats secondary and tertiary reserve markets on a per-megawatt basis. That is part of why so many storage developers target it first.
Market Structure and Revenue
Frequency Containment Reserve is sold as a capacity product, not an energy product. Providers get paid a set price per megawatt for the tender period.
That payment applies whether the reserve activates once, many times, or not at all. The common European group, for example, runs daily auctions for the next delivery day.
Since a 2024 reform, blocks can be sold in 30-minute chunks instead of longer windows. This shorter block length gives battery operators more scheduling freedom. So operators can now combine FCR with other revenue streams across the same day.
Prequalification Requirements
A battery cannot bid into FCR without passing prequalification tests first. The grid operator checks response speed, accuracy, and sustained delivery through a formal test sequence.
A passed test typically qualifies a unit for up to five years before retesting. The full process, however, commonly takes three to six months, from application to approval.
So, Sunlith recommends starting this process well ahead of commercial operation, because delays here push back revenue directly.
Battery Wear Under Frequency Containment Reserve Duty Cycles
FCR asks a battery to cycle constantly. The bursts are small and frequent. They track real-time frequency noise.
This pattern differs sharply from the large, planned cycles used in energy trading. Researchers describe this cycling as path-dependent: wear depends on the exact charge and discharge order, not just total energy moved.
Newer wear models built for BESS now account for FCR duty directly. They also cover peak shaving and solar profiles in the same framework.
These models weigh heat, current rate, discharge depth, and charge level together. So they no longer look at each stress factor alone.
Keeping Charge Level Balanced
An FCR asset must stay ready to respond in both directions at all times. A battery pinned near full charge, for instance, cannot absorb more energy.
A battery pinned near empty cannot deliver more power either. Either state risks a penalty from the grid operator.
So a dedicated recharge controller keeps the battery centered in its usable range. This controller balances two costs against each other. Aggressive recentering adds extra cycles of its own, so the trade-off needs care.
FCR vs. aFRR vs. mFRR
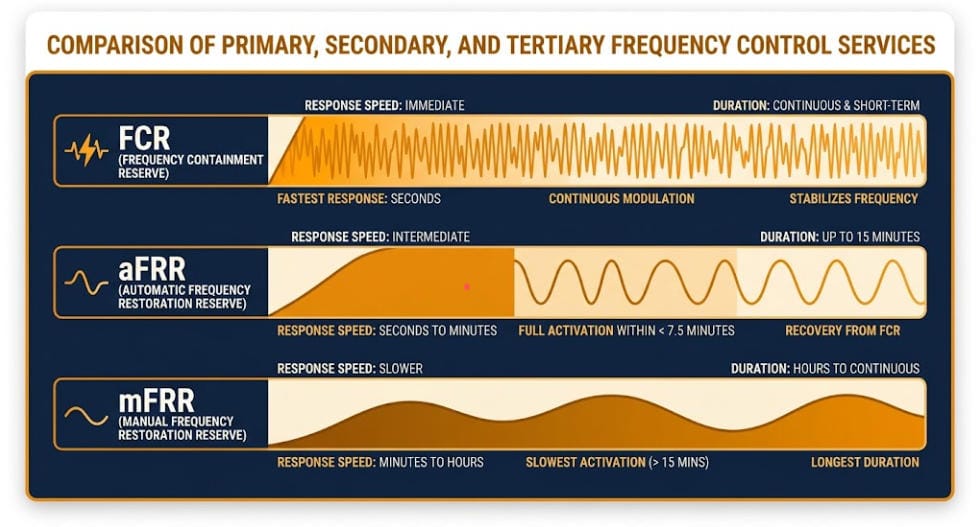
| Reserve | Response Time | Duration | Payment Type |
| FCR | Within 30 seconds | 15–30 minutes | Capacity only |
| aFRR | Seconds to minutes | Up to 15 minutes | Capacity and activation |
| mFRR | Up to 15 minutes | Longer sustained periods | Capacity and activation |
Frequency Containment Reserve asks the least of an asset in energy content. But it asks the most in speed and cycling frequency. This mix is why lithium iron phosphate batteries fit the service so well.
Sizing a Battery for Frequency Containment Reserve (FCR)
Sizing starts with headroom, not raw capacity. The system needs enough usable energy for a full-power event across the required duration.
It also needs margin for charge-level recovery between events. Power electronics matter just as much as cell chemistry here. A weak inverter design can bottleneck an otherwise well-sized battery.
The inverter and battery management system must both support fast, frequent switching. Because of this, they need extra thermal design margin, so they can do it without adding excess heat.
Also, pairing Frequency Containment Reserve with a second revenue stream, like energy trading, often helps. It can offset the wear from constant small cycling and improve project economics overall.
Frequency Containment Reserve (FCR) Outside Europe
Frequency response services exist well beyond the European FCR framework, even where the acronym differs. In the United States, regional grid operators like PJM and CAISO run their own fast-frequency-regulation markets with comparable speed requirements.
Australia’s FCAS framework and the UK’s Dynamic Containment product both serve the same core purpose. They ask batteries to hold grid frequency steady within seconds. Contract terms and payment structures still vary by market.
A developer targeting FCR revenue in one region should still study the local prequalification rules closely. Response-time thresholds, penalty structures, and settlement periods differ enough between markets. A design built for one grid code rarely transfers directly to another.
FAQ
What is the difference between FCR and frequency response?
FCR is one specific type of frequency response, defined under European grid codes. Other regions use different names and slightly different rules for similar fast-acting services.
How much can a BESS earn from FCR?
Revenue depends on the local capacity price and the size of the contracted block. FCR pays as a capacity product, so income tends to be steadier than pure trading revenue.
Does this service wear batteries faster than energy trading?
FCR causes many small, shallow cycles instead of fewer deep ones. The real impact depends on charge-level management and heat control, not on cycle count alone.
What size BESS is needed for FCR?
Sizing depends on the contracted capacity, the required delivery duration, and the margin needed for charge-level recovery between events.
Further Reading
Partial-SOC Cycling and Recalibration Scheduling for LFP BESS
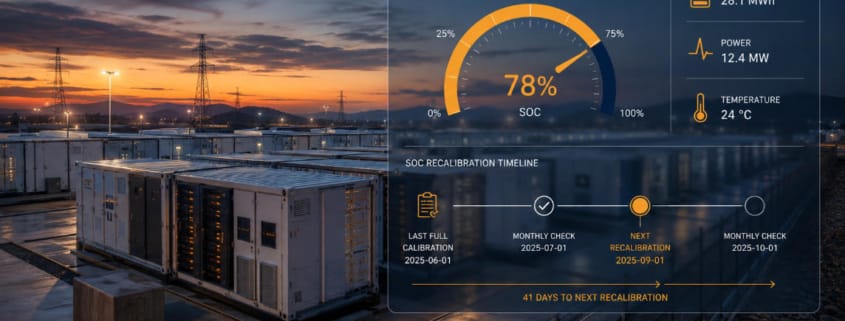
Frequency regulation, peak shaving, and other grid-services duty cycles keep a BESS cycling between roughly 20% and 80% state of charge. That partial-SOC band protects LFP cells from deep-discharge stress. But it also means the estimator rarely sees a true 0% or 100% anchor point. Recalibration scheduling is the deliberate plan for correcting SOC drift when the operating profile itself won’t do it for you.
| Quick Answer Grid-services BESS rarely touch 0% or 100% SOC, so the anchor points that reset Coulomb-counting drift never occur naturally. Recalibration scheduling forces periodic full-range excursions, or substitutes softer in-band anchors, to correct that drift on a set cadence without giving up cycling revenue. |
Why This Needs a Scheduling Plan, Not Just an Anchor Point
Coulomb counting drift and the anchor-point fix are covered in depth in The 20/80 Rule for Batteries: an open-circuit voltage reading at a true 0% or 100% SOC resets the estimator and prevents error from accumulating.
So, the short version: a grid-services BESS often can’t count on that reset happening naturally. A frequency-regulation asset can spend months inside a 20-80% band, since the estimator has nothing to reset against until something schedules a true excursion. This article picks up from there, building the actual recalibration scheduling logic. See our guide to EKF SOC estimation design for how the underlying estimator works.
Soft Anchors vs. True Anchors
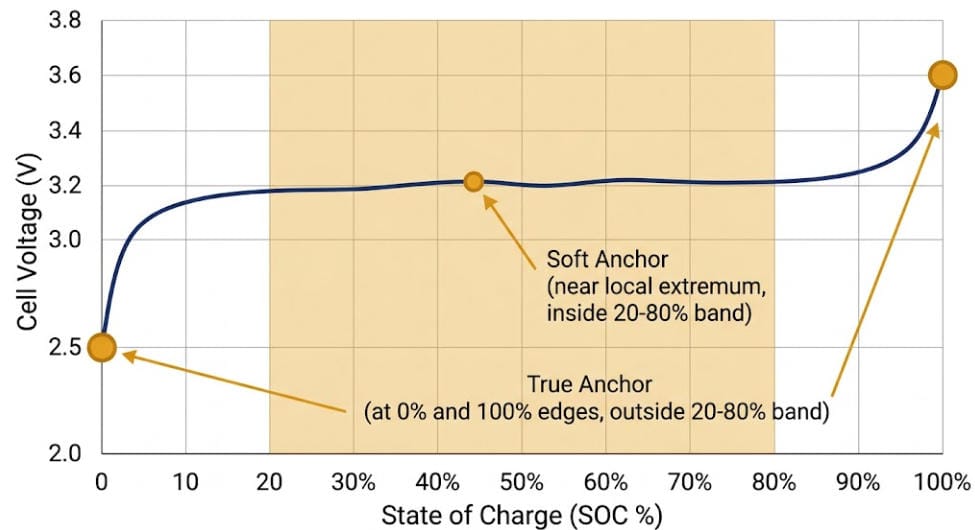
Recalibration scheduling generally comes down to two correction options inside a partial-SOC operating window: a soft anchor, or a true anchor.
A soft anchor uses a local voltage extremum, the highest or lowest point the pack reaches inside its normal band, as a weaker reference signal. It costs no cycling capacity, but it is less reliable than a full anchor, since the flat LFP voltage curve blurs the reading. Voltage-based correction methods can sharpen that signal near the charge end, but our EKF SOC estimation design treats it as one input among several, not a standalone fix.
A true anchor, on the other hand, is a scheduled deep excursion to near 0% or 100% SOC. It fully resets the estimator, but it also costs cycling capacity and, therefore, revenue. So the trade-off is the entire scheduling problem in miniature. How often can a fleet afford to give up a true anchor before drift becomes the bigger cost?
Building a Recalibration Scheduling Cadence
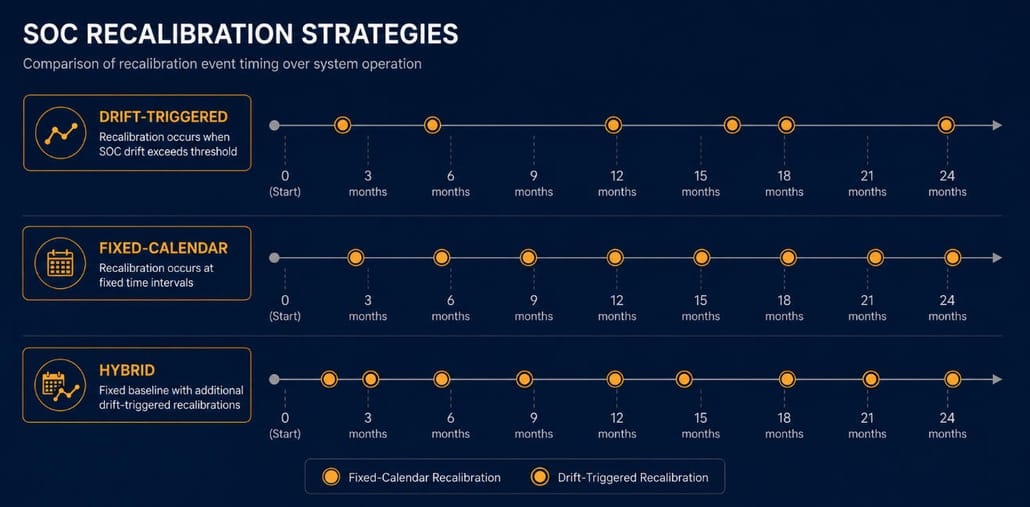
Most fleets land on one of three cadence styles.
| Cadence Type | Trigger | Strength | Trade-off |
|---|---|---|---|
| Drift-triggered | EKF divergence crosses a set threshold | Only recalibrates when actually needed | Requires a mature, well-tuned estimator |
| Fixed-calendar | Every set number of weeks, regardless of drift | Simple, easy to plan around revenue contracts | Can waste capacity if drift is genuinely low |
| Hybrid | Fixed-calendar backstop plus early drift-triggered excursions | Balances predictability with accuracy | More logic to implement and tune |
Drift-Triggered Scheduling
Drift-triggered scheduling waits for the estimator itself to flag a problem, typically when the EKF’s own confidence bounds widen past a threshold. So it is efficient, but it also leans hard on estimator quality.
Fixed-Calendar and Hybrid Recalibration Scheduling
Fixed-calendar scheduling, by contrast, ignores drift signals entirely and recalibrates on a regular, pre-set schedule. It is predictable and easy to coordinate with revenue commitments, though occasionally it recalibrates earlier than the pack strictly needs.
A hybrid approach keeps the fixed-calendar backstop but allows an early trigger if drift crosses a threshold sooner. This is close to the logic behind degradation-aware fleet scheduling, where a control policy weighs the cost of an excursion against the degradation and drift risk of skipping it, rather than treating every fleet asset on an identical fixed clock. It caps the worst case without discarding the efficiency of drift-based triggers.
Whichever cadence a project picks, log every recalibration event alongside its trigger reason. An operations team reviewing dispatch anomalies six months later needs that record to tell a genuine fault from an overdue anchor.
DCIR and SOH Milestones in Recalibration Scheduling
Recalibration scheduling should also not rely on SOC alone. Internal resistance and state of health both drift with age, so both can be tracked independently of the SOC estimator.
Pairing a scheduled true anchor with a DCIR measurement gives two independent readings at once, one for charge state, one for cell condition. Our guide to DCIR-adaptive cutoff design covers how resistance data feeds directly into cutoff-voltage decisions.
This cross-check matters most late in project life. Because cells age, the OCV-SOC relationship itself shifts, so a stale voltage-to-SOC table can mask real drift even right after a true anchor. Tying recalibration scheduling to SOH milestones, not just calendar time, catches that.
A practical rule: refresh the OCV-SOC lookup table on SOH milestones, not a fixed calendar. Early in life, fade is slow, so refreshes are rare. Later, as fade accelerates, they need to happen more often. In other words, the milestone, not the clock, should set the pace.
None of this requires exotic hardware. A BMS that already runs Coulomb counting and logs voltage at rest has what it needs. What is usually missing, instead, is the scheduling logic itself: the explicit rule set that decides when a true anchor is worth the lost cycling revenue and when a soft anchor or a calendar tick will do.
Frequently Asked Questions
How Often Should Recalibration Scheduling Run for a Grid-Services BESS?
There’s no universal number. Because fleets differ, most commercial operators set a fixed-calendar backstop, then allow an early trigger if the estimator’s drift crosses a set threshold sooner. The right recalibration scheduling interval depends on Coulomb-counting sensor quality, how tightly the SOC band is held, and how the fleet weighs lost cycling revenue against estimation risk.
Does partial-SOC cycling shorten the interval between full-range cycles, or lengthen it?
It lengthens it, in the sense that a well-run partial-SOC program deliberately avoids full-range cycles to protect cycle life. Because of that, recalibration scheduling reintroduces them only as often as drift correction requires, not as often as the duty cycle would otherwise allow.
Further Reading
EKF SOC Estimation Design for LFP BESS
Designing an LFP BESS Against SOC Drift, Cell Imbalance, and Premature Cutoffs
Battery Management System (BMS) Explained
References
Full citations for the sources linked inline above:
Gismero, A., Schaltz, E., & Stroe, D.-I. (2020). Recursive State of Charge and State of Health Estimation Method for Lithium-Ion Batteries Based on Coulomb Counting and Open Circuit Voltage. Energies, 13(7), 1811.
Abdollahi, A., Li, J., Li, X., Jones, T., & Habeebullah, A. (2022). Voltage-Based State of Charge Correction at Charge-End. arXiv:2201.02282.
Srinivasa, T. R., Deulkar, V., Bhargava, J., Hajiesmaili, M., & Shenoy, P. (2026). Degradation-Aware Frequency Regulation of a Heterogeneous Battery Fleet via Reinforcement Learning. arXiv:2601.22865.