

How Temperature Accelerates Battery Degradation: The Arrhenius Relationship in LFP Cells
Every BESS guide tells you to keep cells cool. Fewer explain why temperature has such an outsized effect in the first place. The Arrhenius relationship between temperature and battery degradation answers that question. It is not a rule of thumb. Instead, it is real chemistry. Understanding it changes how you think about thermal design.
This guide skips the practical checklist most temperature guides repeat. It explains the actual mechanism instead. First, it covers what the Arrhenius equation says. Then it covers why that equation applies to batteries at all. Then it covers a detail most guides skip. Cold accelerates aging too, through a completely different pathway than heat. Finally, it covers what this means for BESS design at scale.
| Quick Answer The Arrhenius relationship between temperature and battery degradation describes how chemical reaction rates, including the ones that degrade a battery, scale exponentially with temperature. As a rough rule, degradation reactions roughly double in rate for every 10°C increase. This is not linear. A cell running 20°C hotter than another does not age twice as fast. It can age four times as fast or more. |
Temperature Battery Degradation Arrhenius: What the Equation Actually Says
Chemistry students learn the Arrhenius equation for a reason. It shows up almost everywhere reaction rates matter. Battery degradation is, at its core, a reaction rate problem.
The equation behind the Arrhenius relationship between temperature and battery degradation is simple in shape. It links reaction rate to temperature through one key number: activation energy. Every chemical reaction needs a minimum amount of energy to proceed. This includes the side reactions that consume lithium inside a cell. Temperature sets how many molecules have enough energy to clear that bar at any given moment. Raise the temperature, and more molecules clear it. The reaction speeds up. It speeds up exponentially, not in a straight line.
This is why a common shorthand holds up well across a useful range. Degradation roughly doubles for every 10°C rise. It is a simplification of the real curve. Still, it captures the core idea. Small temperature increases produce big jumps in degradation rate.
Why Activation Energy Varies by Material
First, not every part of a battery responds to temperature the same way. Activation energy is specific to each material and each reaction. That number determines how sensitive a given process is to heat.
Research measuring activation energy across battery materials found real differences. This number is a key input for modeling the Arrhenius relationship between temperature and battery degradation. Graphite, the typical anode material, showed a low activation energy of about 0.025 eV. LFP, by contrast, showed a notably higher activation energy of about 0.116 eV. A higher activation energy generally means a steeper response to temperature changes. That shows up in how the material conducts and how it ages. Worth noting: this figure comes from a battery-testing equipment vendor’s own case study, not a peer-reviewed paper. The methodology is transparent and the number checks out, but it sits in a different sourcing tier than a journal citation.
This matters for a simple reason when applying the Arrhenius relationship between temperature and battery degradation to a real system. Generic degradation guidance often gets built around chemistries like NMC, not LFP specifically. Borrowing that number for an LFP system can produce a genuinely wrong degradation estimate. Accurate modeling needs an activation energy number that matches the real chemistry in the cell.
Temperature Battery Degradation Arrhenius: Why Cold Also Accelerates Aging
Most practical guides frame temperature as a single dial. Hotter is worse, colder is better, full stop. But the real picture is more interesting than that. It matters for how you design a system.
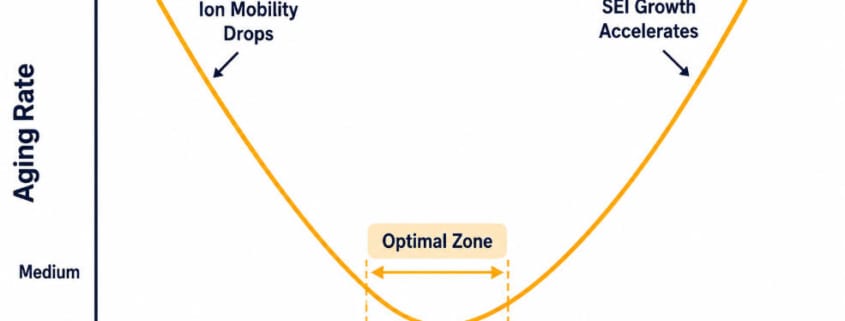
Research plotting battery aging rate against temperature found something specific. That research plotted the Arrhenius relationship between temperature and battery degradation directly. It is a V-shaped curve. Aging rate is not lowest at the coldest temperature tested. Instead, it hits a minimum at some optimal middle temperature. Then it rises again as conditions get colder still. Both ends of the curve show accelerated aging. Only the mechanism differs. Worth noting: the underlying study used NCA and NMC111 cells, not LFP. The V-shape itself is generally treated as chemistry-general in the literature, but the exact crossover point likely shifts somewhat for LFP specifically.
First, on the hot side, the story is the one covered above. Heat speeds up SEI growth and other side reactions directly. This runs through the same Arrhenius relationship covered above. For the deeper chemistry behind that specific mechanism, see our guide on SEI Layer Growth and Lithium Plating in LFP Cells. It covers the heat-driven side in full.
Then on the cold side, the mechanism is different. First, ion mobility slows down. Then internal resistance rises. Under high current in the cold, this can push cells toward lithium plating conditions. That is a different, worse outcome than simple slow aging. Instead, the V-shape is not really one curve. Instead, it is two separate degradation pathways overlapping. One dominates at high temperature. The other dominates at low temperature. A sweet spot sits in between, where both are minimized.
Temperature Battery Degradation Arrhenius and the Calendar vs Cycle Aging Link
Temperature does not degrade a battery through one single pathway. Instead, it touches both of the two aging processes that run in every cell at once.
Calendar aging is the slow degradation that happens even at rest. It follows the Arrhenius relationship closely. A cell sitting idle in a hot enclosure loses capacity faster than an identical cell sitting idle in a cool one. That difference comes purely from elevated reaction rates. Cycle aging is the degradation from active charging and discharging. It gets a second temperature effect layered on top. Heat during active cycling adds mechanical and chemical stress. This goes beyond what calendar aging alone would predict.
For the full breakdown of how these two aging pathways interact, see our guide on Calendar Aging vs Cycle Aging in LFP Batteries. It covers how operators separate them in real data. Temperature is the variable that connects both halves of that picture.
Applying This at BESS Scale: Why Uniformity Matters as Much as Average Temperature
Individual cell chemistry is only half the story. A BESS is not one cell. Instead, it is thousands of cells. The Arrhenius relationship has a brutal implication for how they age together.
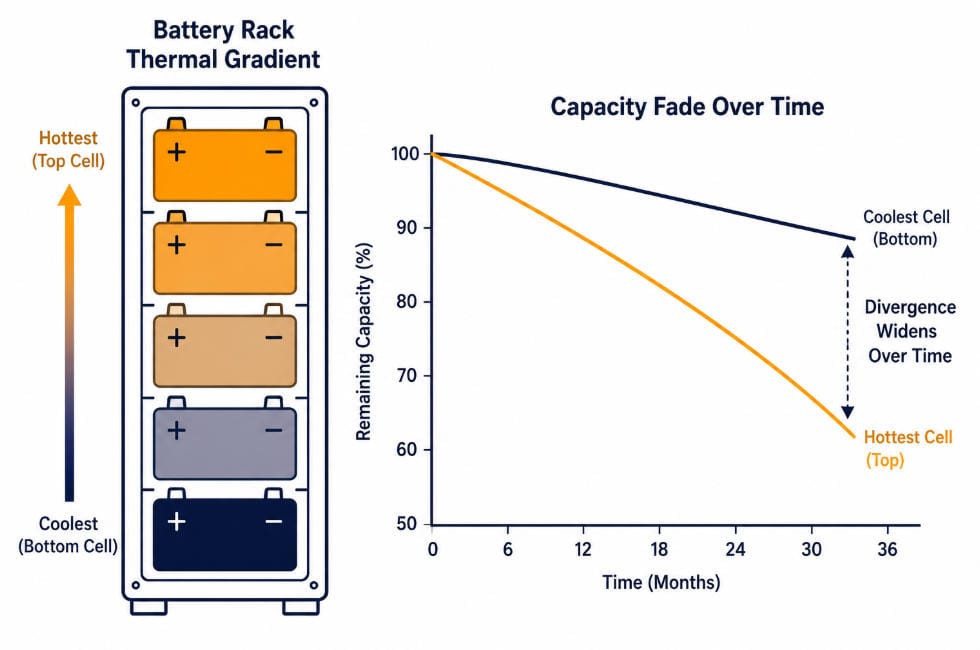
Degradation rate scales exponentially with temperature, not in a straight line. Small temperature differences between cells in the same rack do not average out. Instead, they compound. A cell running just a few degrees hotter than its neighbors ages meaningfully faster on its own. This can come from airflow patterns or its position in the rack. Over years of operation, that early divergence widens rather than closing. The hotter cell keeps aging faster at every step.
This is exactly why temperature uniformity across a BESS matters as much as the average temperature target. For the detailed engineering breakdown of safe temperature spread limits, see our guide on Cell Temperature Gradients in BESS. It covers what causes uneven heating in a rack. The Arrhenius relationship explained here is the underlying reason that guide’s ΔT limits exist in the first place.
Putting a Number on It: A Simple Arrhenius Comparison
The exponential relationship is easier to trust with a concrete example. Take two identical LFP cells. One runs at a steady 25°C. The other runs at 45°C, a 20°C difference that is common between a well-cooled and a poorly-cooled enclosure.
Using the 10°C-doubling shorthand, the hotter cell does not age 20% faster or even 50% faster. It ages roughly four times faster, since two separate 10°C jumps each roughly double the rate. A design choice that looks like a modest thermal compromise on paper can matter a lot in practice. It can translate into a dramatically shorter real-world service life. This is the practical payoff of understanding the Arrhenius relationship instead of just following a cooling checklist blindly.
The same logic applies in reverse. Pulling a system from 45°C down to 35°C can meaningfully extend service life. That is still a fairly warm operating point. It still runs warmer than the 25°C reference point most datasheets use. Incremental cooling improvements pay off at every point along the curve, not just at the extremes.
What This Means for Thermal Design Choices
None of this changes the practical playbook much. Still, it explains why that playbook works the way it does.
Liquid cooling outperforms air cooling on more than comfort. It holds cells within a tighter temperature band. It also reduces cell-to-cell spread. Both matter directly because of the exponential relationship covered above. For the full comparison of cooling approaches, see our guide on Liquid vs Air Cooling System Use in BESS. It covers the tradeoffs in detail. Cold-climate design deserves the same weight as hot-climate design, not less. The V-shaped curve means both extremes carry real degradation risk. For that side of the picture, see our guide on Cold-Climate BESS Design. It covers discharge-side cutoffs in cold weather.
For a practical, rule-of-thumb breakdown of temperature’s effect on cycle life, see our existing guide on Impact of Temperature on LiFePO₄ Batteries Cycle Life. It applies the 10°C-doubling shorthand to real cycle numbers. That guide covers the practical numbers. This one covers the mechanism behind them.
Temperature Battery Degradation Arrhenius: Quick Reference
| Factor | What It Means |
| Core relationship | Degradation rate scales exponentially with temperature, not linearly |
| Common shorthand | Roughly doubles per 10°C temperature increase |
| Activation energy | Chemistry-specific; higher values mean steeper temperature sensitivity |
| Hot-side mechanism | Accelerated SEI growth and side reactions |
| Cold-side mechanism | Slower ion mobility, higher resistance, elevated plating risk under load |
| Curve shape | V-shaped, with a minimum-aging point, not a straight line |
| BESS-scale implication | Uniformity matters as much as average temperature, due to compounding |
Frequently Asked Questions
In the Arrhenius relationship between temperature and battery degradation, does the 10°C-doubling rule apply exactly, or is it a simplification?
It is a simplification. The real relationship is a smooth exponential curve. The doubling shorthand holds up reasonably well across a normal operating range. Still, it is an approximation, not an exact law.
Why does LFP have a different activation energy than other chemistries?
Activation energy depends on the specific materials and reactions involved. LFP’s cathode chemistry behaves differently from NMC or NCA under the same conditions. Its measured activation energy differs as a result. Generic lithium-ion guidance does not always transfer cleanly as a result.
Is cold temperature ever actually good for battery life?
There is a minimum-aging point, and it sits below room temperature for some cells. But going too cold introduces its own accelerated aging pathway. Slower ion mobility and higher plating risk drive it. Colder is not simply better without limit.
Under the Arrhenius relationship between temperature and battery degradation, does uniformity really matter more than average temperature?
Both matter, but uniformity is the more commonly underestimated factor. Degradation compounds exponentially. A hotter pocket of cells in an otherwise well-managed system can become a persistent weak point. Over time, that weak point drags down pack-level performance.
Further Reading
Battery Degradation in BESS: Causes, Mechanisms & Mitigation
SEI Layer Growth and Lithium Plating in LFP Cells
Calendar Aging vs Cycle Aging in LFP Batteries
Impact of Temperature on LiFePO₄ Batteries Cycle Life
Cold-Climate BESS Design: Discharge-Side DCIR and Premature Cutoffs