
IEC 60909 Explained: AC Short-Circuit Currents for BESS
A short circuit on the grid side of a BESS behaves nothing like one on the DC bus. IEC 60909 is the standard engineers use to calculate that AC-side fault current.
It also sizes the breakers, relays, and busbars on the grid-facing side of the system.
| Quick Answer IEC 60909 is the IEC standard for calculating short-circuit currents in three-phase AC systems. Its current edition, IEC 60909-0:2016, added rules for how inverter-connected sources like BESS and solar contribute to a fault. So this update matters directly for grid-interconnection and protection-coordination studies. |
What Is IEC 60909?
The standard covers short-circuit current calculation in three-phase AC systems, both low-voltage and high-voltage. IEC Technical Committee 73 develops it, and that’s a detail worth knowing.
That’s the same committee behind IEC 61660, the DC-side equivalent for auxiliary systems. So the two standards share a family resemblance, and not by accident.
The current edition, IEC 60909-0:2016, replaced a 2001 first edition. It’s a full technical revision, not just a minor tweak.
First, the method places an equivalent voltage source at the fault location. Engineers then work out the fault current from that source. They add the impedance of every AC component between it and the fault point.
IEC 60909’s Maximum and Minimum Short-Circuit Current
Like IEC 61660, IEC 60909 calls for two separate calculations, not one. First, the maximum short-circuit current sets equipment ratings.
The minimum short-circuit current does something different. It sets fuse and relay ratings, and it also checks whether protection will trip fast enough during a fault.
Each case runs on its own assumptions, since network configuration and available sources both shift the result.
How IEC 60909 Models Fault Current Sources
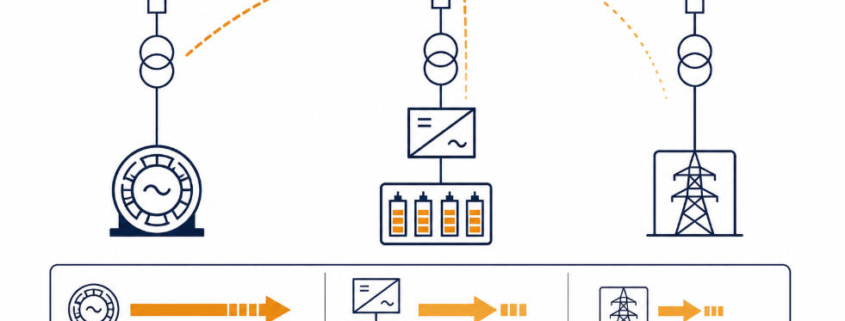
IEC 60909 walks through nearly every source type on an AC system. That list covers network feeders, transformers, overhead lines and cables, synchronous generators, and asynchronous motors.
Each source then gets its own impedance model and its own share of the total fault current.
A network feeder is modeled first, using the utility’s own maximum and minimum short-circuit power at the connection point.
Then transformers, cables, and lines each add their own resistance and reactance in series. This works outward from that feeder toward the fault.
Traditional generation still dominates most of this picture. First, a synchronous generator can feed many times its rated current into a nearby fault.
That’s because the fault current is limited mainly by the machine’s own internal reactance, not by any active control.
Picture a substation fed by a large synchronous generator on one side and a smaller BESS on the other. A fault right at the busbar draws heavily from the generator, since its current is bounded only by internal reactance.
The BESS contributes too, but through a very different mechanism, covered next.
Asynchronous motors matter here too, since they aren’t purely passive. Large motors briefly feed current back into a nearby fault as they slow down. So the standard includes a separate check for whether that contribution is large enough to count.
Why the 2016 Edition of IEC 60909 Matters for BESS
IEC 60909’s 2016 edition made a genuinely significant change. It added explicit rules for wind power station units and for power station units with full-size converters. Neither type existed in any meaningful way when the 2001 edition published.
A BESS, meanwhile, connects to the grid through exactly this kind of full-size converter: the PCS. So this update is what actually lets engineers model a BESS’s AC-side fault contribution under a current, recognized standard.
Before 2016, engineers had to adapt rules meant for generators instead, which is a poor fit for how a PCS actually behaves.
How a BESS Contributes to an AC Fault
#image_title
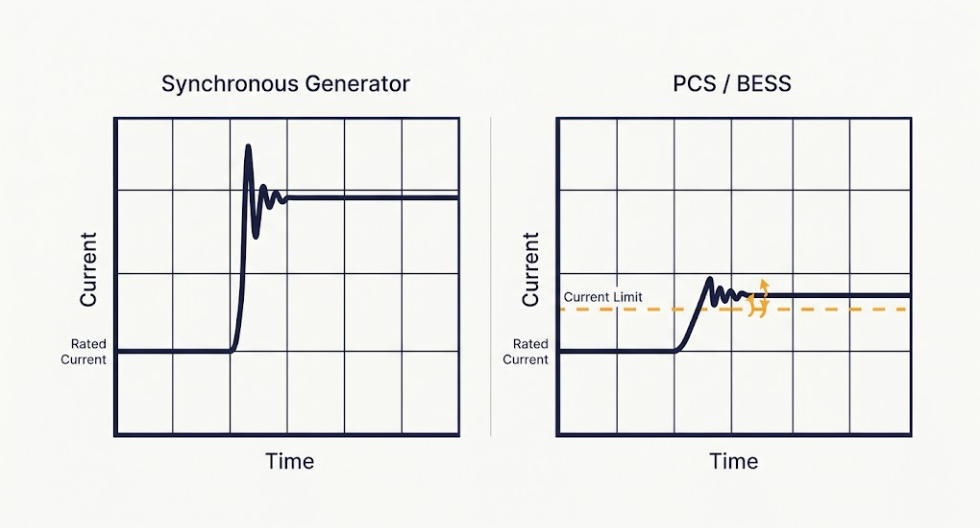
A synchronous generator’s fault current is set by its impedance, not by any active control loop, while a PCS works on a different principle entirely. It behaves very differently.
Since the PCS is a power-electronic device, its control system actively regulates the fault current it can push out. IEC 60909 treats it as a current-regulated source instead of an impedance-limited one.
So that current stays capped close to the converter’s own rated current. It doesn’t spike the way a generator’s current can, because the control loop won’t let it.
What This Means for Protection Coordination
This distinction then has real consequences for a project. A feeder fed mostly by BESS and solar can produce far less fault current. That’s true even compared with the same feeder fed by traditional generation.
Many protection schemes were designed around large, generator-driven fault currents. So a low-fault-current feeder can be harder to detect and clear quickly. Under-reach becomes a real risk once the fault current gets close to normal load current.
IEC 60909-0:2016 gives engineers a standards-based way to calculate that lower contribution accurately. That’s a real improvement over guessing at it or borrowing a generator-based rule of thumb.
It’s also why relay settings tuned for a generator-heavy feeder often need a fresh look once a BESS joins the mix.
IEC 60909 vs. Related Standards
IEC 60909 doesn’t work alone on a BESS project. But a few related standards cover adjacent ground.
| Standard | Relationship to IEC 60909 |
|---|---|
| IEC 61660 | The DC-side equivalent, covering short-circuit currents in DC auxiliary systems instead of the AC side. Both standards come from the same technical committee. |
| IEC 62933-5-2 | The BESS safety standard, which addresses electrical safety more broadly rather than fault-current calculation methodology specifically. |
| IEEE 2800-2022 | A newer, US-focused standard for interconnecting inverter-based resources, covering performance requirements alongside fault behavior. |
The IEC 61660 connection is worth calling out directly. A full BESS fault study often needs both — this standard for the grid-facing AC side, and IEC 61660 for the battery-facing DC side.
What This Means for BESS Grid-Interconnection Studies
For a project engineer, IEC 60909-0:2016 is the tool for AC-side protection coordination and utility interconnection studies. First, model the PCS as a current-regulated source, not a synchronous one.
A BESS project often sits on a feeder alongside other inverter-based generation, like solar. So check the combined fault contribution rather than treating each source alone. Utilities reviewing an interconnection application will still expect exactly this kind of AC-side study.
Frequently Asked Questions
Does IEC 60909 apply to battery energy storage systems?
Yes, through its current edition. IEC 60909-0:2016 added specific rules for power station units with full-size converters, covering how a BESS’s PCS contributes to an AC-side fault.
What’s the difference between IEC 60909 and IEC 61660?
This standard calculates short-circuit currents on the AC side of a system. IEC 61660 covers the DC side instead, such as the battery and busbar side of a BESS.
Why does a BESS contribute less fault current than a generator?
A PCS is a current-regulated power-electronic source, not an impedance-limited one. Its control system caps the fault current close to its own rated current, unlike a synchronous generator.
Is IEC 60909-0:2016 the current edition?
Yes. It replaced the 2001 first edition and remains the standard’s current edition as of 2026.
Who uses IEC 60909 on a BESS project?
Protection engineers and utility interconnection teams use it for AC-side fault current, breaker and relay sizing, and protection coordination studies.
Further Reading
For the DC side of a BESS fault study, see our guide to BESS short-circuit protection.
DC and AC bus sizing both fit into the broader spec picture — see Understanding BESS Specifications.
A PCS’s broader grid-fault behavior is covered in Grid-Forming vs. Grid-Following BESS and PCS Overvoltage Protection.
Ride-through behavior during a voltage sag is covered in LVRT and HVRT Ride-Through.
For the broader BESS safety-standard landscape, see IEC 62933-5 Safety Standards.
References
IEC 60909-0:2016, Short-circuit currents in three-phase a.c. systems – Part 0: Calculation of currents. International Electrotechnical Commission.
L. Thurner and M. Braun, “Vectorized Calculation of Short Circuit Currents Considering Distributed Generation — An Open Source Implementation of IEC 60909,” arXiv preprint — describes the standard’s treatment of short-circuit current contribution from distributed generation.
IEC 61660 Explained: Calculating DC Short-Circuit Currents
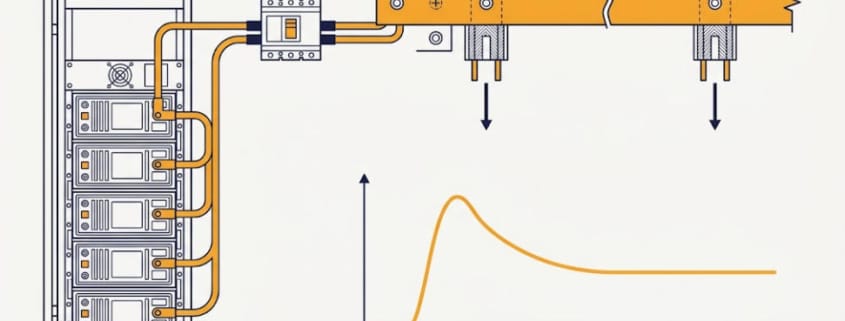
A short circuit on a DC bus behaves very differently from one on an AC grid. IEC 61660 is the standard engineers use to calculate those DC fault currents in battery storage systems and substations. That way, protection devices get sized right.
| Quick Answer IEC 61660 is a three-part IEC standard for calculating short-circuit currents on DC auxiliary buses. It covers rectifiers, batteries, capacitors, and DC motors. BESS engineers still use it today, even though it predates lithium-ion and was written for lead-acid batteries. |
What Is IEC 61660?
IEC 61660 first appeared in 1997. Its full title is “Short-circuit currents in d.c. auxiliary installations in power plants and substations.” IEC Technical Committee 73 developed it. That same committee owns IEC 60909, the equivalent standard for AC systems.
The standard exists because DC faults don’t behave like AC ones. An AC fault current oscillates and decays in a set way.
A DC fault current rises and falls on its own curve instead. Each source shapes that curve in its own way.
IEC 61660-1 is still listed by the IEC as active and current, even though no revision has replaced it since 1997.
This matters for BESS design. Every battery rack, busbar, and DC disconnect on the storage side of the inverter sits on a DC bus.
So when a fault happens there, protection devices must clear a current whose shape this standard was built to predict.
The Three Parts of IEC 61660
The standard is split into three linked documents. Each one covers a different piece of the fault-current picture.
| Part | Title | What It Covers |
|---|---|---|
| Part 1 | Calculation of short-circuit currents | The core method: peak current, quasi-steady-state current, and how to combine several sources |
| Part 2 | Calculation of effects | Mechanical and thermal stress on rigid conductors and busbars, caused by the current from Part 1 |
| Part 3 | Examples of calculations | A technical report with worked examples, so engineers can check their own math against a known result |
Part 1 does the heavy lifting for most BESS projects. From there, Part 2 turns that current into a mechanical design check, while Part 3 serves as a reference for checking the numbers.
Part 3 wasn’t even finished when Part 1 published in 1997. The original foreword lists it as “in preparation,” and it only appeared a few years later as a technical report.
How IEC 61660-1 Calculates DC Short-Circuit Current
Two values matter most to a protection engineer.
Two Values That Matter: Peak and Quasi-Steady-State Current
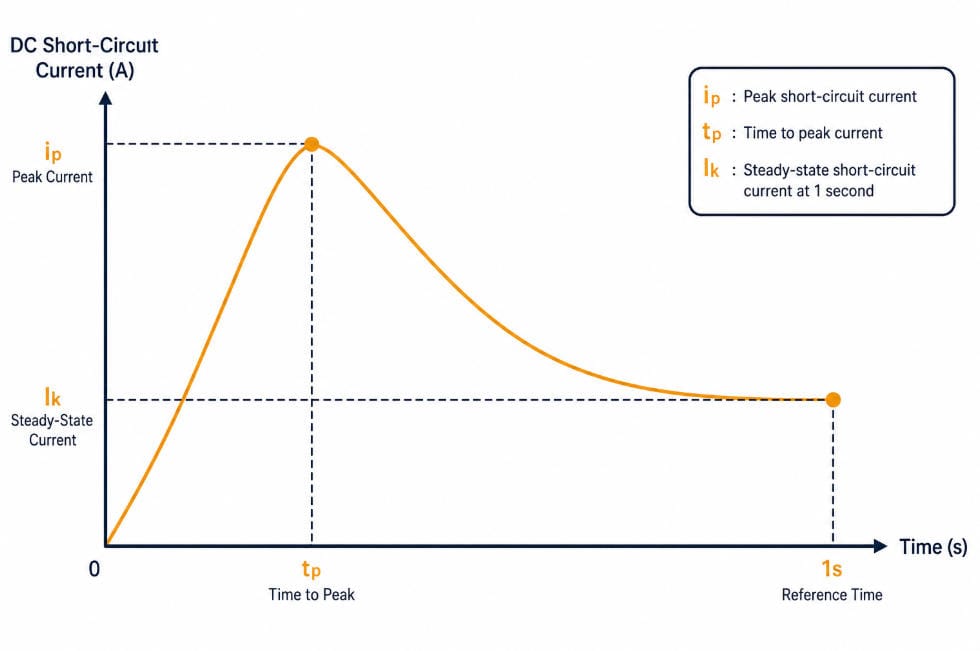
The peak short-circuit current, written as ip, is the highest instant current a fault ever reaches. So this value sets the rating for breakers, fuses, and busbars, since they must survive that first spike without failing.
The quasi steady-state current, written as Ik, is the current level one second after the fault starts.
Engineers then use this lower, settled value to set fuse and relay trip points, since it reflects what a slower device actually has to clear.
Between those two points sits the time to peak, tp. It tells engineers how fast the current climbs before it starts to fall.
Maximum and Minimum Short-Circuit Current
The standard actually calls for two separate calculations, not one. For equipment ratings, engineers work from conditions that produce the highest possible fault current: cooler conductor resistance and a fully charged battery.
For fuse and protection settings, they work from conditions that produce the lowest fault current instead: conductor resistance at the system’s maximum operating temperature, and a battery closer to fully discharged. Each case still has its own peak and quasi-steady-state current, so a full study runs through both.
Four Sources of DC Fault Current
The method models four types of equipment that can feed a DC short circuit:
- Rectifiers in a three-phase AC bridge connection
- Stationary lead-acid batteries
- Smoothing capacitors
- DC motors with independent excitation
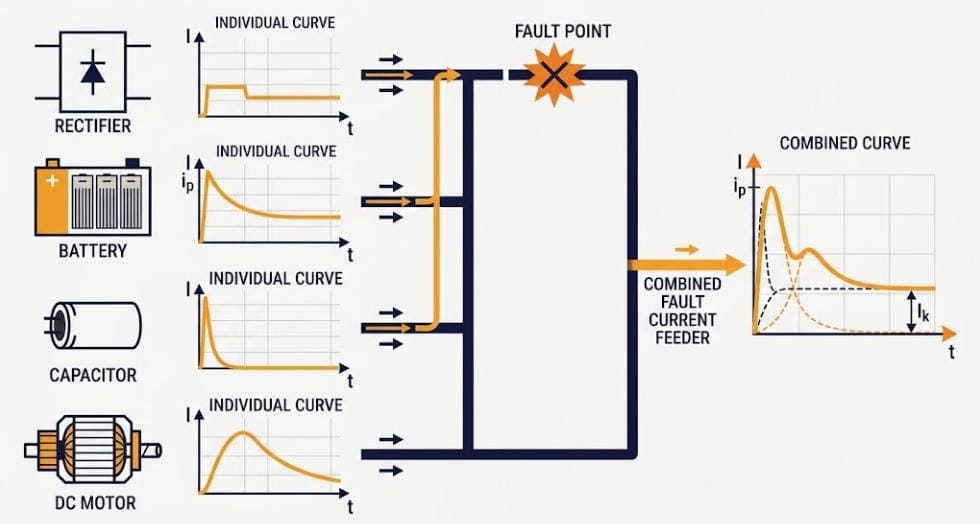
Each source has its own current shape. A rectifier’s fault current follows the AC network behind it.
Meanwhile, a battery’s current rises with a time constant set by its own resistance and inductance, and a capacitor discharges fast, then decays.
A motor is different again, since it keeps feeding current for a short time while its stored mechanical energy converts back into electrical energy.
When more than one source can reach the same fault point, a correction factor (the standard calls it sigma) combines their peaks into one worst-case total. This matters because the individual peaks don’t always line up in time.
Picture a substation battery room with a rectifier charger and a battery bank feeding the same DC bus. The rectifier’s current might peak in a few milliseconds, while the battery’s current keeps climbing for longer, since its inductance slows the rise. Because of that timing gap, the correction factor keeps the combined peak from being just a simple sum of two separate maximums.
Why IEC 61660 Still Matters for Lithium-Ion BESS
The standard was written in 1997, years before lithium-ion reached grid-scale storage. That gap still matters for BESS engineers today.
The Lithium-Ion Gap
The battery clause only models stationary lead-acid cells, and it gives no official method for lithium iron phosphate or other lithium-ion chemistries. So a literal reading of the standard doesn’t cover the battery technology in most BESS projects built today.
How Engineers Work Around It Today
In practice, the industry leans on two workarounds.
First, many engineers treat a lithium-ion string’s short-circuit response like a capacitor discharge. Both show a fast spike, then a decay, and the standard already has a capacitor method built in.
Second, most BESS integrators pull short-circuit current data straight from the cell or rack maker’s datasheet. They then feed those figures into the rest of the calculation, alongside the rectifier and capacitor terms.
Commercial short-circuit analysis software built around this method now adds lithium-ion battery models as an extension beyond the base document. Engineers keep the same combination approach while plugging in a chemistry-correct source model.
IEC 61660 vs. Related DC and BESS Standards
This standard doesn’t work alone, since a few other documents reference it or cover nearby ground.
| Standard | Relationship to IEC 61660 |
|---|---|
| IEC 60909 | The AC equivalent. This standard’s own foreword names IEC 60909 as a companion reference for the rectifier’s AC-side contribution. |
| IEC 62485-2 | Covers stationary battery installation safety and cites this method for the short-circuit figures that feed protection and ventilation design. |
| IEC 62933-5-2 | The BESS safety standard covers electrical safety more broadly, including how DC-side fault-current figures feed into protection design. |
| IEC 62619 | Covers cell and battery safety testing rather than system-level fault current, so it complements this standard instead of overlapping it. |
What This Means for BESS DC Bus Protection Design
For a project engineer, the takeaway is simple: first, size DC breakers and busbars to the peak current, ip.
Set fuse and relay trip points from the quasi-steady-state current, Ik. Then combine every source that can feed the same fault point, not just the battery.
Since the method predates lithium-ion, document which battery-current approach the design used. Note whether it was capacitor-equivalent modeling or manufacturer datasheet figures, so the calculation can be reviewed and repeated later.
Also check Part 2 once the current is known. A busbar sized only for steady-state load current can still fail mechanically under a DC fault it was never checked against.
Frequently Asked Questions
Does IEC 61660 apply to lithium-ion BESS?
Not directly, since the battery clause only covers stationary lead-acid batteries. Engineers commonly adapt the capacitor model instead, or use manufacturer-supplied short-circuit data for lithium-ion strings.
What’s the difference between IEC 61660 and IEC 60909?
IEC 60909 calculates short-circuit currents in three-phase AC systems. This standard calculates them on the DC side instead, where fault currents don’t oscillate and decay the same way.
Is there a newer edition of IEC 61660?
The first edition dates to 1997, with corrigenda issued in 1999 and 2000. Even so, no second edition has replaced it as of 2026.
What does Part 2 cover that Part 1 doesn’t?
Part 1 calculates the fault current itself, while Part 2 uses that current to calculate the mechanical and thermal stress it puts on rigid conductors and busbars.
Who uses IEC 61660 in a BESS project?
Protection and electrical engineers use it to size DC breakers, fuses, and busbars during the design phase, well before commissioning.
Further Reading
For more on how DC-side faults are handled in BESS design, see our guide to BESS short-circuit protection.
To see how DC bus sizing fits into overall system specs, read Understanding BESS Specifications.
For how a BMS ties into protection design, see BMS Functional Safety, HARA, and FMEA.
For the broader BESS standards landscape, see IEC 62933 Energy Storage Standards, IEC 62933-5 Safety Standards, and our BESS Certifications Guide.
References
IEC 61660-1:1997, Short-circuit currents in d.c. auxiliary installations in power plants and substations – Part 1: Calculation of short-circuit currents. International Electrotechnical Commission (with Corrigenda 1:1999 and 2:2000).
IEEE Industry Applications Society, “DC Arc Flash: History, Physics, and Modeling for Battery, Capacitor, and PV Systems,” first presented at the IEEE Electrical Safety Workshop (ESW) 2023 — covers DC incident-energy modeling approaches for large battery systems, including lithium-ion, and their relation to standards-based short-circuit current models.
Fault Ride-Through Features: The PCS Hardware and Control Functions Behind LVRT/HVRT Compliance
Fault ride-through features are what actually turn a grid-code curve into real PCS behavior during a fault. A ride-through curve on a datasheet is a target, not a mechanism — the hardware and control functions inside the PCS are what determine whether a unit actually meets that target when a real fault hits the line. This article breaks down what those fault ride-through features are and how they work together, from gate-driver-level protection up through plant-level coordination.
| Quick Answer Fault ride-through features are the hardware and control functions inside a PCS — current limiting, DC-link protection, and DC-side energy absorption — that let it meet a grid-code ride-through curve. A compliant curve on a datasheet doesn’t say which of these features a PCS actually implements. |
Our guide to LVRT and HVRT ride-through covers the grid codes and voltage-against-time curves that compliance is measured against. This article goes one level deeper and walks through the specific hardware and control features inside the PCS that make ride-through possible in the first place. Two PCS units can both carry a compliant ride-through curve on their datasheets. They can still behave very differently under an actual fault, because the curve describes an outcome, not an implementation.
Two Layers of Fault Ride-Through Response
A PCS handles a fault in two layers. The layers operate on very different timescales. Both layers have to work correctly, or fault ride-through features never get the chance to activate.
- Hardware-level protection reacts in microseconds to low milliseconds. Its only job is to keep the semiconductors from destroying themselves. It has no concept of a grid code.
- Control-level ride-through reacts over tens to hundreds of milliseconds. This layer decides whether the PCS stays connected, injects reactive current, and follows the shape of the required curve.
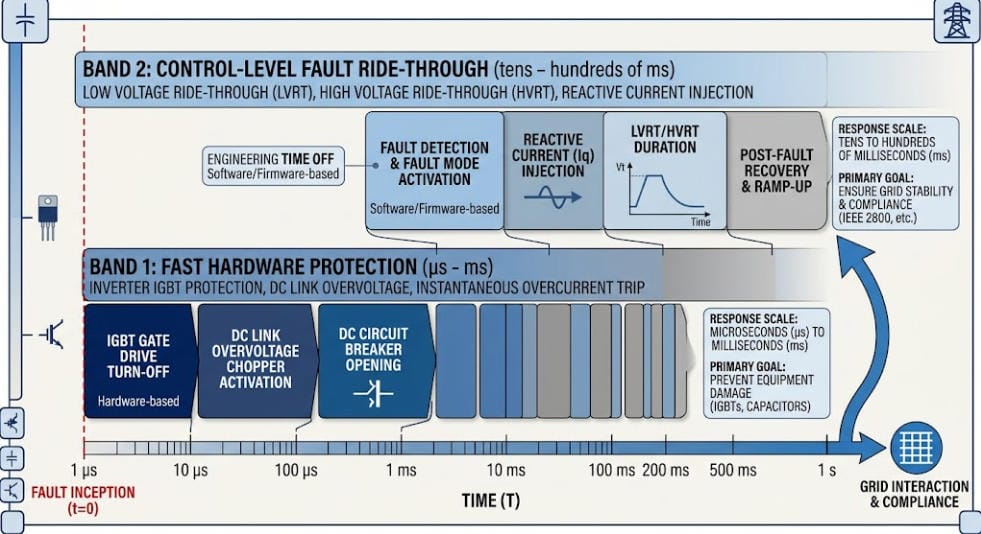
If the hardware layer trips protectively, the control layer never gets the chance to ride through anything. Whichever layer is more conservative sets the PCS’s real fault ride-through capability — not the control algorithm alone.
Hardware-Level Fault Ride-Through Features
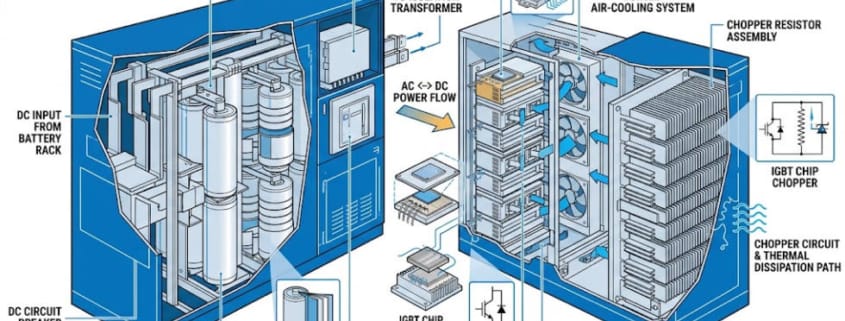
The fastest protection in a PCS sits at the gate-driver level. It senses the collector-emitter voltage of each IGBT to detect desaturation, a condition that signals an output short or a failing device. Engineers tune desaturation-sensing circuits deliberately to avoid nuisance tripping during normal switching transients. The circuits still have to catch a genuine fault fast enough to protect the device.
DC-Link Overvoltage Protection Features
Fault ride-through duty puts stress on the DC side, not just the AC side. During a grid voltage swell, or when active power suddenly can’t be exported at the pre-fault rate, energy backs up into the DC-link capacitor. Left unmanaged, this drives DC-link voltage past the semiconductors’ safe operating limit. The standard hardware answer is a brake chopper: a switch and resistor in series across the DC bus. The chopper circuit compares DC-link voltage against a threshold and switches accordingly, so it dumps excess energy as heat only when the bus voltage would otherwise exceed its saturation limit. Well-designed implementations fire the chopper only when needed. That way, the system wastes no energy during a swell the DC side can absorb on its own.
The wider category of hardware fault ride-through features for DC-link protection includes DC chopper resistors, dynamic braking resistors, and, in some designs, superconducting or bridge-type fault current limiters. These originated in wind turbine converters. The underlying function — dumping fault-driven excess energy somewhere the semiconductors can tolerate — applies directly to PCS design for solar and BESS.
Chopper sizing matters beyond a single event. A resistor sized to survive one fault safely can still overheat if the plant experiences repeated faults in close succession. Repeated faults are common on weak or fault-prone feeders. Duty-cycle rating, not just peak wattage, is the number to check when specifying the chopper.
Control-Level Fault Ride-Through Features
Once the hardware layer confirms the fault is survivable, the control layer decides how the PCS behaves for the rest of the ride-through window. This matters most for grid-forming PCS designs. Utility-scale BESS increasingly uses grid-forming designs because they set their own voltage reference rather than tracking the grid through a phase-locked loop. Three main control-level fault ride-through features keep grid-forming output current within hardware limits during a fault:
- Current saturation: the controller switches into a current-controlled mode and fixes the current reference at the PCS’s maximum rated output for the duration of the fault.
- Virtual impedance: the controller inserts an artificial impedance into its internal voltage-reference calculation. This lowers the commanded voltage in proportion to output current and limits current without a hard mode switch.
- Priority-based saturation: a blended approach that combines current saturation and virtual impedance. It captures the current-limiting reliability of the first method with the smoother, more predictable transient response of the second.
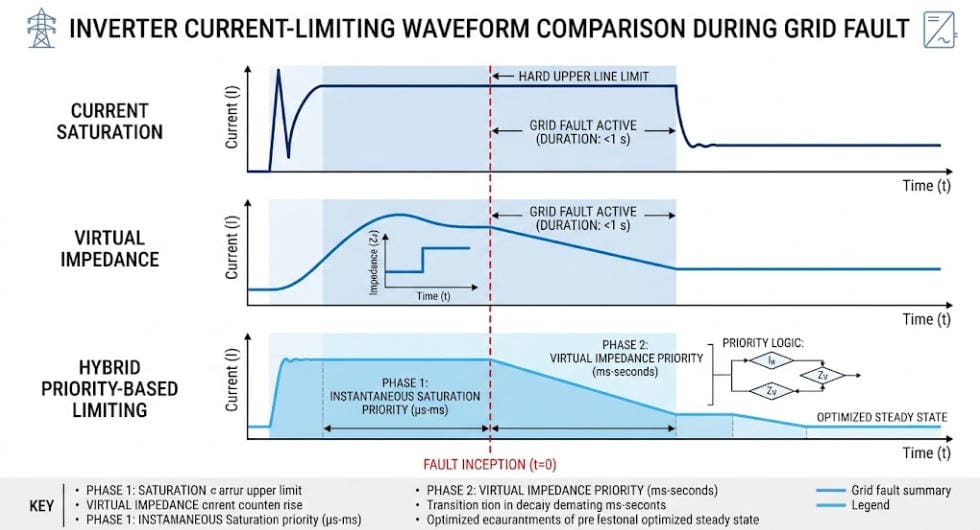
These three approaches trade off differently. Engineers can tune virtual-impedance methods to output more reactive power during the fault than a plain current-limiting approach, which improves voltage support at the point of connection. That only works if they tune the virtual impedance gain correctly. A gain value that’s too small fails to limit current under a severe sag. A gain that’s too large can trigger instability. Published tuning work generally lands on a gain factor between roughly 5 and 10 to balance decoupling and damping.
Timing the virtual impedance is its own design problem. Too little virtual impedance risks depleting the DC bus; too much can cause a grid-forming unit to lose synchronism with other units on the same plant. That risk becomes real once a plant has more than one grid-forming PCS responding to the same event independently.
Fault Ride-Through Features for Unbalanced (Asymmetrical) Faults
Most faults on a distribution or sub-transmission feeder are unbalanced — single-line-to-ground or line-to-line — not the symmetrical three-phase dip used in headline grid-code curves. Unbalanced faults introduce negative-sequence voltage and current components. A control loop built only for positive-sequence quantities can’t regulate these components correctly. Some grid-forming control architectures address this by working directly in the stationary reference frame rather than the conventional rotating (synchronous) frame. This design choice simplifies separating and limiting positive- and negative-sequence fault current independently. Engineers make this control-architecture decision well before a fault occurs — a plant controller can’t add it after the fact.
Fault Ride-Through Features That Differ Between BESS and Solar-Only PCS
A solar PCS has one energy source: whatever the array produces at that instant. It can curtail that output but not absorb energy. A BESS PCS has a battery on the DC side that can actively source or sink energy. That difference changes what fault ride-through features can actually do in practice.
- During a voltage swell (HVRT), a BESS can charge from the surplus DC-side energy instead of dumping it through a brake chopper — but only if the BMS accepts a fast charge-current step, not just a steady-state charge-power limit.
- State of charge and cell temperature set the real headroom. Near full SOC or at temperature extremes, the BMS derates charge current. That derating shrinks how much of a voltage swell the battery can absorb and pushes the PCS back toward reactive-current absorption or a supplemental dump resistor.
- This means the PCS-BMS communication interface needs a fast current-limit path for ride-through events. That path has to run faster than the slower power-limit updates the system uses during normal charge/discharge scheduling.
None of this shows up on a PCS current-vs-time datasheet curve, because the curve is a converter-side spec. Whether the battery can actually support that curve under real SOC and temperature conditions is a system-level integration question, not a spec-sheet question.
Converter Topology and Fault Ride-Through Behavior
Topology choice shapes how fault current is distributed and controlled inside the converter itself.
- Two-level converters concentrate fault current stress on fewer semiconductor devices per phase leg. This simplifies control but raises per-device stress during a fault.
- Multilevel topologies (such as neutral-point-clamped or modular multilevel designs) spread that stress across more devices. They allow finer control of output voltage during unbalanced current injection, at the cost of more complex coordinated current-limiting logic across levels.
Plant-level topology matters too. Whether the site uses a string architecture or a small number of centralized PCS units changes how individual-unit current limits sum to the plant’s response at the point of interconnection. See our String vs. Centralized BESS PCS comparison for how that choice plays out beyond fault ride-through behavior.
Plant Controller Coordination for Fault Ride-Through Features
A single PCS unit’s current-limiting response is only half the picture. On a multi-inverter plant, the plant controller must aggregate every unit’s local response into a combined output at the point of interconnection (POI). That combined output has to match the required curve. Individual units sometimes apply current limiting independently, with slightly different thresholds or timing. When that happens, the combined POI response can differ meaningfully from what any single unit’s test report shows. Communication latency between the plant controller and individual PCS units becomes a real design constraint here. Ride-through windows can run as short as tens of milliseconds — too short for a slow polling cycle to matter.
Specifying Fault Ride-Through Features When Selecting a PCS
Treat fault ride-through features as a checklist to verify individually, not a single line item to take on faith.
- Ask which current-limiting algorithm the PCS implements — current saturation, virtual impedance, or a priority-based blend — and how the manufacturer tuned the gain or setpoint, not just whether it claims a compliant curve.
- Ask whether the manufacturer validated the DC chopper or dump resistor for repeated, closely spaced faults, not a single worst-case event.
- Confirm the BMS charge-current step response time. Check whether it’s fast enough to support the PCS’s intended DC-side energy-absorption strategy during HVRT.
- Confirm whether the unit is grid-following or grid-forming, and how its behavior changes during any momentary-cessation window.
- Request fault-current test evidence at the plant-controller level, aggregating multiple units, not only single-unit type-test results.
Key Fault Ride-Through Features at a Glance
| Feature | Why It Matters |
|---|---|
| Gate-driver desaturation detection | Fastest layer of protection; determines whether the control layer ever gets to ride through the fault |
| DC chopper / dump resistor | Keeps DC-link voltage within limits during a swell; duty-cycle rating matters more than peak wattage |
| Current saturation vs. virtual impedance vs. priority-based | Different trade-offs between reliability, reactive support, and transient smoothness |
| Positive/negative-sequence current control | Required for the unbalanced faults that dominate real-world fault statistics |
| BESS DC-side energy absorption | Lets a BESS actively soak up swell energy instead of only dissipating it — subject to SOC and thermal derating |
| Plant controller aggregation | Individual-unit compliance doesn’t guarantee POI-level compliance on a multi-inverter plant |
Frequently Asked Questions About Fault Ride-Through Features
What’s the difference between hardware-level and control-level fault ride-through features?
Hardware-level features, such as IGBT desaturation detection, react in microseconds to protect the semiconductors. They have no awareness of grid-code requirements. Control-level ride-through features operate over tens to hundreds of milliseconds. This layer actually follows the required voltage-against-time curve. Hardware protection takes priority whenever the two layers conflict.
Why does a BESS have an advantage over a solar-only plant during HVRT?
A BESS can actively charge its battery to absorb surplus DC-side energy during a voltage swell. A solar-only PCS can’t do this — it has no equivalent energy sink beyond curtailing the array.
What is virtual impedance current limiting?
It’s a control technique where the inverter’s controller inserts an artificial impedance term into its internal voltage-reference calculation. This lowers the commanded output voltage in proportion to current and limits fault current without switching the converter into a different control mode.
Do all grid-forming inverters use the same fault ride-through features?
No. Implementations vary in whether they use current saturation, virtual impedance, or a priority-based combination. They also vary in whether they regulate unbalanced fault current in the stationary or synchronous reference frame. These are architecture-level decisions, not settings a plant operator can change after the PCS is built.
Why does DC chopper sizing matter beyond a single fault event?
A brake chopper resistor sized for a single worst-case fault can still overheat if the plant experiences repeated faults in a short period. Repeated faults are common on weaker feeders. Duty-cycle rating, not just peak wattage, determines whether the chopper survives real-world fault patterns.
Further Reading
LVRT and HVRT: Voltage Ride-Through for BESS and Solar
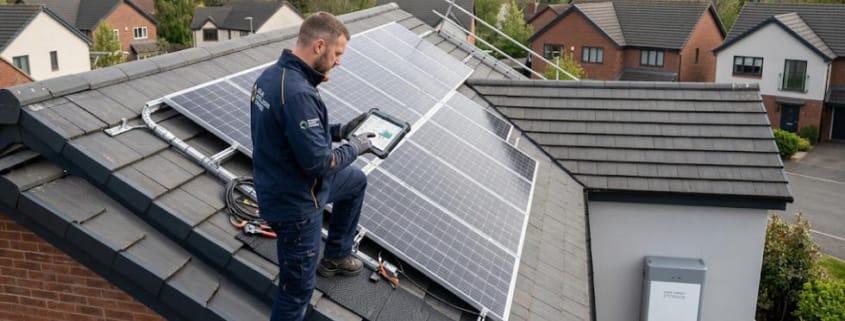
MCS Certification Explained: The Complete Guide to the UK’s Microgeneration Certification Scheme
MCS certification is the UK’s benchmark for quality in small-scale renewable energy. Since 2007, it has set the standards for solar panels, battery storage, and heat pumps. A product or installer must meet those standards to earn the MCS mark. For homeowners, that mark is often the difference between a government grant and no grant at all.
| Quick Answer MCS certification is the UK’s quality mark for small-scale renewable energy. It covers solar PV, battery storage, heat pumps, solar thermal, biomass, and wind. MCS certifies both the products and the installers who fit them. Most UK government incentives, including the Smart Export Guarantee and Boiler Upgrade Scheme, require it. |
What Is MCS Certification?
MCS stands for Microgeneration Certification Scheme. It is a UKAS-accredited quality scheme. It covers small-scale, low-carbon energy technologies in UK homes and small businesses.
The scheme works on two levels at once. First, it certifies products, while also certifying the businesses that install them. A solar panel, battery, or heat pump must pass independent testing first. Only then can it carry the MCS mark. Second, it certifies installers. The business that fits the system must also meet set technical and consumer-protection standards.
Both halves matter together. A certified product fitted by an uncertified installer will not earn an MCS certificate. Nor will a certified installer using an uncertified product.
The scheme is owned by the MCS Charitable Foundation, a registered charity. It is run day to day by The MCS Service Company Ltd. Independent certification bodies carry out the actual assessments. These bodies hold UKAS accreditation to ISO 17065.
A Brief History of the Scheme
MCS launched in 2007, backed by the UK government. At the time, the microgeneration market was growing fast but had little oversight. The scheme brought a common set of rules to that market.
Early adoption came from the Feed-in Tariff and Renewable Heat Incentive. Both required MCS-certified equipment and installers to qualify for payments.
Although those two schemes have since closed, the certification framework has grown alongside the newer incentives that replaced them. Battery storage joined the scheme in 2020, with its own dedicated installation standard. That change reflects how central storage has become to UK home energy.
Through 2026 and into 2027, MCS is rolling out its biggest change since launch. This is a redeveloped installer scheme, covered later in this guide.
What Technologies Does MCS Certification Cover?
MCS certification spans seven core technology groups. Together, they cover most of the low-carbon systems a UK household is likely to install.
- Solar PV — rooftop and ground-mounted panels that generate power
- Battery storage — electrical energy storage systems (EESS) that store solar or grid power for later use
- Air and ground source heat pumps — low-carbon heating and hot water
- Solar thermal — panels that heat water directly from sunlight
- Biomass — wood-fuelled boilers and stoves
- Wind turbines — small-scale wind power for homes and small firms
- Micro-hydro — small water-driven electricity generation
How MCS Certification Works
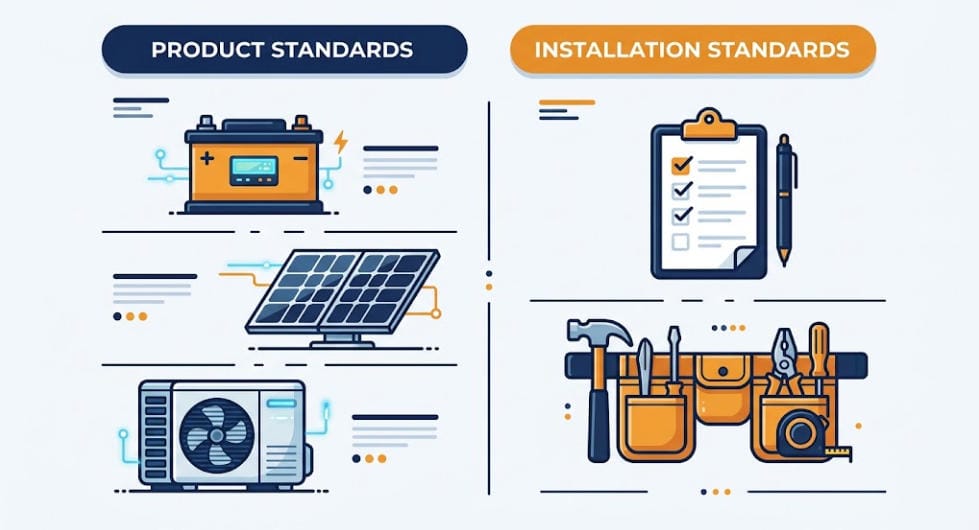
Every technology under the scheme follows two linked sets of rules. One is a product standard. The other is an installation standard. Together, they explain why both the equipment and the company fitting it need to carry the mark.
Product Standards
Product standards set out performance and safety tests for a given technology. MCS 005, for example, covers solar PV modules. On top of that, every manufacturer must also meet MCS 010, a shared factory quality-control standard that applies across all product types. Consequently, a manufacturer submits its product for independent testing first. Only then does it appear on the MCS certified products list.
Installation Standards
Installation standards are published as MCS Installation Standards (MIS) documents. They define how an installer must design, size, and commission a system on site. They cover everything from electrical safety to customer handover paperwork.
An installer’s work is checked in several ways. Certification bodies run technical checks, sample audits, and site visits. Most of this happens on a rolling annual cycle.
MCS Certification for Battery Storage
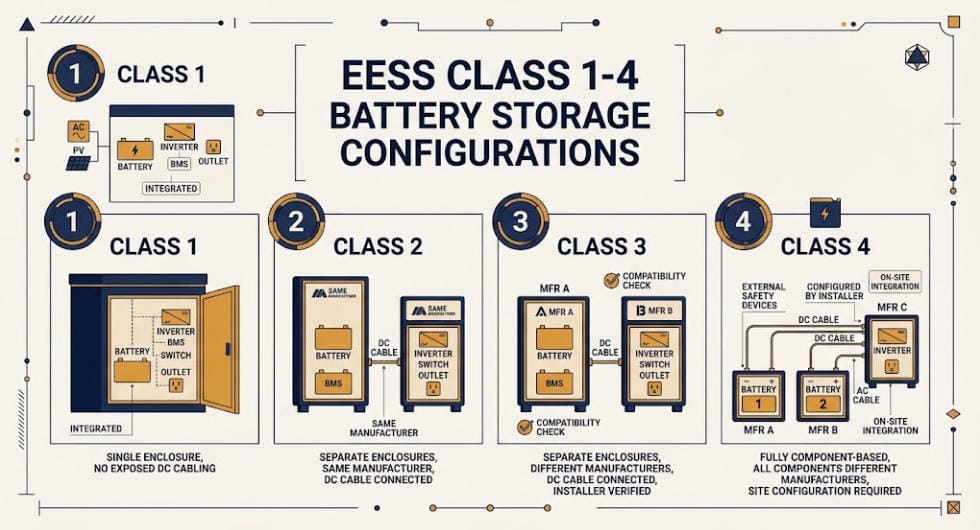
Battery storage sits inside the same certification framework as solar and heat pumps. It has its own installation standard, though: MIS 3012. First piloted in 2020, and updated since, it covers residential and small commercial systems up to 50kW.
MIS 3012 sorts battery installations into four classes. MCS calls these Electrical Energy Storage System (EESS) classes. The class depends on how the battery, inverter, and safety devices are packaged. It also depends on how many manufacturers supplied them. This classification decides which compatibility checks an installer must run before commissioning.
For a broader look at how storage certification standards work outside the UK residential market, see our guide to BESS certifications.
MIS 3012 also adds UK-specific requirements on top of general battery safety practice. These cover DC isolation, fire and ventilation guidance, and mandatory customer documentation at handover.
Why MCS Certification Matters for Homeowners and Installers
MCS certification is not a legal requirement. You can install a solar panel, battery, or heat pump without it. In practice, though, it is very hard to access UK government incentives without the certificate.
Smart Export Guarantee
The Smart Export Guarantee pays households for electricity they export to the grid. To qualify, an MCS certified installer must install the system. The products used must also be MCS certified. A smart meter that records exports is required too.
Boiler Upgrade Scheme
The Boiler Upgrade Scheme is run by Ofgem on behalf of DESNZ. It offers grants of up to £7,500 towards an air or ground source heat pump. Biomass boilers can get up to £5,000. Both the installer and the heat pump must carry MCS certification for the grant to pay out.
Other Incentives and Protections
The certificate also underpins eligibility for ECO4 and the Home Energy Scotland Grant and Loan, sitting alongside 0% VAT benefits on qualifying installations. Beyond the money, certified installers owe customers real protections. These include a written quote, a minimum workmanship warranty, and free access to dispute resolution if something goes wrong.
The Redeveloped MCS Installer Scheme
MCS is in the middle of its biggest overhaul since launch. Consultation began in 2022 and 2023. The redeveloped installer scheme then started rolling out to installers in early 2026. MCS has set a target completion date of 31 March 2027.
The new scheme shifts focus. It moves away from paperwork-heavy quality management systems. Instead, it looks at the quality of the finished installation on site. Three named business roles now sit at the centre of every certified installer. A Licensee holds ultimate responsibility for meeting scheme requirements. The Main Contact handles day-to-day contact with MCS and the certification body. A Technical Supervisor then signs off that each job meets the relevant installation standard.
Track record now shapes how often an installer gets checked. Installers with a strong, consistent record face fewer site assessments. Those with more issues get checked more often. Every installer must also buy an MCS-approved financial protection product for each customer. This gives homeowners a safety net if an installer cannot fix a problem itself.
How to Check MCS Certification
Checking a company’s MCS certification takes under a minute, and it is free. Search the public installer database on the MCS website. Or look up a specific job on the MCS Installations Database, at certificate.microgenerationcertification.org.
Before signing a contract, confirm three things. First, check the installer’s certification is current. Second, check the exact product model sits on the MCS certified products list. Third, check the installer’s certification covers the technology you are buying. An installer certified for solar PV is not automatically certified for battery storage. Each technology sits under its own installation standard.
Key Takeaways
- MCS certification is the UK’s main quality mark for solar PV, battery storage, heat pumps, solar thermal, biomass, and wind.
- It certifies products and installers separately. A valid MCS certificate needs both.
- It is not a legal requirement, but it is required for the Smart Export Guarantee, Boiler Upgrade Scheme, and ECO4..
- Battery storage has its own installation standard, MIS 3012, covering systems up to 50kW.
- A redeveloped installer scheme is rolling out through 2026 and 2027, with new business roles and mandatory financial protection.
Frequently Asked Questions
Is MCS certification a legal requirement?
No. You can install a solar panel, battery, or heat pump without it. You will not, though, qualify for the Smart Export Guarantee, the Boiler Upgrade Scheme, or related regional grants.
How long does certification last?
It is ongoing, not a one-off event. Certification bodies run regular audits, usually once a year. An installer can lose certification for failing to meet the standard.
Does MCS cover standalone battery storage?
Yes. MIS 3012 covers battery storage added to an existing solar system. It also covers battery-only installations with no solar panels at all.
What happens with a non-MCS installer?
The work may still be safe and good. It will not, though, generate an MCS certificate. Without that certificate, the property cannot access MCS-linked grants or export payments, even later.
Learn More From MCS
For the full list of current standards, certified installers, and certified products, see the official MCS website, which maintains the live installer and product databases referenced throughout this guide.
Further Reading
String vs. Centralized BESS: PCS Topology Compared
Every BESS project faces the same early choice: string vs centralized BESS design for the PCS. This one choice sets fault behavior, efficiency, and long-term cost.
Both designs store energy in the same LFP racks. So what changes? Just how the PCS wires up. Still, that single choice shapes the whole project.
| Quick Answer In a string vs centralized BESS comparison, string BESS gives each battery cluster its own PCS. A fault stays isolated. Each cluster also runs closer to peak efficiency.Centralized BESS uses one large PCS for the whole array. It costs less per kW. But it risks taking the entire block offline if that one unit fails.Utility-scale, cost-driven projects often pick centralized PCS. C&I and uptime-critical sites often pick string PCS instead. |
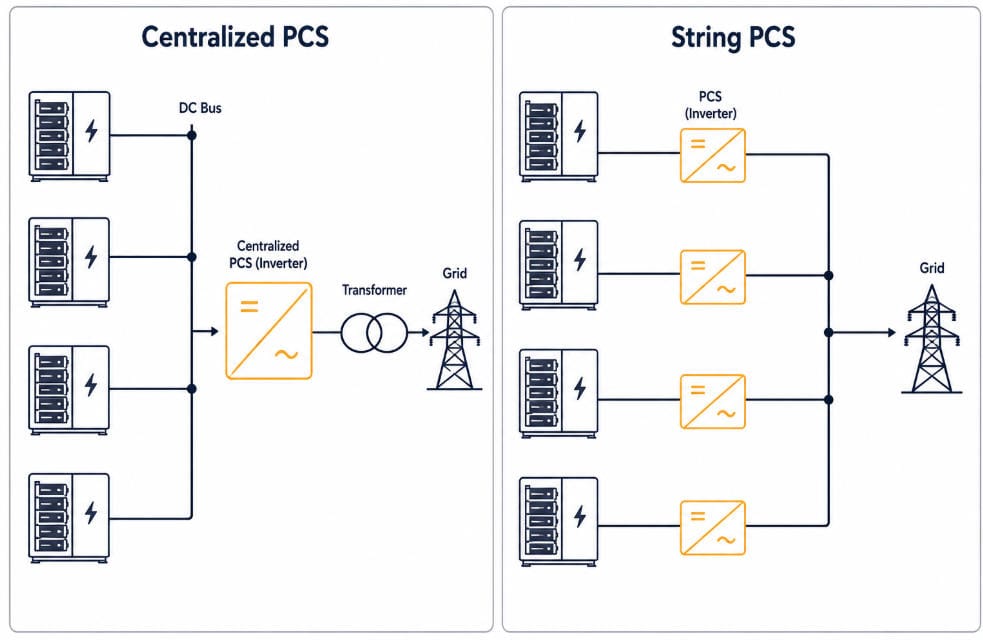
What Is PCS Topology in a BESS?
The PCS is the bidirectional inverter in a BESS. It turns battery DC power into grid AC power. Then it also flips AC back to DC during charging.
PCS topology just means two things. First, how many PCS units a project uses. Second, how each one wires into the battery racks. Two topologies lead the market: centralized and string.
A modular hybrid approach also exists. It borrows a bit from both sides of the string vs centralized BESS divide.
What Is Centralized BESS?
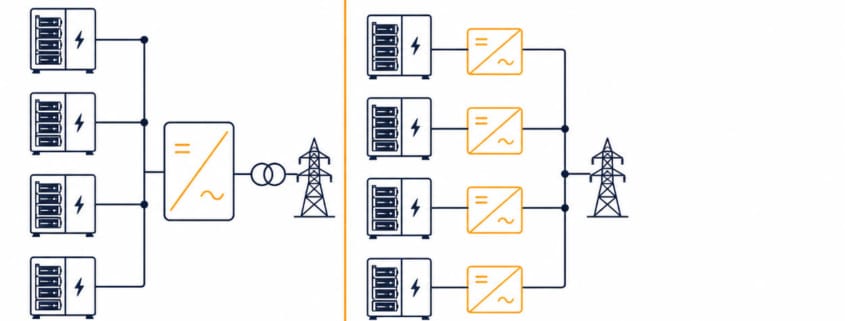
Centralized BESS is a battery storage design that routes every battery cluster through one large, shared PCS. So one or a few big inverters handle the whole array’s power conversion.
Think of it as a single hub. All the DC power flows to one point before it turns into grid-ready AC power. That hub is efficient to build, but it is also a single point of failure.
What Is String BESS?
String BESS is a battery storage design that gives each battery cluster its own dedicated PCS. So there is no shared hub. Every cluster converts its own power independently.
Picture a set of parallel lanes instead of one funnel. Each lane runs on its own, so one blocked lane never stops traffic in the others. That is the core idea behind a string vs centralized BESS layout.
How Centralized PCS Architecture Works
A centralized design uses one or a few large inverters for the whole array. Every cluster feeds a shared DC bus. Then that bus feeds a single converter.
Picture a typical utility-scale block. It might pair four 2.5 MW inverters with a 10 MW, 40 MWh array. Each inverter connects to one medium-voltage transformer.
Modern central PCS units handle 1 MW to 10 MW per inverter. Peak conversion efficiency is high — commonly in the high-90s percent range. But weighted-average efficiency at real-world load is what actually matters for revenue, and it always runs lower than the peak number.
Centralized PCS Advantages
- Lower cost per kW once a project reaches utility scale
- Fewer transformers, combiner boxes, and cable runs
- Simpler control setup, since fewer units need coordination
Centralized PCS Trade-offs
- A single fault can take the whole battery block offline until repair
- Efficiency drops at partial load, and most systems run below full output most of the time
- A larger footprint per unit complicates transport and crane access
How String PCS Architecture Works
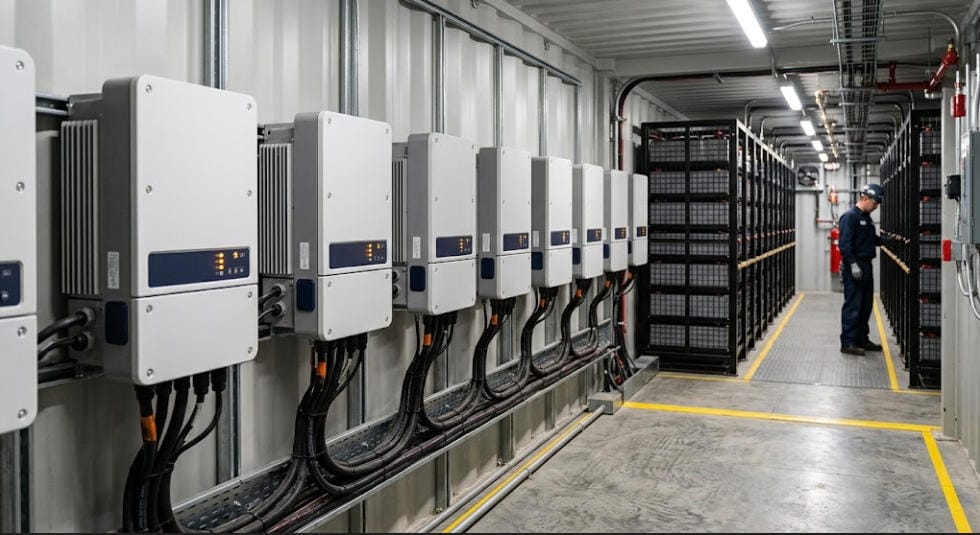
String architecture gives each battery cluster its own dedicated PCS. Each cluster’s DC output goes straight to its own converter. So it never touches a shared bus.
Compact C&I string units run far smaller than their utility-scale counterparts. Utility-scale string units run larger — and they keep growing.
In 2025, a 400 kW+ string PCS module reached the utility-scale market, built for large containerized deployments, according to ESS News. That single data point shows how far string PCS has moved past its old C&I-only reputation.
Since each string works on its own, one unit can shut down for maintenance. Meanwhile, the rest of the array keeps running without a hiccup.
String PCS Advantages
- Fault isolation — a failed unit only affects its own cluster
- Better partial-load performance across clusters with uneven aging or temperature
- Easier phased expansion, since a project can add capacity string by string
String PCS Trade-offs
- More total units to install, wire, and monitor
- Slightly higher balance-of-plant cost in most designs
- More interconnection points, which adds commissioning time
Centralized BESS: Features and Functions
In the string vs centralized BESS split, a centralized PCS handles the same core job as any inverter.
See our BESS PCS Functions and Features guide for the full list. But a centralized design delivers those functions from one shared unit, not many.
- DC-to-AC and AC-to-DC conversion for the entire array, from a single converter
- One grid-forming or grid-following control loop governs the whole block
- Protection functions — over-voltage, over-current, short-circuit — apply at one point, covering every cluster behind it
- Reactive power and power factor control dispatched from a single, larger unit
- One data and monitoring point, which simplifies SCADA integration
This concentration is exactly what makes centralized PCS cost-efficient. It is also exactly what makes a single fault so costly.
String BESS: Features and Functions
On the string side of the string vs centralized BESS split, the PCS performs the same core functions.
See our BESS PCS Functions and Features guide for the full list. The difference is that every cluster gets its own copy of them.
- DC-to-AC and AC-to-DC conversion happens per cluster, not once for the whole array
- Each unit runs its own grid-forming or grid-following control loop, independent of the others
- Protection functions trip at the cluster level, so a fault never reaches healthy strings
- Reactive power dispatch is finer-grained — each string can be commanded separately
- Monitoring is far more granular, since every cluster reports its own data
That granularity is the trade for a higher unit count. More data, more control points, and more independence — at the cost of more hardware to manage.
How Functions Differ Between String and Centralized BESS
Both topologies run the same core PCS functions. The string vs centralized BESS split is about where those functions live, and how finely they’re applied.
| Function | Centralized PCS | String PCS |
|---|---|---|
| Control loop | One loop for the whole array | One independent loop per cluster |
| Protection scope | Trips can affect the whole block | Trips stay isolated to one cluster |
| Reactive power dispatch | Coarse — set at the array level | Fine — set per cluster |
| Monitoring granularity | Array-level data | Cluster-level data |
| SCADA complexity | Simpler — fewer points to poll | More complex — more points to poll |
String vs Centralized BESS: Key Differences
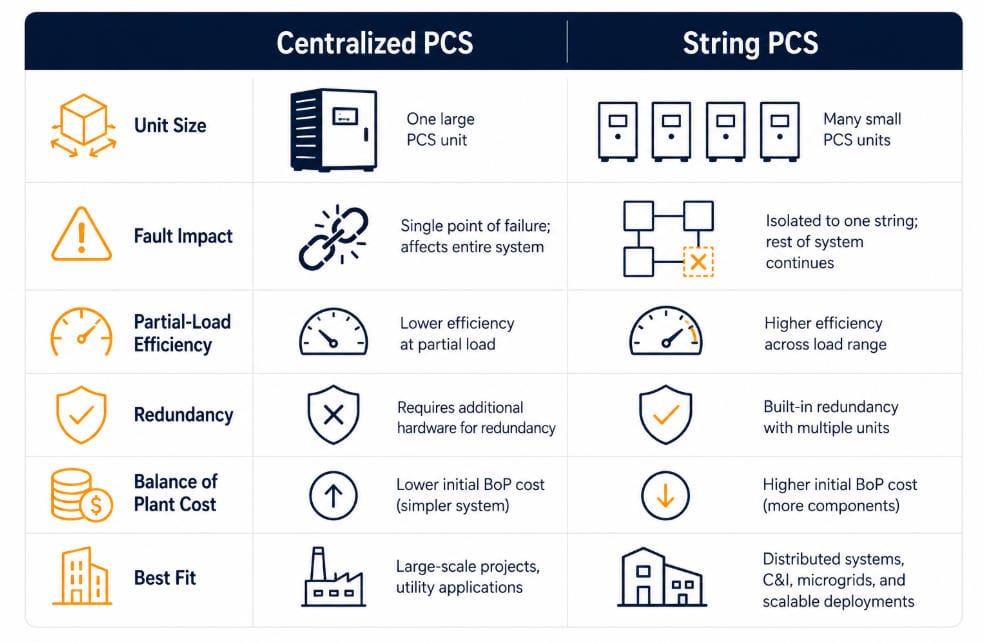
The table below lines up the string vs centralized BESS choice against the factors that matter most for planning.
| Factor | Centralized PCS | String PCS |
|---|---|---|
| Typical unit size | 1–10 MW per inverter | Well under 1 MW per unit |
| Fault impact | Can affect the entire block | Isolated to one cluster |
| Partial-load efficiency | Lower at reduced output | Higher across varying loads |
| Redundancy | Needs spare or N+1 units | Built in through unit count |
| Balance-of-plant cost | Lower per kW at scale | Higher per kW, more units |
| Best fit | Large, uniform utility-scale sites | C&I and uptime-critical sites |
Redundancy and Fault Isolation in String vs Centralized BESS
In a centralized design, one PCS fault removes the whole block from service. Then the other clusters sit idle, since they all share the same converter.
A string design isolates that same fault to one cluster. So the rest of the array keeps charging or discharging without a break.
This isn’t just a vendor talking point. Sandia National Laboratories’ Energy Storage Handbook, Chapter 13 describes the same trade-off in modular, multi-converter PCS designs. If one converter or storage unit must be taken offline, the rest of the system keeps operating. It runs at reduced capacity, but it doesn’t stop entirely.
This gap matters most for revenue-critical work. Once a system goes offline, frequency-response contracts, backup deals, and peak-shaving windows all carry a real cost.
Efficiency and Partial-Load Performance
Peak efficiency between the two topologies is often close. Neither has a dramatic edge at full output.
But the real gap shows up at partial load. Most BESS assets spend most of their life below full output, not at it.
String units track their own cluster’s charge and temperature. So each one runs nearer its own peak efficiency point.
Distributed control also helps on sites with uneven cluster aging. A 2025 study on two-string BESS balancing, published on arXiv, tested independent, balanced control of separate battery strings. Versus a coupled baseline, it improved inverter efficiency by about 1.5 percentage points and derating efficiency by about 2 points.
Cost and O&M Considerations
Centralized PCS lowers upfront cost per kW. Fewer, larger units mean fewer transformers, less cabling, and fewer combiner and interconnection points — all balance-of-plant items that add up fast in a string design.
String PCS raises the unit count. Then that adds wiring, monitoring points, and commissioning time.
Still, field maintenance is often simpler per event. A technician can swap one unit without derating the rest of the array.
Yet neither cost profile holds everywhere. Site labor rates, transformer lead times, and financing terms all shift the real-world number in a string vs centralized BESS budget.
Which Architecture Fits Your String vs Centralized BESS Decision?
The right choice depends on scale and uptime needs, not on price alone. First, weigh how much a fault would actually cost you.
| Project Type | Typical Choice | Why |
|---|---|---|
| Utility-scale, uniform site | Centralized | Lower cost per kW; simpler design outweighs the redundancy gap |
| C&I or frequency-response asset | String | Fault isolation and better partial-load performance protect revenue |
| Mixed shading or phased buildout | String | Independent cluster control captures a documented efficiency gain |
| Cost-constrained, fault-tolerant site | Centralized + N+1 spare | Keeps the low-cost benefit while covering the single-point-of-failure risk |
Best PCS Choice by Project Type
The table above covers the general split. But real projects fall into more specific categories. Here’s how the string vs centralized BESS call plays out in practice.
- Utility-scale solar-plus-storage (50+ MWh): Go centralized. Site conditions are usually uniform. So the cost savings outweigh the fault-isolation gap. Add N+1 spares if the offtake contract penalizes downtime.
- C&I behind-the-meter (500 kWh–5 MWh): Go string. These sites often run at partial load most of the day. So a single fault taking out the whole system is a bigger business risk at this scale.
- Frequency response and ancillary services: Go string. Revenue depends on being online and dispatchable. Losing the whole asset to one fault can mean a contract penalty, not just lost output.
- Microgrids and islanded sites: Go string. Grid-forming duties often split across multiple units for redundancy. So an islanded site can keep forming voltage even if one string trips.
- Data center backup power: Go string, or a hybrid layout. Uptime requirements are strict. Cluster-level fault isolation matches the redundancy philosophy data centers already use elsewhere.
- Phased or multi-year buildouts: Go string. Capacity can be added string by string as budget grows. That avoids resizing a large central inverter up front.
- Cost-constrained utility projects with firm redundancy needs: Go centralized, but budget for N+1 spare units. This keeps the lower cost-per-kW while covering the single-point-of-failure risk.
String vs Centralized BESS: Key Takeaways
| Key Takeaway |
| 1. Centralized PCS uses fewer, larger inverters and costs less per kW at utility scale. |
| 2. String PCS gives each cluster its own inverter, isolating faults and improving partial-load efficiency. |
| 3. Peak efficiency is similar between the two — the real gap shows up at partial load and during faults. |
| 4. String designs suit C&I, uptime-critical, and uneven sites; centralized designs suit large, uniform utility-scale projects. |
| 5. An N+1 centralized design can add redundancy without a full switch to string architecture. |
Frequently Asked Questions About String vs Centralized BESS
What is the main difference in a string vs centralized BESS comparison?
Centralized BESS routes every battery cluster through one large PCS. String BESS gives each cluster its own smaller PCS instead. So faults and performance stay isolated per cluster.
Is string PCS more efficient than centralized PCS?
At full load, the two are close. But at partial load, where most systems run most of the time, string PCS usually wins. Since each unit tracks its own cluster’s condition.
Which topology costs less?
Centralized PCS usually costs less per kW upfront. This comes mainly from fewer transformers and simpler cabling. Still, string PCS can offset that gap over time through easier fault isolation.
Can a BESS use both string and centralized PCS?
Yes. Some projects use a modular hybrid layout instead. This groups several clusters per mid-sized PCS. It splits the difference between cost and fault isolation.
Does PCS topology affect fire and safety compliance?
Topology does not change NFPA 855 compliance directly. But faster fault isolation in a string design can support the hazard mitigation analysis a project needs for permitting.
Summing up the string vs centralized BESS choice
Once you know your uptime needs, the string vs centralized BESS decision gets simpler. Start with fault cost, then let scale and budget settle the rest.
Further Reading
For a broader look at how the PCS fits alongside the BMS and EMS, see BESS PCS Functions and Features.
For the full range of PCS specifications, including efficiency and grid-forming vs. grid-following control, see Understanding BESS Specifications.
For fire and life-safety requirements that intersect with PCS layout, see the NFPA 855 Guide.
For how project scale shapes the rest of the electrical design, see C&I vs. Utility-Scale Solar and BESS.
For how millisecond-scale power demand affects PCS sizing, the AI Data Center Energy Storage
Why Deep Discharge and High C-Rate Stress LFP Cells: Particle Cracking and Concentration Polarization
Every LFP datasheet gives a depth of discharge number and a C-rate limit, the two levers behind DoD C-rate stress. Still, fewer explain what actually happens inside the cell when you push past them. DoD C-rate stress is the physical reality behind those two numbers. It is not an arbitrary warranty term. Instead, it is real mechanical and electrochemical strain on the electrode itself.
So this guide skips the buyer’s-guide framing. It explains the mechanism instead. First, it covers what happens to an electrode particle during a single lithium insertion and extraction cycle. Then it covers why deep discharge makes that worse. Then it covers why high C-rate makes it worse again, through a different pathway. Finally, it covers what happens when both combine at once.
| Quick Answer DoD C-rate stress is the mechanical and electrochemical strain that deep cycling and fast charging place on an LFP cell’s electrode particles. Deep discharge causes larger volume changes inside each particle, leading to particle cracking over time. High C-rate creates steep lithium concentration gradients. This adds mechanical stress. It also raises the risk of local lithium plating, even when the average current looks safe. |
DoD C-Rate Stress: What Happens Inside a Particle
Every time an LFP cell charges or discharges, lithium ions move in and out of the electrode particles. But that movement is not free. It changes the particle’s volume every time.
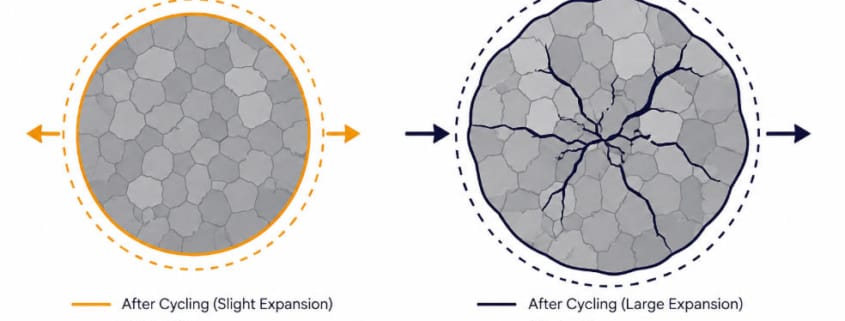
LFP and its delithiated counterpart, FePO4, differ in volume by about 6.8%. So every full cycle pushes a particle through that volume change and back. This is not a smooth, uniform process either. Lithium moves through the particle unevenly, especially at speed, creating internal concentration gradients between lithium-rich and lithium-poor regions. So those gradients generate real mechanical stress inside the particle.
Researchers have a specific name for the resulting damage in LFP cells: electrochemical milling. This is the process where LFP particles crack and crumble. Repeated volume change causes the mechanical stress behind it. First, early in a cell’s life, this cracking is not entirely bad. It exposes fresh surface area. It can even help ion transport briefly. But over time, continued milling causes particles to detach from the conductive carbon network entirely. So that detached material becomes electrically isolated. It stops contributing capacity for good.
DoD C-Rate Stress: Why Deep Discharge Makes It Worse
Depth of discharge is not just a capacity number. Instead, it is a direct measure of how far each particle gets pushed through its volume-change cycle, every single time.
Take a shallow cycle, say 20% to 80% state of charge. It keeps particles moving through a smaller slice of that range. A deep cycle from close to 0% up to 100% is different. It pushes particles through nearly the entire range, every time. So recent research using direct imaging of individual LFP particles confirms this link concretely. Operando imaging studies show something specific. Lithium concentration distribution and the resulting internal stress fields are directly tied to how far a particle gets cycled. So deeper excursions create larger, more damaging stress fields.
So this is exactly why partial state-of-charge cycling extends cycle life so reliably. It is not a soft recommendation. Instead, it reflects less particle-level strain, cycle after cycle. So shallow cycling protects the electrode structure directly. It works at the mechanical level, not just at the voltage level.
Why High C-Rate Makes This Worse Again
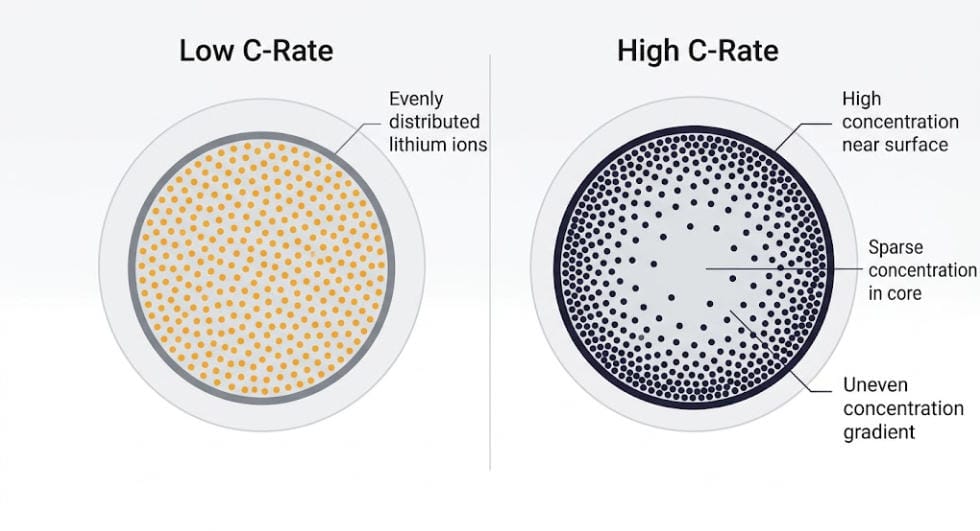
C-rate adds a second stress pathway on top of depth of discharge. It works through a different mechanism.
At low C-rates, lithium has time to distribute fairly evenly through a particle as it moves in or out. But at high C-rates, it does not. Instead, ions pile up near the particle surface faster than they can diffuse toward the center. This creates a steep internal concentration gradient, even if the overall depth of discharge stays the same. So that steep gradient adds mechanical stress independent of how deep the cycle actually goes. Research modeling particle-level behavior confirms this directly. Cracking occurs more severely at higher currents. It worsens further with larger particle sizes.
So high C-rate creates a second, separate risk beyond mechanical stress. At the electrode surface, fast charging causes concentration polarization. That is a buildup of lithium ions that outpaces how quickly the surrounding electrolyte and electrode structure can absorb them. This local buildup can push the anode’s surface potential down toward the plating threshold. That can happen even when the average current across the whole cell looks perfectly safe on paper. For the full mechanism behind that plating threshold, see our guide on SEI Layer Growth and Lithium Plating in LFP Cells.
DoD C-Rate Stress: When Both Combine
DoD C-rate stress is worst when both factors stack together, and that combination is common in real BESS operation, not just a lab edge case.
A cell cycled deep and fast gets hit twice. It experiences the largest volume-change stress from depth of discharge. At the same time, it faces the steepest concentration gradients from high current. But these two stress sources do not simply add. The uneven lithium distribution from fast charging concentrates strain in specific regions of the particle. Those same regions then get pushed through the largest volume swings from the deep discharge on top. So that combination accelerates electrochemical milling faster than either factor alone would predict.
This is one reason cycle life ratings drop sharply when both depth of discharge and C-rate increase together. The drop is not simply additive. A cell rated for thousands of cycles at shallow depth and moderate current can lose a large fraction of that rating. This happens when it gets pushed to both extremes at once.
How This Connects to the Bigger Degradation Picture
DoD C-rate stress is one of the concrete mechanisms behind cycle aging specifically, as distinct from the calendar aging that happens purely with time.
The mechanical stress covered here scales with cycle count and depth. It does not scale with elapsed time at rest. So that is exactly the signature of cycle aging. For the full breakdown of how cycle aging and calendar aging interact, and how operators separate the two using the Equivalent Full Cycle method, see our guide on Calendar Aging vs Cycle Aging in LFP Batteries. The particle cracking mechanism explained here is a major reason why that range exists. Cycling conditions like depth of discharge and C-rate explain a wide spread in EFC-based end-of-life ratings.
Particle cracking also creates fresh surface area. That fresh surface needs new SEI to cover it. So DoD C-rate stress connects directly to SEI growth too. Every cracking event is not an isolated capacity loss. Instead, it triggers a small amount of additional SEI-driven capacity loss on top.
Why This Matters More for Some BESS Applications Than Others
DoD C-rate stress does not hit every BESS application equally. Usage pattern determines how much this mechanism matters for a given system.
Take a solar-paired storage system that charges and discharges once a day at a moderate rate. It sits at the low-stress end of this spectrum. It rarely pushes into deep discharge territory, and its C-rate stays modest across a typical cycle. A frequency-regulation asset looks very different. It cycles constantly, often at higher C-rates, though usually across a shallower depth of discharge window. So the DoD C-rate stress mix differs by application, even before considering total cycle count.
The worst-case combination shows up in applications that need both deep discharge and high C-rate at once. Backup power systems sized tightly against peak demand are a good example. Those systems have less room to avoid the combined stress case covered above. Both extremes may be operationally necessary rather than optional. Understanding this mechanism helps explain something useful. Identical nameplate systems in different applications can show meaningfully different real-world cycle life, even under the same warranty terms.
What This Means in Practice
None of this changes the practical guidance much. Still, it explains why that guidance exists.
Keeping cycles shallow, inside a window like 20% to 80%, is not an arbitrary rule. Instead, it directly limits how far electrode particles travel through their volume-change cycle. Keeping C-rate moderate limits how steep the internal concentration gradients get, on top of that. For the buyer-facing numbers behind these two levers, see our guides on BESS C-Rate Explained and 20/80 Rule for Batteries. Both include specific cycle-life figures at different depth of discharge and C-rate combinations. Both cover the practical operating windows this guide explains the mechanism behind.
DoD C-Rate Stress: Quick Reference
| Factor | What Happens at the Particle Level |
| Deep discharge | Larger volume-change swing per cycle, more particle cracking over time |
| High C-rate | Steep lithium concentration gradients, added mechanical stress |
| High C-rate (secondary effect) | Local concentration polarization can push toward plating risk |
| Combined deep + fast cycling | Stress sources compound rather than simply add |
| Resulting damage | Electrochemical milling, particle detachment, exposed surface for new SEI growth |
| Practical lever | Shallow SOC window and moderate C-rate both reduce particle-level strain directly |
Frequently Asked Questions
In DoD C-rate stress, is particle cracking the same thing as SEI growth?
No, but the two are connected. Particle cracking is a mechanical process driven by volume change and internal stress. It exposes fresh surface area, which then triggers new SEI growth on that surface. One mechanical event causes a follow-on chemical one.
Under DoD C-rate stress, does shallow cycling eliminate particle cracking entirely?
No. Some degree of volume change and internal stress happens on every cycle, even a shallow one. Shallow cycling reduces the stress substantially rather than eliminating it.
Why does high C-rate matter even if depth of discharge stays the same?
C-rate affects how evenly lithium distributes inside a particle during a given cycle. This holds independent of how deep that cycle goes. Faster currents create steeper internal concentration gradients, adding stress on top of whatever depth of discharge is in use.
Can this mechanism cause sudden capacity loss, or is it always gradual?
It is usually gradual, showing up as steady capacity fade. But accumulated particle cracking and detachment can contribute to an accelerated fade phase later in a cell’s life. This is sometimes described as a knee point in the capacity curve.
Further Reading
Battery Degradation in BESS: Causes, Mechanisms & Mitigation
SEI Layer Growth and Lithium Plating in LFP Cells