
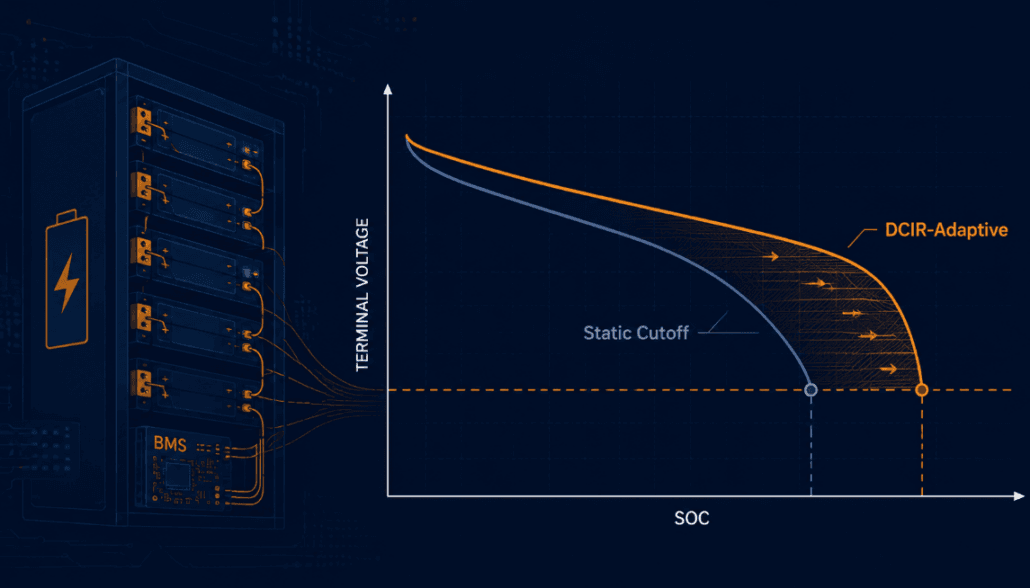
Dynamic, DCIR-Adaptive Voltage Cutoff Design for LFP BESS
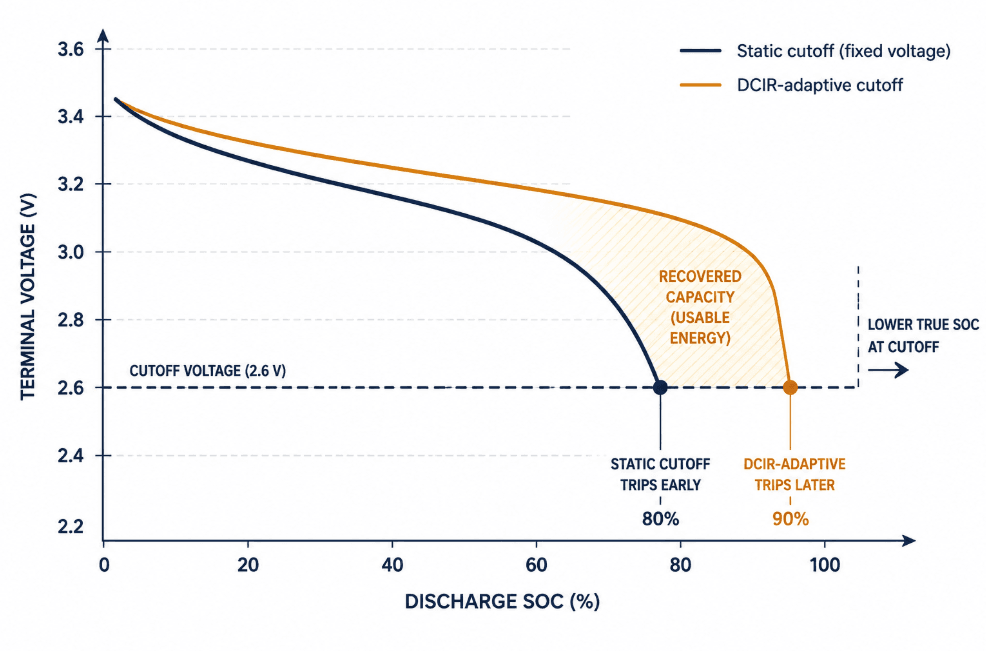
A static low-voltage cutoff pulls one fixed value from a cell datasheet. That single number is one of the most common reasons a BESS underdelivers its rated usable capacity. As direct current internal resistance (DCIR) rises with cell age, it also rises as temperature drops. The voltage sag under load grows along with it. A fixed cutoff trips earlier and earlier in the discharge curve, even though the cell still has real, recoverable capacity left. This article walks through how to design a DCIR-adaptive cutoff instead. It covers the test data it requires, the lookup-table structure a BMS actually implements, and the throughput recovered as a result.
| ⚡ Quick Answer A DCIR-adaptive cutoff replaces one fixed trip voltage with a value calculated in real time. It pulls current and a resistance value from an HPPC-derived lookup table, indexed by SOC, temperature, and cell age. This raises the effective cutoff trigger to match present-moment resistance, instead of a fresh-cell assumption — recovering up to 10% of effective throughput in mid-to-late project life that a static cutoff would otherwise strand. |
Why a Fixed Cutoff Voltage Is the Wrong Design Choice
A discharge cutoff exists to stop the pack before any cell drops below its safe minimum voltage — commonly 2.5V per cell for LFP. The problem is where that voltage gets measured. Terminal voltage under load equals open-circuit voltage minus the resistive sag: V(terminal) = V(OCV) − I × DCIR. A fresh cell with 0.15 mΩ DCIR sags very little even at high current. The same cell after several thousand cycles sags far more. Its DCIR has risen to 0.3–0.5 mΩ, and it sags two to three times as much at identical current. So the BMS reaches the 2.5V trip point at a meaningfully higher residual state of charge, even though the cell’s actual OCV-based SOC has not changed.
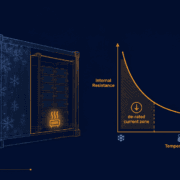
Temperature compounds this effect further. Internal resistance rises sharply as cell temperature falls. Ion mobility slows down in the cold, both in the electrolyte and at the electrode interface. A cutoff threshold validated only at 25°C on a fresh cell will trip early on both counts, in a cold, aged pack. Sometimes this strands 10–15% of nameplate capacity that the cell was never actually short of.
Building the DCIR-SOC-Temperature Map for a DCIR-Adaptive Cutoff
The data foundation for a DCIR-adaptive cutoff is Hybrid Pulse Power Characterization (HPPC) testing. This methodology was developed under the US Department of Energy’s USABC/PNGV programs. It is now standard practice across automotive and stationary storage cell qualification. HPPC applies paired discharge and charge current pulses at fixed SOC steps, typically every 10% of capacity. It runs this across a matrix of test temperatures, and measures the resulting voltage response to extract resistance at each point. This is the same underlying test data an EKF SOC estimation design uses to build its own equivalent circuit model. A project running one HPPC campaign can feed both efforts from a single test matrix.
- Discharge the cell to each target SOC step and allow it to rest until voltage stabilizes.
- Apply a short current pulse (commonly 10 seconds) at the rated or peak discharge current and record the instantaneous voltage drop.
- Calculate DCIR at that SOC and temperature as ΔV divided by the pulse current.
- Repeat across the full SOC range and across a temperature matrix spanning the system’s expected operating envelope, from cold-climate minimums to peak ambient.
- Repeat the full test periodically through a cycle-aging program to capture how the resistance surface shifts with cell age, not just with SOC and temperature.
The output is a three-dimensional resistance surface — DCIR as a function of SOC, temperature, and cycle count or SOH — rather than a single number. This surface is what the BMS firmware references at runtime instead of a fixed cutoff voltage.
From Resistance Surface to a DCIR-Adaptive Cutoff Lookup Table
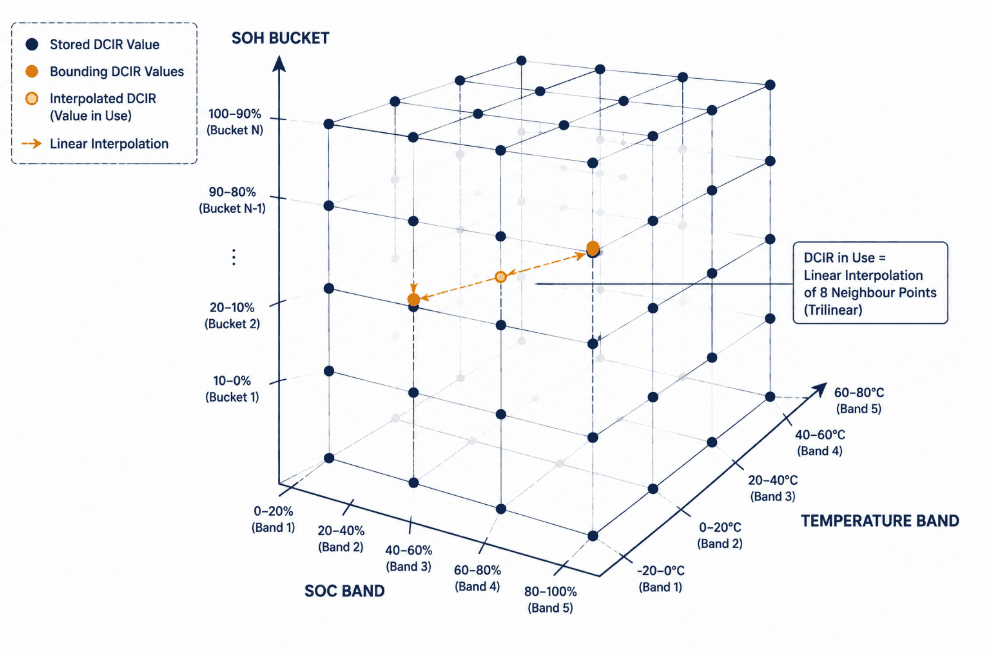
Translating HPPC data into a working DCIR-adaptive cutoff requires converting the continuous resistance surface into a discrete lookup table. This table has to be one the firmware can query in real time, without heavy onboard computation.
Structuring the Lookup Table
A practical implementation follows this structure:
- Index the table by SOC band (e.g., 10% steps), temperature band (e.g., 5°C steps), and a coarse SOH bucket (e.g., every 500–1,000 cycles or a measured capacity-fade threshold).
- Store a DCIR value at each grid point, interpolating linearly between points at runtime rather than storing every possible combination.
- Calculate the adjusted cutoff voltage in real time as V(cutoff, adjusted) = V(cutoff, minimum) + I(measured) × DCIR(SOC, T, SOH) — raising the effective cutoff trigger point to reflect present-moment resistance rather than a static assumption.
- Apply hysteresis around the cutoff transition to prevent the BMS from oscillating between discharge-enabled and discharge-disabled states as current and resistance fluctuate near the boundary.
- Re-anchor the SOH bucket periodically using either a full capacity test or a DCIR-trend proxy, since resistance growth is one of the standard leading indicators for SOH estimation without requiring a full discharge test.
Using resistance trend as an SOH proxy rather than running a full capacity test lines up with current battery-health research: a recent review of experimental health-assessment methods for lithium-ion cells names pulse-based resistance testing among the practical indicators for tracking degradation without the time and equipment cost of a full discharge cycle.
How Static and DCIR-Adaptive Cutoffs Compare
| Reference point | Single fixed voltage from cell datasheet | Real-time calculated voltage adjusted for measured current × DCIR |
| Temperature handling | Assumes room-temperature test conditions | Indexed by temperature band from HPPC matrix |
| Aging handling | Fixed for asset life | Indexed by SOH bucket; re-anchored periodically |
| Typical result at 1C, mid-to-late project life | 10–15% of nameplate capacity stranded | Recovers up to 10% of effective throughput |
| Data source | Cell datasheet single-point spec | HPPC test matrix across SOC × temperature × cycle count |
Where the Recovered Throughput Comes From
The revenue case for this design change is straightforward. DCIR-driven voltage sag can shrink the usable SOC window by roughly 10–15% in mid-to-late project life, at high C-rates. Our 0.5C vs 1C cycle life analysis puts a number on the recoverable share of that: a DCIR-adaptive cutoff recovers up to 10% of effective throughput in mid-to-late project life. It does this by letting discharge continue closer to the cell’s true low-SOC limit, rather than tripping on resistance alone. Over a multi-year asset life, this compounds. Every cycle that discharges 10% deeper than a static cutoff would have allowed is 10% more throughput on that cycle. Multiply that across thousands of cycles. For dispatch-contracted or market-facing assets, this also improves bid accuracy. The state-of-charge and state-of-power figures reported to the EMS more closely match what the pack can actually deliver under load.
Implementation Notes and Common Pitfalls
Don’t confuse SOC estimation with cutoff calibration
A DCIR-adaptive cutoff corrects for resistance-driven voltage sag; it does not replace the underlying SOC estimation algorithm. An accurate EKF-based SOC estimate can still trip early under load if the cutoff voltage itself is static. Both layers need attention. For the estimation side of this problem, including how a biased SOC output can itself shift where a DCIR-adaptive cutoff trips, see our EKF SOC estimation design guide. SOC estimation accuracy and cutoff voltage adaptivity solve different problems that happen to share the same root cause in LFP’s flat OCV curve.
Validate That the DCIR-Adaptive Cutoff Doesn’t Mask Genuine Cell Faults
A DCIR-adaptive cutoff must still tell apart two different things. One is normal, predictable resistance growth. The other is an abnormal resistance spike from a developing fault — a loose busbar connection, a failing weld, or accelerated local aging tied to in-service cell imbalance. Cross-check measured DCIR against the expected value from the lookup table, rather than blindly applying the adjustment. This lets the BMS flag anomalies instead of quietly adapting around them.
Size cooling and current limits around end-of-life DCIR, not fresh-cell DCIR
The same resistance surface that feeds the cutoff table should also inform thermal design margin and current-limiting logic. Heat generation scales with resistance and the square of current. Designing cooling capacity around fresh-cell impedance under-sizes the system for the DCIR it will actually see in year eight or ten. None of these three systems — cutoff logic, SOC estimation, and imbalance control — should run as fully isolated modules. Our integrated BMS control architecture guide covers how to share DCIR, current, and temperature state across all three.
Key Takeaways
A fixed low-voltage cutoff ignores the fact that DCIR rises with both cell age and cold temperature, which strands usable capacity that the pack technically still has. HPPC testing across a SOC × temperature × cycle-count matrix is the standard method for building the resistance data a DCIR-adaptive cutoff needs. The firmware implementation is a lookup table with linear interpolation, not a continuous real-time model — this keeps the calculation lightweight enough for BMS hardware. A DCIR-adaptive cutoff recovers up to 10% of effective throughput in mid-to-late project life, most of the capacity that would otherwise sit stranded behind a static, resistance-blind trip point. Cutoff adaptivity and SOC estimation accuracy are separate problems. Both trace back to LFP’s flat voltage curve. Fixing one does not fix the other.
Frequently Asked Questions
Is a DCIR-adaptive cutoff a firmware-only change, or does it require new hardware?
In most cases it is a firmware and calibration-data change rather than a hardware change, provided the BMS already measures cell voltage and pack current with sufficient resolution and sampling rate. The work is in generating the HPPC-derived lookup table and implementing the interpolation and hysteresis logic, not in adding sensors.
How often does the resistance lookup table need to be re-validated?
A practical cadence ties re-validation to SOH milestones rather than a fixed calendar interval — for example, every 500–1,000 cycles or whenever a capacity or DCIR trend crosses a defined threshold. Systems with continuous DCIR trending can trigger table updates automatically rather than requiring a manual test campaign.
Does a DCIR-adaptive cutoff increase the risk of over-discharging a cell?
No, when implemented correctly. The adjustment raises the effective cutoff trigger voltage to compensate for load-induced sag. It does not lower the cell’s true minimum safe voltage. That real, OCV-based SOC is still where the cell trips. The BMS is simply better at recognizing where that point is under load, instead of confusing resistive sag for depleted charge.
References
• HPPC Test Procedure — Hybrid Pulse Power Characterisation methodology originating from the USABC/PNGV development program.
• Experimental Methods, Health Indicators, and Diagnostic Strategies for Retired Lithium-ion Batteries: A Comprehensive Review, arXiv preprint.
• Systematic Characterization of Lithium-Ion Cells for Electric Mobility and Grid Storage, MDPI Batteries.
Further Reading
0.5C vs 1C Cycle Life for Liquid-Cooled BESS
EKF SOC Estimation Design for LFP BESS
Designing Against In-Service Cell Imbalance in LFP BESS
Integrated BMS Control Architecture






Trackbacks & Pingbacks
[…] Dynamic, DCIR-Adaptive Voltage Cutoff Design for LFP BESS […]
Leave a Reply
Want to join the discussion?Feel free to contribute!