
NFPA 855: The Complete Guide to Stationary Energy Storage System Fire Safety
NFPA 855, published by the National Fire Protection Association, is the U.S. standard for safe battery energy storage installation. If you’re developing, permitting, or financing a BESS project, compliance is not optional. In fact, your local fire marshal, your insurer, and your interconnecting utility will all check it first. This guide covers what the standard requires. It also covers what changed in the 2026 edition, and how the rules differ for C&I and utility-scale projects.
Quick Answer: What This Standard Covers
In short, this fire-safety standard sets the installation rules for battery storage in the United States. It covers spacing, ventilation, detection, suppression, and hazard analysis. That applies to everything from small residential batteries to utility-scale plants. Local fire codes enforce it. In addition, most insurers and interconnecting utilities require proof of compliance before they approve a project.
At a Glance
- What it is: a National Fire Protection Association standard for stationary battery energy storage systems, first published in 2020, now in its 2026 (third) edition.
- Who enforces it: local Authorities Having Jurisdiction (AHJs), typically through NFPA 1 (Fire Code) Chapter 52 or the International Fire Code Section 1207.
- Who it applies to: residential, commercial, industrial, and utility-scale BESS. Specifically, the scope is set by battery chemistry and stored energy, not by project type alone.
- What triggers it: aggregate stored energy above chemistry-specific thresholds. For example, that’s 20 kWh for lithium-ion.
- What’s new in 2026: a default requirement for Hazard Mitigation Analysis, large-scale fire testing, and stricter explosion control provisions.
What Does NFPA 855 Cover?
The standard addresses the full lifecycle of a battery energy storage system. That covers design, installation, commissioning, operation, maintenance, and decommissioning. In practice, most project teams also focus on five specific areas:
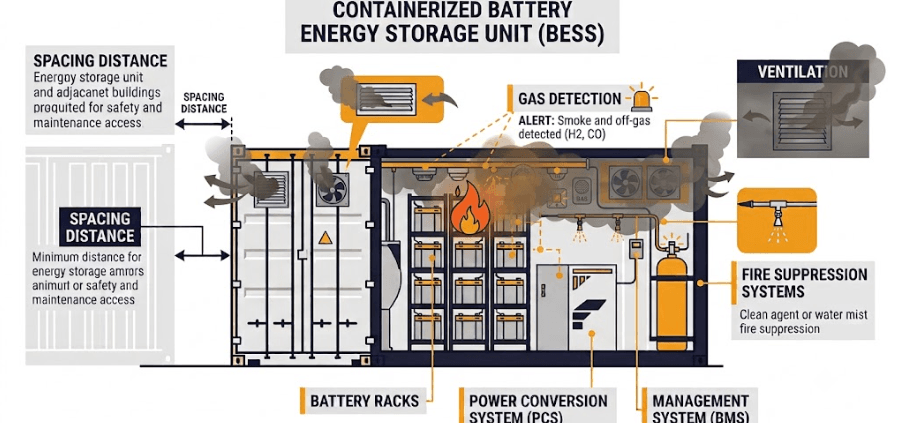
- Separation and spacing — distances between battery units, and between the ESS and exposures like buildings, property lines, and other hazards
- Fire detection and suppression — smoke and gas detection, plus sprinkler or other suppression systems sized to the installation
- Ventilation — exhaust systems that keep flammable gas concentrations below dangerous thresholds
- Explosion control — deflagration venting or prevention systems for enclosed spaces
- Hazard Mitigation Analysis (HMA) — a documented assessment of thermal runaway, fire propagation, and toxic gas risks for the specific installation
Why Thermal Runaway Is the Core Hazard
Every requirement in this guide exists to control one underlying hazard: thermal runaway. It starts when a single battery cell overheats past a critical point. The cell then generates heat faster than it can dissipate it.
This can trigger a self-sustaining chain reaction, where one failing cell heats its neighbors until they fail too. In the worst case, that cascade spreads across an entire rack or unit.
NFPA 855’s core requirements each target a different stage of this chain. Spacing and separation slow how fast a failure can spread to nearby units. Gas detection catches early off-gassing before it ignites. Ventilation clears flammable gases before they reach dangerous concentrations. Suppression systems, meanwhile, cool cells enough to interrupt the cascade.
The newest layer is Thermal Runaway Propagation Prevention (TRPP). Importantly, this active system goes a step further by detecting early precursors like off-gassing or abnormal temperatures. Consequently, it automatically triggers a targeted response to stop the failure before it ever reaches a neighboring cell.
The Hazard Mitigation Analysis ties all of this together — it’s the engineering process, led by a qualified PE, that sizes each control to your project’s specific chemistry and configuration, instead of applying generic rules.
NFPA 855 Scope and Applicability
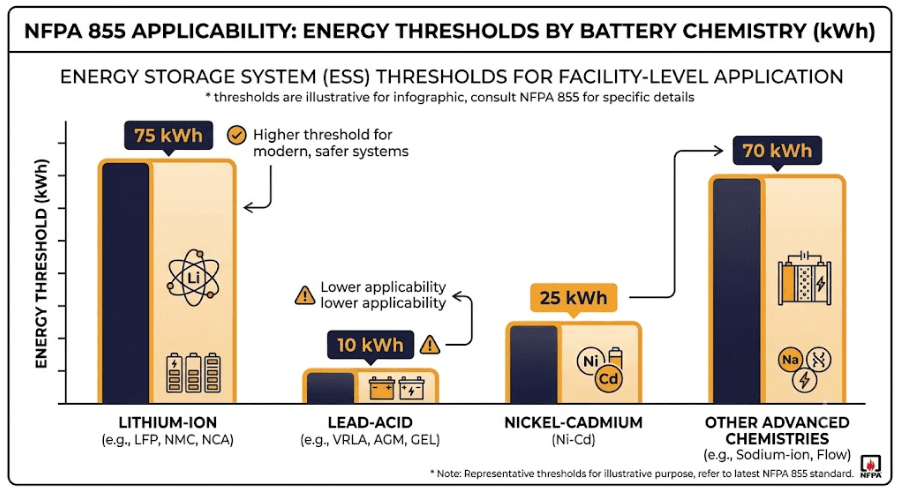
The first step is confirming the standard applies to your system at all. Applicability depends on battery chemistry and total stored energy, not project size alone. That said, below-threshold systems may fall outside full requirements. Your AHJ makes the final call.
| Battery Chemistry | Below Threshold | At or Above Threshold |
|---|---|---|
| Lithium-ion | < 20 kWh aggregate (may be exempt) | ≥ 20 kWh triggers full NFPA 855 requirements |
| Valve-regulated lead-acid (VRLA) | < 70 kWh aggregate (may be exempt) | ≥ 70 kWh triggers full NFPA 855 requirements |
| Other battery chemistries | Threshold set per chemistry table (2026 lists chemistries alphabetically) | Confirm with your AHJ before assuming exemption |
These thresholds still decide whether NFPA 855 applies to your system at all — that part hasn’t changed. What has changed is what happens once it does apply.
Previously, earlier editions let a project exceed the prescriptive threshold and still avoid a full Hazard Mitigation Analysis. It just had to stay under a separate “Maximum Stored Energy” cap in Chapter 9. The 2026 edition removed that cap entirely. As a result, once your system clears the Chapter 1 threshold, an HMA is the default requirement, not a fallback for oversized systems.
For example, a small server-room battery backup might still stay under 20 kWh and fall outside the standard’s full requirements. Almost any commercial, industrial, or utility-scale BESS, however, clears that threshold immediately. It now needs a documented HMA from the design stage, with no quantity-based way around it.
Source: Telgian Engineering & Consulting — NFPA 855 Changes in the 2026 Edition
What’s New in the 2026 Edition
This standard runs on a three-year revision cycle. The 2026 edition, however, brought some of the most significant changes since its 2020 debut. Here’s what stands out for project developers, grouped by area.
Hazard Mitigation Analysis and Professional Oversight
- Hazard Mitigation Analysis is now the default. Earlier editions required an HMA only in specific circumstances. The 2026 edition makes it the default requirement for most installations, with limited exceptions for well-understood chemistries like lead-acid.
- A registered design professional must direct the risk assessment. Annex G now specifically names who should lead the Hazard Mitigation Analysis: a registered design professional (a licensed PE) experienced in fire protection engineering and energy storage risk assessment. The 2023 edition only referred to “parties,” with no qualification requirement attached.
New and Expanded Safety Systems
- Thermal Runaway Propagation Prevention (TRPP) systems are now required. Section 9.7.6.6 introduces TRPP as a new, active fire-safety layer. Unlike passive features such as spacing or barriers, a TRPP system relies on active monitoring. Specifically, it detects early precursors like off-gas or abnormal temperatures. As a result, the system automatically triggers a targeted suppression or cooling response to stop the failure from spreading.
- Large-scale fire testing (LSFT) plays a bigger role. Previous editions leaned on UL 9540A cell, module, and unit-level testing. The 2026 edition adds large-scale fire testing. In this test, a full unit burns under real-world conditions with suppression disabled. This validates worst-case performance.
- Explosion-control guidance gets more specific. Annex G.8, which covers NFPA 69 evaluations for lithium-ion ESS, was revised with new engineering design and risk-mitigation considerations. Design teams now have clearer guidance for evaluating the consequences of an explosion event, not just whether one is possible.
Detection, Chemistry, and Emergency Planning
- Detection methods expand for lithium-ion storage. Section 14.3.2.1.2 now allows smoke detection, thermal imaging, or radiant-energy detection installed per NFPA 72, replacing the older, narrower detection language. A related new section, 14.1.3, also lets batteries staged or stored temporarily at 50% state of charge or below skip full Chapter 14 compliance, under defined conditions.
- Chemistry and application coverage expands. Additionally, the 2026 edition lists more battery chemistries. Furthermore, it drops the old subdivision between battery technologies and capacitor-based systems. It also adds two new chapters: Chapter 16 for flow batteries and Chapter 17 for energy storage systems on barges, plus expanded coverage of EV charging systems that include integrated energy storage.
- Emergency planning becomes formal. The 2026 edition adds specific minimum requirements for an Emergency Response Plan and a training program. The plan must address mitigation, preparedness, response, and recovery, with an annual review and a yearly refresher training session that the AHJ is notified of.
Source: Telgian Engineering & Consulting — NFPA 855 Changes in the 2026 Edition
Model fire codes take time to catch up. The 2024 International Fire Code, for example, still references NFPA 855-2023, not the 2026 edition. Many jurisdictions currently enforce that earlier version by default, even though NFPA has already published the newer standard. Because adoption timing varies by state and city, always confirm with your AHJ which edition actually governs your permit today, rather than assuming the newest edition automatically applies.
Source: IndexBox — NFPA 855 2026 Edition Updates
NFPA 855 Emergency Response and Backup Power Requirements
The 2026 edition adds two requirements that project teams commonly miss because they sit outside the usual spacing-and-suppression conversation.
Emergency Response Plan (ERP)
Every covered installation now needs a documented Emergency Response Plan. The plan must address four phases: mitigation, preparedness, response, and recovery. Facility operators must also run a training program for personnel, review the emergency operations plan annually, and hold a refresher training session every year. The AHJ must be notified when that training happens.
Emergency Power Supply Systems (EPSS/SEPSS)
New Section 4.10 requires that critical safety systems have reliable backup power. This applies to Emergency Power Supply Systems (EPSS) or Stored Emergency Power Supply Systems (SEPSS), built to NFPA 110 or NFPA 111. In practice, this means detection, suppression, and ventilation controls can’t silently fail during a grid outage. Per Section 4.10.22, the EPSS or SEPSS design must be available to the Fire Protection Engineer of record and the AHJ for review and approval, so this needs to enter the design package early, not as an afterthought during commissioning.
Source: Telgian Engineering & Consulting — NFPA 855 Changes in the 2026 Edition
NFPA 855 for C&I vs Utility-Scale BESS
The core framework applies the same way across project types. Practical requirements, however, shift with scale.
- Larger installations trigger stricter spacing and suppression requirements. Our C&I vs utility-scale BESS comparison covers the full picture. Utility-scale plants pack far more energy into open sites, so spacing tables scale up accordingly. C&I systems, meanwhile, sit next to occupied buildings and face tighter fire-marshal review instead.
- C&I systems usually sit close to occupied structures. As a result, local fire marshal review and building setback rules carry extra weight alongside these requirements.
- Utility-scale systems sit on purpose-built sites. Because of this, compliance centers more on large-scale fire testing data, explosion control, and emergency response planning coordinated with the local fire department.
- Both project types need UL 9540A test data. Otherwise, they can’t satisfy the engineering basis for spacing and suppression design.
How NFPA 855 Relates to Other Standards
This standard doesn’t work alone. It references and depends on several other standards. Confusing them is a common, costly mistake.
Fire and Thermal Testing Standards
- UL 9540 — the product-level safety certification for a complete energy storage system. Compliance also requires UL 9540-listed equipment.
- UL 9540A — the test method that measures thermal runaway fire propagation. Its results set the engineering basis for spacing and suppression decisions. The 6th edition, published alongside the 2026 NFPA 855 cycle, expands the certification framework to address spacing and fire propagation directly, rather than leaving those as separate design considerations.
- CSA/ANSI C800:25 — a newly published consensus standard for large-scale fire testing and ESS reliability. NFPA 855’s 2026 edition requires large-scale fire testing, but had no consensus test method to reference when it was finalized. CSA/ANSI C800:25 fills that gap, and NFPA has an open Tentative Interim Amendment (TIA Log No. 1852) proposing to formally reference it in Section 9.7. Worth tracking if you’re specifying test protocols today, since the reference may become official shortly after this guide’s publication.
Related Electrical, Grid, and Emerging Standards
- IEEE 1547 — governs grid interconnection behavior for distributed energy resources. It sits outside this standard’s fire-safety scope, but it often appears in the same project approval package.
- NEC Article 706 — the National Electrical Code section covering electrical installation requirements for energy storage systems above 1 kWh.
- NFPA 800 (forthcoming) — a new Battery Safety Code currently under development, with public input accepted through January 2026. Once adopted, NFPA 800 is intended to address battery hazards across the full lifecycle, not just installation, and to complement NFPA 855. Over time, it may shift or replace some of the storage-specific provisions NFPA 855 currently covers. Worth watching if you’re planning a multi-year project timeline.
For the complete standards landscape, see our guide to ESS codes and standards for utility-scale BESS.
Source: CSA Group — CSA/ANSI C800:25: A New Standard for ESS Reliability and Quality Assurance
Source: NFPA — Proposed TIA Log No. 1852 to NFPA 855-2026
Source: Energy-Storage.News — NFPA 855: 2026 edition updates and what they mean for energy storage projects
NFPA 855 Compliance Checklist
Use this sequence to build compliance into a project. Otherwise, you risk discovering requirements late, during permitting:
- Confirm applicability — check your chemistry and stored energy against the current threshold table.
- Then, select UL 9540-listed equipment with UL 9540A test data covering your configuration.
- Complete a Hazard Mitigation Analysis, led by a registered design professional (PE) with fire-protection and energy-storage risk-assessment experience. The 2026 edition makes the HMA itself the default requirement, and Annex G now specifically calls for that qualification.
- Also, design spacing, ventilation, detection, and suppression to the applicable chapter for your chemistry and installation type.
- Add explosion control per NFPA 69, or document a performance-based alternative.
- Draft an Emergency Response Plan covering mitigation, preparedness, response, and recovery, with an annual review and yearly refresher training built into your operating plan.
- Confirm backup power for critical safety systems (EPSS/SEPSS per NFPA 110/111) and route the design through your Fire Protection Engineer and the AHJ before finalizing.
- Finally, engage your AHJ early. Local adoption varies by state and jurisdiction. So, confirm which edition applies before finalizing your design.
Key Takeaways: NFPA 855
In short, this standard sets the fire-safety baseline for every battery energy storage system in the U.S., from a home battery to a utility-scale plant. The 2026 edition raises the bar with mandatory hazard analysis and large-scale fire testing. Compliance depends on chemistry, stored energy, and project scale. Therefore, the earlier you plan for it, the fewer surprises you’ll hit during permitting.
Frequently Asked Questions
Is NFPA 855 a Law or a Standard?
NFPA 855 is a consensus standard, not a law by itself. However, it carries legal weight once a jurisdiction adopts it, typically through NFPA 1 or the International Fire Code. Because adoption varies by state and city, always confirm which edition your local AHJ enforces.
Does It Apply to All Battery Chemistries?
Yes. The standard is technology-neutral and covers lithium-ion, lead-acid, flow batteries, nickel-based systems, and others. Each chemistry gets its own energy threshold. Consequently, the same project might qualify for an exemption under one chemistry and not another.
What’s the Difference Between UL 9540A and NFPA 855?
UL 9540A is a test method. It measures how far a fire propagates inside a battery system. NFPA 855, meanwhile, is the installation standard that uses those test results to set spacing, suppression, and separation requirements. Ultimately, you need UL 9540A data to satisfy it, not the other way around.
Does Compliance Differ for C&I vs Utility-Scale BESS?
The core framework stays the same, but practical requirements scale with the project. Utility-scale plants face larger spacing tables and heavier reliance on large-scale fire test data. C&I systems, meanwhile, face tighter scrutiny from local fire marshals, because they sit closer to occupied buildings.
When Does the 2026 Edition Take Effect?
NFPA publishes new editions on a regular three-year cycle, and 2026 follows that schedule. Model fire codes typically adopt a given edition about a year later. Because of this, check with your local AHJ to confirm which edition governs your permit application today.
Is Large-Scale Fire Testing Fully Standardized Yet?
Not completely. NFPA 855:2026 requires large-scale fire testing, but no consensus test method existed when the edition was finalized. CSA/ANSI C800:25, published shortly after, is expected to fill that role. NFPA has an open Tentative Interim Amendment proposing to formally reference it in Section 9.7. Until that TIA resolves, confirm your test protocol directly with your AHJ and testing lab.
Related Reading
- C&I vs Utility-Scale BESS: The Complete Comparison Guide
- ESS Codes and Standards for USA Utility-Scale BESS
- UL 9540A Test Method: Complete Guide for BESS Manufacturers
- Understanding BESS Specifications: The Complete Guide
- Battery Energy Storage System Safety
- BESS Certifications: Compliance Guide & Checklist
References
Gluing Cells in a Battery Pack: Heat, Swelling, and Long-Term Reliability
Gluing cells is a normal step in battery pack assembly. Most modern packs use adhesive between the cells and the enclosure. However, gluing cells actually means two different jobs, not one. One material moves heat. Another material holds the pack together. Mixing up those two jobs is where most long-term problems start.
| Quick Answer Gluing cells covers two different materials with opposite jobs. One is a soft, compressible thermal interface material (TIM) that carries heat away from cells. The other is a rigid structural adhesive that holds the pack together.Done correctly, gluing cells is safe and durable for the life of the pack. That means a controlled bond-line thickness, void-free contact, and room for swelling. Lithium cells swell 3–10% as they age.Done incorrectly, gluing cells can trap heat between cells. It can also crack under swelling stress. That happens when one adhesive covers both jobs, or when it’s spread across a cell’s full face with no room to expand. |
Why Battery Packs Use Adhesives at All
Cell bonding didn’t replace bolts and brackets by accident. Pack designs moved from cell-module-pack layouts toward cell-to-pack and cell-to-chassis layouts. Adhesives took on jobs that used to need dozens of fasteners. For example, they join dissimilar materials such as steel, aluminum, and composite housings. A continuous bond line also damps vibration better than point contacts. In the most advanced designs, the cells themselves add stiffness to the enclosure. As a result, the pack becomes lighter, simpler, and often more energy-dense.
That shift is exactly why gluing cells deserves more scrutiny than it usually gets. One bond line now holds cells in place. It also moves heat. And it has to tolerate swelling, all at the same time. Consequently, getting the material or the process wrong causes one of three problems later: hot cells, cracked bonds, or a pack nobody can take apart.
The Two Jobs Behind Gluing Cells
Thermal interface materials and gap fillers
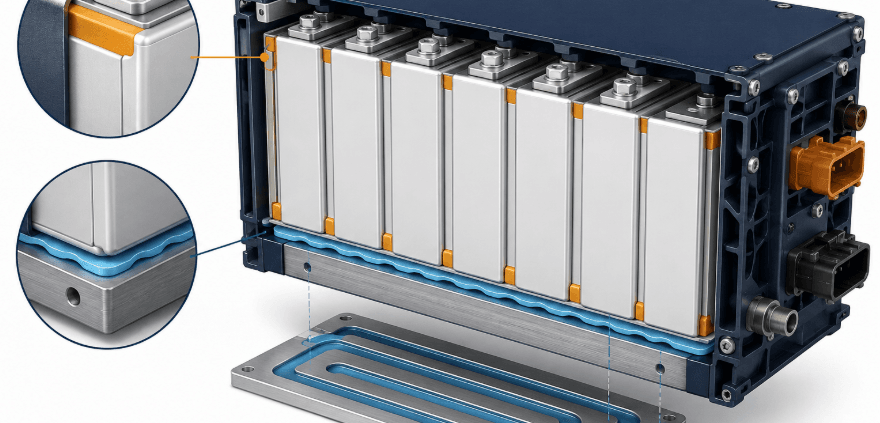
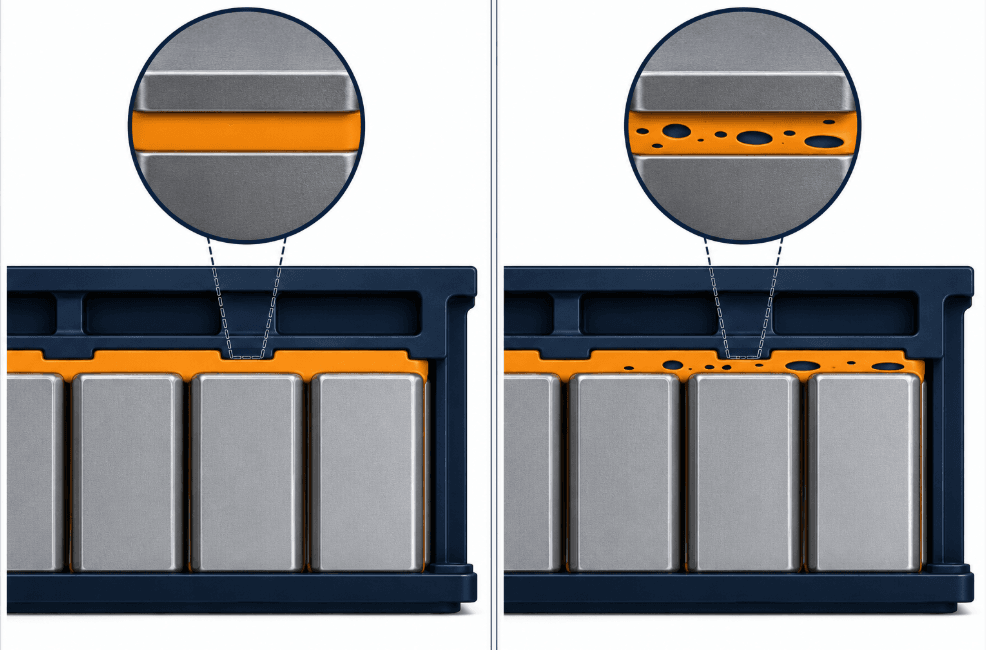
Thermal interface materials, or TIMs, are soft silicone or polyurethane pads, or dispensed pastes. They fill the microscopic air gaps between cells, modules, and cold plates. That gives heat a continuous path out, instead of an insulating air pocket. TIMs are built to be compliant, not strong. Gap fillers typically carry lap-shear strength below about 7 MPa. That’s far short of what’s needed to hold a cell in place. Their only job is heat transfer, so manufacturers keep them soft on purpose.
Structural adhesives used for gluing cells
Structural adhesives are the ones actually holding the pack together. They replace or support welds and fasteners. Epoxies bring high strength and chemical resistance. Toughened acrylics cure fast and resist peel and impact. Polyurethanes absorb vibration. They also tolerate the mismatched thermal expansion between metal housings and cell holders. A newer category, thermally conductive structural adhesive, tries to do both jobs in one material. That combination is a real trade-off, not a free upgrade. Pushing thermal conductivity up with more filler content tends to make the adhesive brittle. It also gets harder to dispense evenly.
How Gluing Cells Affects Heat Between Cells
Why an air gap traps heat
Every cell generates heat internally during charge and discharge. Neighboring cells in a tight module raise the stakes. Without a real thermal path between them, heat concentrates in the pack’s interior. It also builds up at poorly ventilated corners.
That’s the same mechanism behind the temperature spread covered in our guide to NMC vs. LFP thermal safety. For instance, a poorly managed corner of a rack can run 10–15°C hotter than the rest. The hottest cells age fastest. This isn’t a small effect — because degradation scales exponentially with temperature, not linearly, small gaps between cells compound rather than average out over years of service. See our guide on How Temperature Accelerates Battery Degradation: The Arrhenius Relationship for the mechanism behind why this matters so much. That pattern drags down the whole pack’s usable capacity, as covered in how temperature affects LiFePO4 cycle life.
An air gap between cells conducts heat poorly. So the material occupying that space does real thermal work, not just holding parts together. Displacing that air with a void-free, well-wetted TIM is what actually moves heat toward the cooling plate.
Why bond-line quality beats the datasheet number
Here’s the counterintuitive part: the conductivity number on a datasheet doesn’t predict real-world performance well. In one documented case, a 1.2 W/mK gap filler outperformed a 3.0 W/mK material at the pack level. The lower-conductivity material wet out the surfaces more completely. It also held consistent contact under compression. Meanwhile, a high-conductivity material applied with a thick or uneven bond line will underperform a lower-conductivity material applied well.
The same logic applies on the structural side. Structural adhesives usually conduct heat worse than purpose-built TIMs. A pack that relies on one universal adhesive for both jobs compromises on both. Separating the two zones keeps each material doing the job it was built for. Use a compliant TIM between cells and the cooling plate. Confine the structural bond to a smaller footprint, such as dots or beads, at the pack frame.
How Cell Swelling Affects Gluing Cells
Why cells swell
Lithium cells physically change volume as they cycle. Pouch and prismatic cells commonly swell 3–10% by volume as the graphite anode expands during normal charging. That swelling compounds with age. Gas generation and irreversible capacity fade set in over years of service. Therefore, a pack design that ignores this treats swelling as an afterthought, not a real load case.
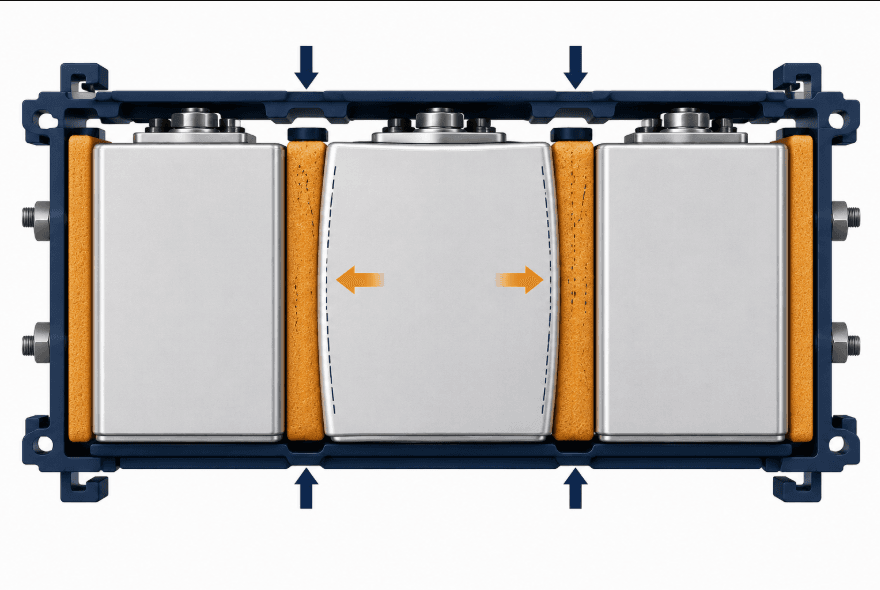
The standard fix is mechanical, not adhesive. Compressible buffering elements sit between cells: gap pads, foam interlayers, or engineered compression pads. They accommodate expansion under a defined, controlled pressure over the pack’s full life. They also spread pressure more evenly across the stack. Engineers pick these materials for low creep and stable restitution. A pad that permanently deforms under years of cyclic compression stops doing its job long before the pack reaches end of life.
Why rigid gluing cells fails under swelling
This is where rigid gluing cells becomes a real failure mode. Picture a hard, fully cured structural adhesive spread across the whole face of a cell. Instead of accommodating expansion, it resists it. As the cell pushes against an unyielding bond line, stress concentrates at the casing and the electrode stack. The outcome can be casing deformation, internal delamination, or a cracked bond. That failure often happens at the exact moment good thermal contact matters most. It’s partly why engineers apply elastomeric adhesive as dots or beads instead of full-face coverage. A bead can stretch locally with the cell, instead of resisting it uniformly.
Is Gluing Cells Good for Long-Term Use, or a Problem?
Both, depending on how engineers design it. The honest answer isn’t a blanket yes or no.
What gluing cells gets right, long-term
- Fewer parts and less weight than bolted or bracketed designs, without giving up structural stiffness
- A continuous bond line damps vibration better than point-contact fasteners, cutting fatigue-driven loosening over years
- A properly applied TIM closes the thermal gap that air leaves open, improving temperature uniformity rather than degrading it
- Enables higher energy density cell-to-pack designs that frames and fasteners alone can’t match
Where gluing cells creates long-term liabilities
- Disassembly for failure investigation or repair gets slow and hazardous. Teardown around cells sensitive to thermal runaway carries real risk
- End-of-life recycling gets harder too. Adhesive bonds are a well-documented obstacle to cell-level disassembly for direct recycling
- Some silicone-based TIMs outgas or migrate over years of thermal cycling. That’s why designers increasingly specify low-migration formulations near electrical contacts
- A pack with no mechanical backup has no fallback. If a bond line degrades or disbonds from swelling stress over 10–15 years, nothing else holds the cell in place
Because of these trade-offs, the industry trend points toward keeping the benefits of gluing cells. At the same time, it builds in a path back out. That means adhesives designed for controlled debonding. It also means layouts that keep some mechanical retention as backup, instead of relying on the bond line alone.
Best Practices for Gluing Cells to Avoid These Problems
Separate the TIM zone from the structural zone
Don’t ask one adhesive to be both the heat path and the load path. Instead, use a compliant, thermally conductive gap filler between cells and the cooling plate. Confine structural bonding to a smaller footprint. Size it for the actual mechanical load, not the full cell face.
Control bond-line thickness
Specify and verify a controlled, thin, void-free bond line. Don’t just trust the conductivity number on a datasheet. A well-wetted, void-free interface at moderate conductivity consistently beats a high-conductivity material with air pockets or an uneven bond line.
Build swelling into the design, not just the adhesive
Treat swelling as its own load case. Use a compression pad with a defined force-deflection curve and low long-term creep. Don’t assume an adhesive bead will simply stretch forever. Where adhesive does touch cell faces, keep it in small, discrete beads. These can flex locally instead of forming one rigid full-face bond.
Match adhesive chemistry to the job
- Epoxy: highest strength and chemical resistance, but rigid and brittle unless toughened. Use it where strength matters more than compliance
- Acrylic: fast cure with good peel and impact resistance, which helps where production throughput matters
- Polyurethane: absorbs vibration and tolerates thermal-expansion mismatch, often the better default for anything bonded directly to a cell
- Silicone: highly compliant across a wide temperature range, the default for TIM pads and pastes. Confirm the formulation is low-migration near electrical contacts
Design for disassembly
Keep a mechanical fastening option at key access points where full structural bonding isn’t strictly required. Or specify a debonding-capable adhesive instead. This approach costs more up front. But it gives up little in performance. Over time, it turns a multi-hour, higher-risk teardown into a manageable service or recycling job.
Verify, don’t assume
Run pull tests. Inspect for voids with ultrasound or CT scanning. Use thermal imaging on prototype packs. These checks catch the gap between what a datasheet promises and what the dispensing process actually delivered. Bond-line quality is a process outcome, not just a material choice.
Key Takeaways on Gluing Cells
| Question | Short Answer |
|---|---|
| Does gluing cells cause heat buildup? | Only with the wrong adhesive, voids, or a thick bond line. The right TIM lowers cell-to-cell temperature spread versus an air gap. |
| Does gluing cells survive swelling? | Rigid, full-face structural adhesive doesn’t. Compressible pads plus small adhesive beads do. |
| Can a pack with glued cells be repaired? | Harder than a bolted pack, but manageable with the right adhesive and access points designed in from the start. |
| Is gluing cells bad for long-term use? | Not inherently. The failures come from using one adhesive for every job, not from gluing cells itself. |
Frequently Asked Questions About Gluing Cells
Does gluing cells make a battery pack run hotter?
Not with the right material in the right zone. A properly applied TIM displaces the air gap between cells and the cooling plate. That generally improves temperature uniformity compared with an unfilled air gap. However, heat buildup happens when a poorly conductive structural adhesive sits across a thermal path. It also happens when the TIM has voids or an uncontrolled bond-line thickness.
How much do cells actually swell?
Pouch and prismatic lithium cells commonly swell 3–10% in volume through normal cycling. Add more irreversible swelling as cells age and generate gas over years of service. As a result, pack mechanical design needs to treat this as a real load, not a rounding error.
Can a pack with glued cells be repaired or recycled?
Yes, but adhesive bonds are a well-documented obstacle. They make cell-level disassembly harder for repair, failure investigation, and direct recycling. That said, packs with debonding-capable adhesives or a mechanical backup are far easier to service and recycle than fully bonded designs with no fallback.
Is silicone or epoxy better for gluing cells?
They suit different jobs. Silicone is the default for compliant thermal pads and pastes, because it stays soft across a wide temperature range. Epoxy is stronger and more chemically resistant, which makes it common for structural bonding. Because epoxy stays rigid unless toughened, keep it away from surfaces that swell or flex.
Is mechanical fastening better than gluing cells?
Mechanical fastening allows easy disassembly. It also adds no cure-related risk. However, it typically has higher electrical resistance at the joint. It can loosen under vibration, and it adds bulk that works against energy density. Because of this, most modern packs mix both methods: fasteners or welds for electrical connections, and adhesive for thermal and structural bonding.
Further Reading
- Cell Temperature Gradients and NMC vs. LFP Thermal Safety
- Impact of Temperature on LiFePO4 Battery Cycle Life
- How Temperature Accelerates Battery Degradation: The Arrhenius Relationship
- Understanding BESS Specifications: The Complete Guide
- BMS for LiFePO4 Batteries: Requirements and Parameters
- UL 9540A Test Method for BESS Manufacturers
- Charging Temperature: The Overlooked Factor in Battery Datasheets
- Adhesives Technology for EV Batteries — BatteryTech Online
- Beyond the Bond: Advanced EV Battery Pack Adhesives — eMobility Engineering
- Designing a Battery Pad for Li-Ion Pouch Cells — Stockwell Elastomerics
- Adhesive Bonding in Automotive Battery Pack Manufacturing and Dismantling — Discover Mechanical Engineering
Cell Internal Resistance: What It Is, Why It Rises, and How to Measure It
| ⚡ Quick Answer: Cell Internal Resistance in Brief Cell internal resistance is the opposition a lithium-ion cell presents to current flow. It combines ohmic resistance (foils, tabs, electrolyte), charge-transfer polarization (the reaction barrier at the electrode surface), and diffusion polarization (ion movement inside the electrode). It is measured in milliohms, rises with age, cold temperature, and extreme state of charge, and directly governs heat generation, round-trip efficiency, and available power. ACIR, DCIR, and EIS are the three standard ways to measure it. |
What Is Cell Internal Resistance?
Every lithium-ion cell acts like a small resistor. It sits in series with an ideal voltage source. So when current flows, part of the cell’s energy turns into heat. It never reaches the terminals as usable power. This loss is called cell internal resistance, or Cell IR for short.
Cell IR is not one single part. Instead, it is a combined value. It captures several resistive and electrochemical processes happening at once. As a result, Cell IR changes with temperature, state of charge (SOC), and age. In fact, this is also why two test methods, ACIR and DCIR, can report different numbers for the same cell.
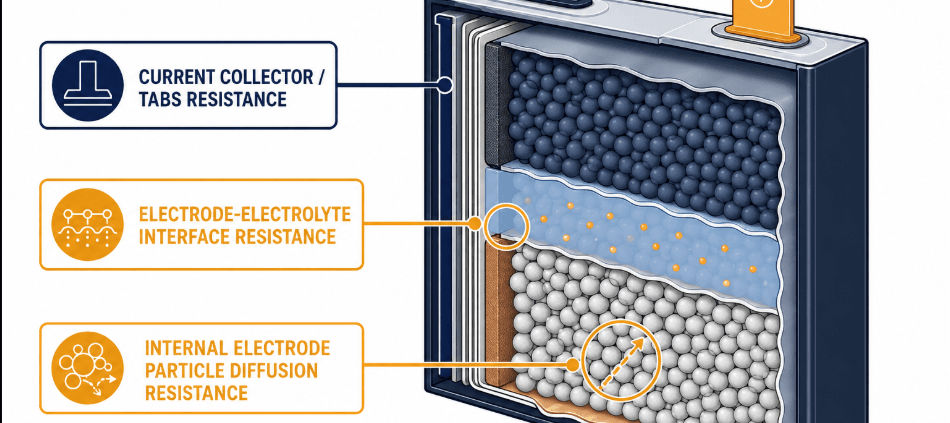
The Three Components of Cell Internal Resistance
According to electrochemical impedance spectroscopy (EIS) research, cell internal resistance splits into three physical parts. Each part dominates over a different timescale.
| Component | What It Physically Represents | When It Dominates |
|---|---|---|
| Ohmic resistance | Current-collector foils, tabs, weld joints, separator, and electrolyte conductivity — a true, frequency-independent resistance | Instantaneous; measured directly by 1 kHz ACIR |
| Charge-transfer (activation) polarization | The energy barrier lithium ions must overcome to cross the electrode–electrolyte interface | Milliseconds to seconds into a current pulse |
| Diffusion (concentration) polarization | Ion movement and concentration gradients inside the solid electrode particles and electrolyte | Seconds to minutes; dominant during sustained load |
Ohmic resistance responds right away. Diffusion resistance, by contrast, builds up slowly over time. So the length of the test pulse changes what you actually measure. That, in short, is why a 1 kHz ACIR reading and a multi-second DCIR pulse test rarely agree on the same cell.
Key Takeaways: Cell Internal Resistance at a Glance
| Attribute | Summary |
|---|---|
| Typical unit | Milliohms (mΩ) for large-format cells; the value scales with electrode/tab area, so small cylindrical cells read much higher than large prismatic cells |
| Large-format LFP prismatic cells (280–314 Ah) | Commonly 0.15–0.5 mΩ ACIR at 1 kHz, 25 °C, ~30% SOC, varying by manufacturer and grade |
| Primary heat mechanism | Joule heating, P = I²R — heat rises with the square of current |
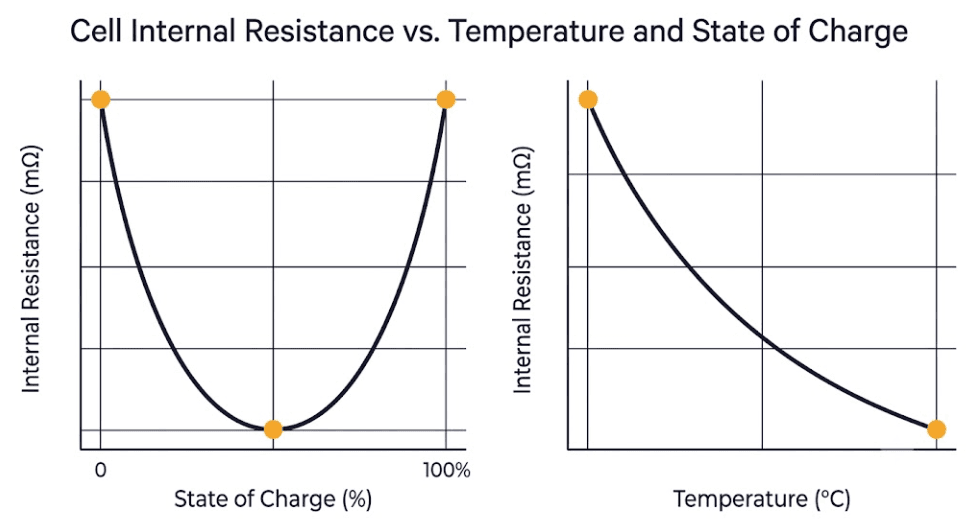
| Rises with | Cell aging/cycling, cold temperature, and SOC extremes (very low or very high) |
| Lowest at | Mid-range SOC (roughly 30–70%) and moderate temperature (roughly 15–35 °C) |
| Standard measurement methods | ACIR (1 kHz AC), DCIR (DC pulse), EIS (frequency sweep) |
| BMS relevance | Cell matching/sorting, thermal design margin, voltage-sag protection thresholds, SOH estimation |
Why Cell Internal Resistance Matters
1. How Cell Internal Resistance Generates Heat
Cell IR is the main source of heat inside an operating cell. Heat generation follows Joule’s law: P = I²R. In other words, heat rises with the square of current. So, even a small increase in resistance causes a large rise in thermal load at high C-rates. That is why, in practice, BESS designers usually size cooling systems around worst-case DCIR rather than nameplate ACIR.
2. Cell IR and Round-Trip Efficiency
Every milliohm of resistance turns some charge and discharge energy into waste heat. This happens instead of usable throughput. Consequently, this resistive loss is one of the main contributors to round-trip efficiency. It sits alongside power-conversion and thermal-management losses.
3. Cell IR, Available Power, and Voltage Sag
Under high current draw, resistance causes the terminal voltage to sag below the open-circuit voltage. If resistance is high enough, that sag can push the terminal voltage below an inverter’s cutoff threshold. This can happen even while real charge remains in the cell. In practice, then, it is a nuisance trip that looks like a capacity problem. In fact, it is a resistance problem.
4. Cell IR as a Leading Indicator of Aging
Cell IR, particularly DCIR, tends to rise before rated capacity visibly degrades. As the solid-electrolyte interphase (SEI) layer thickens with cycling, resistance climbs steadily. For this reason, resistance tracking is a standard input to State of Health (SOH) estimation.
What Changes Cell Internal Resistance
Cell IR is not a fixed number on a datasheet. Instead, it is a dynamic value that shifts with operating conditions. So, the factors below explain most of the variation seen in the field.
| Factor | Effect on Internal Resistance |
|---|---|
| Temperature | Resistance falls as temperature rises (faster ion mobility) and climbs sharply below roughly 0 °C; temperature swings of ±10 °C can shift measured resistance by around 20% |
| State of charge (SOC) | Follows a U-shaped curve — lowest in the mid-SOC range, rising again at very high and especially very low SOC as diffusion polarization increases |
| Aging / cycle count | Rises steadily over cell life as the SEI layer thickens and active material loses contact; DCIR growth of roughly 50–150% over a cell’s usable life is commonly reported, with LFP tending to show faster proportional resistance growth than NMC |
| C-rate / pulse duration | Longer, higher-current pulses capture more diffusion polarization, so DCIR measured over several seconds reads higher than a short 1 kHz ACIR snapshot on the same cell |
| Cell format and design | Large-format prismatic and pouch cells generally report lower resistance per cell than small cylindrical formats, because tab and current-collector area — not just chemistry — governs the ohmic term |
| Manufacturing quality / grade | Electrode coating uniformity, electrolyte wetting, and weld quality all shift the ohmic term; grading by resistance is a standard incoming-QC step for large-format LFP cells |
Cell Internal Resistance: LFP vs. Other Chemistries
Lithium iron phosphate (LFP) cells usually start life with low, stable resistance. This is true compared with nickel-based chemistries. In fact, it is one reason LFP has become the default choice for stationary BESS. However, field research on LFP cell aging shows resistance growth speeds up faster, in relative terms, than in NMC cells as cycling progresses. As a result, resistance trending is a more important monitoring parameter for LFP-based systems over a 10–15 year project life. For a full chemistry-level safety comparison, meanwhile, see NMC Battery vs LFP Safety: The Complete BESS Risk Breakdown.
How Cell Internal Resistance Is Measured
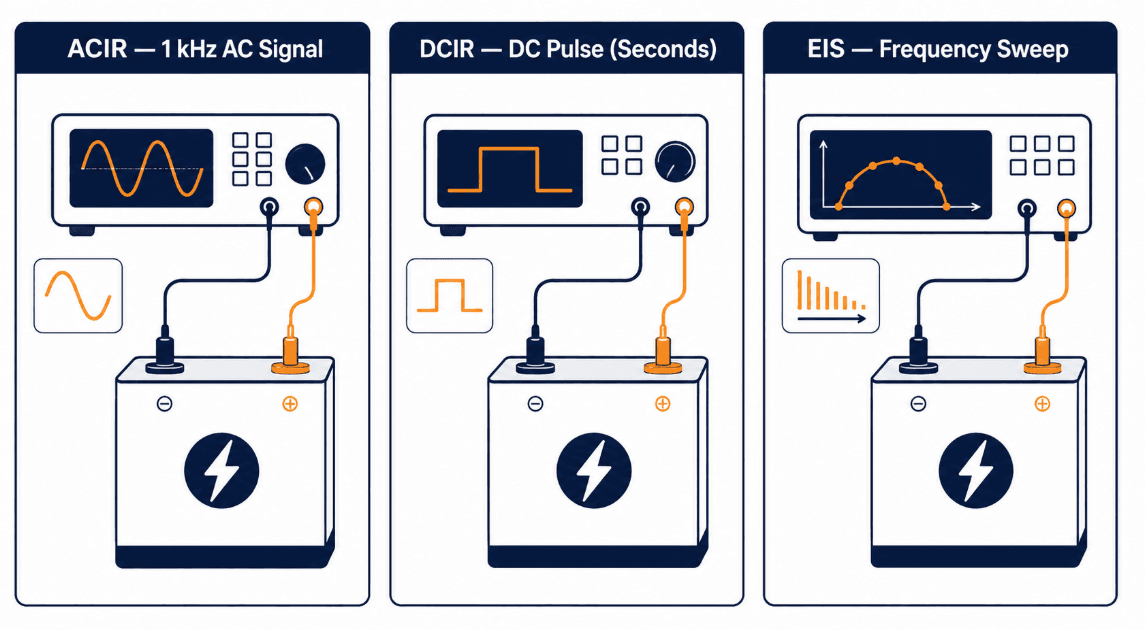
Three methods dominate industrial and BESS-integrator practice. Each one, however, answers a slightly different question. So this section compares all three, to help you choose the right one.
| Method | Signal Type | What It Captures | Typical Use |
|---|---|---|---|
| ACIR | Small AC current at 1 kHz | Ohmic resistance only — fast, repeatable, standardized | Incoming cell QC, sorting, and grading |
| DCIR | DC current step or pulse (seconds) | Ohmic + charge-transfer + diffusion polarization together | System-level power modeling, thermal design, real-world performance |
| EIS | AC sweep from mHz to tens of kHz | Separates all three components individually across frequency | Root-cause diagnostics, R&D, degradation-mechanism analysis |
ACIR is fast, taking under a second per cell. It is also highly repeatable. For this reason, it is the standard tool for grading incoming cells at the factory. DCIR, on the other hand, takes longer. But it reflects how a cell actually behaves under a real grid-power pulse. Therefore, it is the preferred input for thermal and power-delivery modeling, as Keysight’s ACIR and DCIR measurement methodology explains. EIS, meanwhile, is the slowest and most instrument-intensive method. So it is reserved for diagnostic work, where engineers need to know exactly which resistance component is degrading.
| Further technical detail This article covers the fundamentals shared by all three methods. For a full methodology breakdown, read The 1 kHz Window: ACIR for LFP Cell Grading and The Power Test: Why DCIR Is the True Measure of BESS Performance. |
Cell Internal Resistance in Pack and BMS Design
Cell IR and Cell Matching
Cells assembled into a series string should be matched on capacity and open-circuit voltage. However, they should also be matched on Cell IR. A cell with much higher resistance than its neighbors heats faster and sags further under load. It also drifts out of SOC balance faster. This, in turn, speeds up imbalance, even when the BMS works correctly.
Cell IR and Thermal Design Margin
Heat scales with resistance and the square of current. Therefore, thermal designers size cooling capacity around worst-case DCIR at end-of-life, not fresh-cell ACIR. Ignoring resistance growth over the warranty period, unfortunately, is a common cause of undersized thermal margin in early-life system designs.
SOH Estimation and Voltage-Sag Protection
DCIR climbs in a predictable way with age. Because of this, it is one of the standard inputs a BMS uses to estimate State of Health without a full capacity test. Resistance data, in addition, informs voltage-sag-aware cutoff thresholds. In turn, this prevents the BMS from tripping early on a cell that still has usable charge but momentarily high resistance under load.
Frequently Asked Questions
What is a normal cell internal resistance for a LiFePO4 cell?
It depends heavily on cell size. Large-format prismatic LFP cells used in BESS (280–314 Ah) typically measure around 0.15–0.5 mΩ ACIR at 25 °C and roughly 30% SOC. This, of course, varies by manufacturer and grade. Smaller cylindrical LFP cells, by contrast, have much less current-collector and tab area. So they commonly measure in the tens of milliohms.
Does cell internal resistance always increase with age?
In normal operation, yes. Resistance trends upward over a cell’s cycle life as the SEI layer thickens and internal contact degrades. However, the rate varies by chemistry, temperature history, and depth of discharge. Notably, a sudden, sharp resistance spike, rather than a gradual trend, is more likely to signal a fault than normal aging.
Why does Cell IR increase in cold weather?
Low temperature slows lithium-ion movement in the electrolyte. It also slows the electrochemical reactions at the electrode surface. Together, these effects raise both the ohmic and polarization parts of resistance. This is why cold-climate BESS enclosures use insulation and heating elements. As a result, cells stay within their optimal temperature band before drawing high power.
Is lower resistance always better?
Lower resistance generally means less heat, higher efficiency, and more available power. However, resistance is only one design variable among several. Some manufacturers, in fact, accept a modest resistance trade-off for a formulation that prioritizes thermal stability or cycle life. Overall, then, resistance should be evaluated alongside safety margin and cycle-life data, not in isolation.
Is ACIR or DCIR more accurate?
Neither is universally more accurate; they simply answer different questions. ACIR is the more repeatable, standardized snapshot of ohmic resistance. So it works best for comparing cells to each other. DCIR, on the other hand, reflects how the cell behaves under an actual power pulse. This, in turn, makes it the better input for system-level thermal and performance modeling.
Further Reading
- The Power Test: Why DCIR Is the True Measure of BESS Performance
- The 1 kHz Window: ACIR for LFP Cell Grading
- Demystifying LiFePO4 Battery Testing: How Manufacturers Grade Their Cells
- Battery Management System (BMS) Explained
- BMS SOC Estimation Methods Explained
- NMC Battery vs LFP Safety: The Complete BESS Risk Breakdown
- A Practical Guide to Battery Cycle Standards: DOD, SOH & EOL
- Understanding BESS Specifications: The Complete 2026 Guide
Technical References
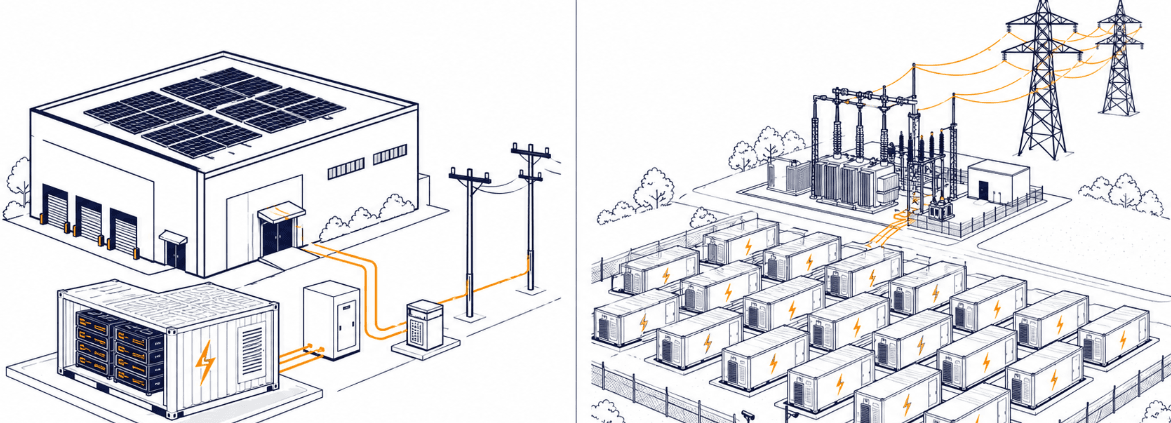
C&I vs Utility-Scale BESS: The Complete Comparison Guide
C&I vs utility-scale is the first question every solar or battery storage project must answer. The two terms sound like simple size labels. In reality, they describe two very different businesses. Not only do they serve different customers, but they also connect to the grid differently and rely on entirely unique financing and equipment. This guide walks through the full C&I vs utility-scale comparison, section by section, so you know exactly which one applies to your project.
| ⚡ Quick Answer: C&I vs Utility-Scale In short, C&I vs utility-scale comes down to one factor: what sits behind the grid connection. A C&I system serves a single business site and lowers that site’s own electricity bill. A utility-scale system, on the other hand, connects straight to the grid and sells power to the wider market. Everything else — size, financing, interconnection, and equipment — follows from that one distinction. |
C&I vs Utility-Scale: Key Differences at a Glance
Before the full breakdown, here’s the short version of the comparison:
- Size: C&I typically runs 100 kW to 10 MW. Utility-scale typically runs 20 MW to 500+ MW.
- Connection: C&I sits behind the meter. Utility-scale sits in front of it.
- Revenue: C&I saves money on one facility’s bill. Utility-scale earns revenue from the wholesale market.
- Timeline: C&I projects often finish in months. Utility-scale projects often take years.
- Ownership: hosts or third-party lessors typically own C&I systems. Independent power producers typically own utility-scale plants.
What Does C&I Mean?
C&I stands for Commercial and Industrial. In the BESS world, it describes systems installed at a business’s own site. Picture a factory, a warehouse, a distribution center, or a hospital. These systems serve that facility’s own electricity needs. Specifically, C&I systems typically range from 100 kW to a few megawatts (MW). Large industrial campuses can reach 5–10 MW.
A C&I system sits behind the customer’s meter. Its main job is cutting that facility’s electricity bill, not selling power onto the grid. For that reason, businesses deploy C&I storage for several reasons:
- Demand charge reduction — the battery discharges during peak demand and shaves the facility’s peak draw. Utilities bill demand separately from energy, often heavily. As a result, peak shaving delivers one of the fastest paybacks in the industry.
- Time-of-use (TOU) arbitrage — the system charges when electricity is cheap and discharges when it’s expensive.
- Backup power — stored energy keeps critical loads running through an outage.
- Solar self-consumption — pairing storage with on-site solar lets the facility use more of its own generation instead of exporting it.
- Demand response — the facility earns payments for cutting load when asked.
- In addition, every one of these applications runs on the same core hardware — batteries, inverters, and enclosures — covered in our guide to the key components of a C&I BESS.
What Does Utility-Scale Mean?
Utility-scale storage means large power plants. Some call it grid-scale or front-of-the-meter storage. These plants typically run from tens of megawatts to several hundred megawatts. The largest projects reach the gigawatt range for total energy capacity. Unlike C&I systems, utility-scale plants don’t serve one building. Instead, they connect directly to the transmission grid or a high-voltage line, and they sell power and grid services into the wholesale market.
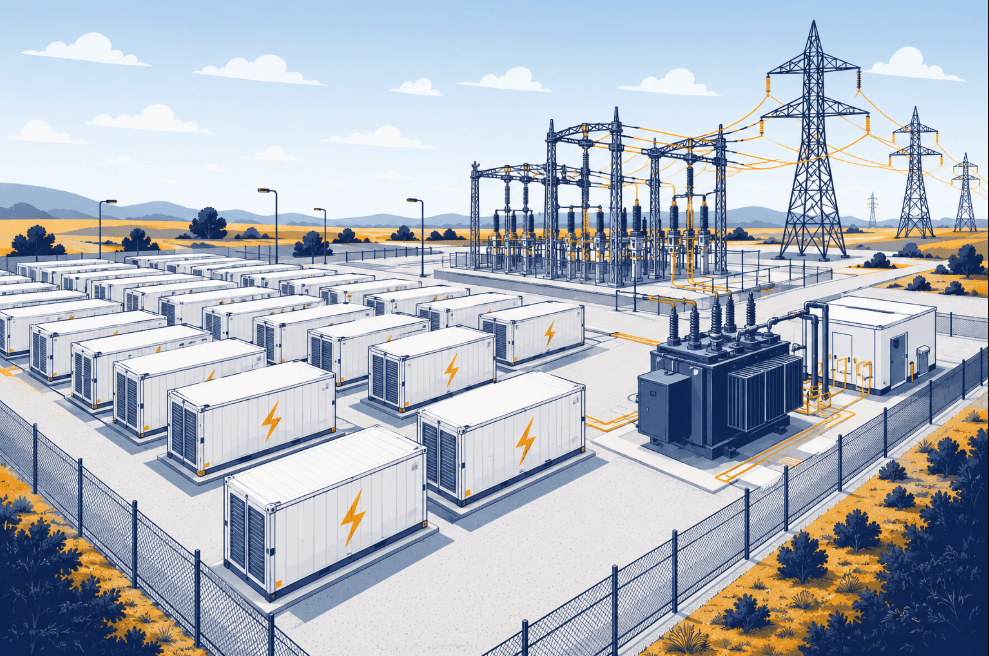
Developers build, own, and operate these projects as standalone power plants. Revenue comes from several sources:
- Power purchase agreements (PPAs) with a utility or corporate offtaker
- Wholesale energy market sales — buying low and selling high across the day
- Ancillary services, such as frequency regulation, spinning reserve, and capacity payments
- Resource adequacy and capacity markets, which pay the plant to stay available during system peaks
- For the full technical breakdown, see our guide to understanding utility-scale BESS.
The Real Dividing Line: What’s Behind the Meter
Most people reach for size first when they compare C&I vs utility-scale projects. But size is only a side effect, not the real distinction. The true dividing line is simpler: does an existing load sit behind the grid connection?
A C&I plant connects at a site with an existing load — a factory, a data center, a logistics hub — and the battery interacts with that load. A utility-scale plant, by contrast, connects at a site built only for the plant itself. No meaningful load sits behind it. The plant exists purely to generate or store energy for the grid.
This explains an unusual case. A data center with tens of megawatt-hours of storage still counts as C&I, because a load sits behind the meter. A small dedicated battery plant on a remote substation still counts as utility-scale, because no load does. In short, size alone never decides the category.
C&I vs Utility-Scale: Side-by-Side Comparison
The table below summarizes the core C&I vs utility-scale differences at a glance.
| Attribute | C&I | Utility-Scale |
|---|---|---|
| Typical size | ~100 kW – 10 MW | ~20 MW – 500+ MW |
| Connection point | Behind the customer’s meter, low/medium voltage | Front-of-the-meter, transmission or sub-transmission voltage |
| Primary customer | The host facility (factory, warehouse, campus) | The grid / wholesale market / utility offtaker |
| Main value streams | Demand charge reduction, TOU arbitrage, backup power, self-consumption | Energy arbitrage, capacity payments, ancillary services, PPA revenue |
| Ownership model | Facility owner, third-party PPA/lease, or ESA | Independent power producer (IPP), utility, or institutional investor |
| Site control | Existing commercial/industrial property | Purpose-acquired land, often rural |
| Interconnection process | Utility’s commercial/small-generator process | RTO/ISO or utility large-generator interconnection queue |
| Typical BESS duration | 1–4 hours | 2–8+ hours, growing interest in long-duration storage |
| Design driver | Facility load profile and tariff structure | Market price signals and grid needs |
| Permitting complexity | Lower — usually local/municipal | Higher — environmental review, land use, transmission studies |
| Typical project timeline | Months | Multiple years, often 3–7 years including interconnection queue |
| Typical payback / horizon | 3–7 years, driven by demand charges and tariff spreads | 10–15+ years, underwritten by long-term PPA and market revenue |
C&I vs Utility-Scale: Technical Differences
Size and connection point drive real engineering differences between C&I vs utility-scale systems. Here’s how they show up in practice, category by category.
Voltage and Interconnection Equipment
C&I systems usually interconnect at low voltage (400–480V) or medium voltage (4.16–34.5 kV). They tie directly into a building’s electrical service or a nearby feeder. Utility-scale systems, however, interconnect at transmission-class voltages, often 69 kV and above. That higher voltage requires dedicated substations, step-up transformers, and compliance with the utility’s or ISO’s large-generator interconnection agreement.
Control and Dispatch Strategy
A C&I energy management system (EMS) tunes itself around the host facility’s own load curve. Specifically, it tracks peak demand windows and the site’s utility tariff. A utility-scale EMS, in contrast, tunes around market price signals and grid-operator dispatch instructions. Increasingly, it also stacks multiple revenue streams at once — a practice the industry calls value stacking.
Duration, Cycling, and Modularity
C&I batteries commonly run 1–4 hour discharge durations, matched to typical demand-charge windows. Utility-scale batteries, meanwhile, increasingly target longer durations — 4, 8, or more hours — to cover evening peaks as solar output fades. As a result, they also cycle more predictably against known market patterns.
Physical layout differs too. C&I deployments often use a few large enclosures sized to fit an existing footprint, such as a rooftop or a parking area. Utility-scale projects, by comparison, deploy dozens to hundreds of containerized units across open land, in a standardized layout built for construction speed.
Inverter Control Mode
Roughly 80–85% of all BESS installed worldwide today use grid-following (GFL) inverters, which lock onto an existing grid signal. Utility-scale projects, however, increasingly specify grid-forming (GFM) inverters instead. These can lightweight-synthesize their own voltage and frequency reference, support black start, and provide synthetic inertia.
While those capabilities matter far more at grid scale than behind a single facility’s meter, there is a major exception emerging in the C&I space: advanced microgrids. High-reliability C&I applications—such as islanded critical infrastructure, data centers, or remote mining sites—are actively adopting grid-forming inverters. This allows the facility to safely intentional-island from the main grid during an outage and maintain seamless, resilient operations on its own terms.
Codes and Standards
- Both categories follow UL 9540 for energy storage systems, UL 9540A for thermal runaway fire testing, and NFPA 855, the primary U.S. fire code for stationary energy storage. or a deep dive into the latest safety rules, spacing requirements, and hazard testing under this framework, read our comprehensive NFPA 855 guide.
Utility-scale sites, however, carry extra requirements tied to grid interconnection standards. Examples include IEEE 1547 for distributed resources and FERC/NERC reliability rules for transmission-connected assets. C&I systems, meanwhile, must satisfy local fire marshal and building code review, since they sit next to occupied buildings.
C&I vs Utility-Scale Interconnection Process
Interconnection turns the C&I vs utility-scale comparison into a real scheduling and risk problem, not just an engineering one.
C&I Interconnection
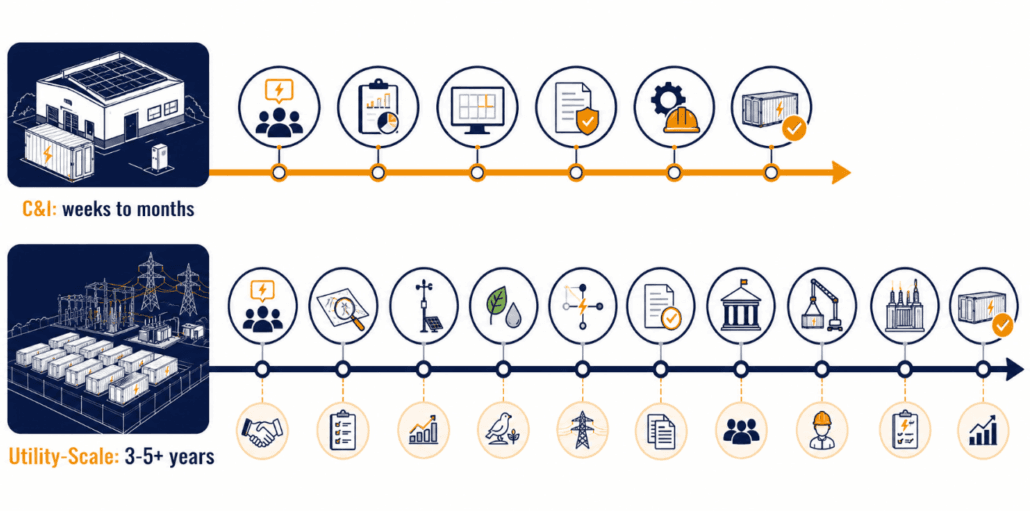
A C&I system typically goes through the utility’s existing commercial or small-generator interconnection process. Because the site already connects to the grid, the project doesn’t need new transmission infrastructure. As a result, timelines usually run from a few weeks to a few months.
Utility-Scale Interconnection
- A utility-scale project must apply to the regional transmission organization (RTO) or independent system operator (ISO), or to the relevant utility, through a large-generator interconnection queue. FERC sets the federal rules for this process, which includes system impact studies and facilities studies. It often requires the developer to fund network upgrades the studies identify.
Interconnection queues in many U.S. regions now run 3–5+ years. Some run much longer. Because of this, interconnection timing is one of the biggest risk factors in utility-scale project development.
C&I vs Utility-Scale: Financing and Economics
- C&I projects usually rely on financing built for a single host customer. A business might pay cash, sign a storage lease, or use a third-party-owned power purchase agreement, where a developer owns the system and the host simply pays for the savings it delivers. Payback typically lands in the 3–7 year range, depending on local demand-charge structure. For the full ROI math, see our guide to C&I BESS economics.
- Utility-scale projects, by contrast, raise money as standalone infrastructure assets. Developers combine tax equity, debt from infrastructure lenders, and a long-term PPA that underwrites the debt. Because no single host’s bill defines success, the economics depend on wholesale market forecasts and interconnection terms. Investment horizons commonly run 10–15+ years. For the full framework on calculating storage ROI, see our guide to the economics of BESS.
Permitting complexity follows the same pattern. C&I projects mainly clear local and municipal review. Utility-scale projects, however, add environmental review, land-use approval, and formal interconnection studies on top.
C&I vs Utility-Scale: Which One Fits Your Project?
The right category isn’t really a choice. It follows from the problem you’re solving.
- If the goal is to lower one facility’s bill, add resiliency, or manage demand charges, C&I is the answer — sized and controlled around that facility’s own load and tariff.
- If the goal is to earn revenue by selling power or grid services into the wholesale market, utility-scale is the answer — sited and interconnected as a standalone power plant.
Some organizations pursue both. For example, a large industrial company might install a C&I system at its own plant while also investing in a utility-scale project as a corporate PPA offtaker. Either way, the two remain distinct engineering and financial exercises, even inside the same company.
| Key Takeaways: C&I vs Utility-Scale The C&I vs utility-scale decision starts with one question: is there a load behind the meter? If yes, the project is C&I. If no, it’s utility-scale. Everything else — voltage, control strategy, financing, and interconnection — follows from that single fact.Sunlith Energy reviews incoming cell test data, matching tolerances, and pack assembly quality control for BESS projects from 50 kWh upward. Contact us before you finalize a cell or pack supplier. |
C&I vs Utility-Scale FAQs
Is a community solar project C&I or utility-scale?
Community solar projects behave more like small utility-scale assets. They interconnect to the distribution grid and sell subscriptions, rather than serving one host’s load. That said, they’re usually smaller — 1–5 MW — than a traditional utility-scale plant.
Can a C&I battery ever sell power back to the grid?
Some C&I systems do join demand response or limited export programs. Even so, their main job stays the same: cut the host facility’s own costs. That’s what separates them from front-of-the-meter assets built mainly to sell power.
Does utility-scale mean the utility owns it?
Not necessarily. Independent power producers and investment funds own many utility-scale plants. They simply sell power to a utility or corporate buyer under a PPA. In other words, the term describes the scale and grid connection point, not the owner.
Why do C&I projects move faster than utility-scale projects?
C&I systems interconnect at lower voltage through a simpler utility process. They usually skip new transmission infrastructure entirely. As a result, they avoid the multi-year interconnection queues that utility-scale projects face at the transmission level.
Is project size or the meter connection the real dividing line?
The meter connection decides it. A large facility with tens of megawatt-hours of storage still counts as C&I, because a load sits behind the connection. A small dedicated battery plant on a remote substation still counts as utility-scale, because no load does.
Related Resources
C&I BESS Cluster
- Key Components of a Commercial & Industrial (C&I) BESS
- How C&I BESS Peak Shaving Lowers Demand Charges for Businesses
- Understanding the Economics of C&I BESS Deployment
- C&I BESS Case Studies: Proven Success in Commercial & Industrial Applications
- Top Applications of Commercial & Industrial Battery Energy Storage Systems
- How EPCs Can Partner with Battery Integrators for C&I Energy Projects
Utility-Scale Cluster
- Understanding Utility-Scale BESS: The Backbone of a Resilient Energy Future
- BESS Grid-Forming: The Architecture Stabilising Tomorrow’s Grid
- Grid Forming vs Grid Following BESS: What Is the Difference?
- Comprehensive Guide to a 100MW/250MWh BESS with Solar Integration and Grid Connection
Shared Technical & Economic Foundations
- Understanding BESS Specifications: The Complete Guide
- The Economics of BESS: A Practical Guide to Calculating ROI
- Microgrid BESS: The Complete Technical Guide
- What is Energy Storage PCS? Complete Guide for BESS Applications
Other References
- NFPA 855: Standard for the Installation of Stationary Energy Storage Systems — The primary U.S. fire code for stationary energy storage.
- FERC: Generator Interconnection Rules and Procedures — Details on federal rules and the “first-ready, first-served” cluster study model.

Cell Temperature Gradients in BESS: Safe ΔT Limits and What Causes Uneven Heating
| ⚡ Quick Answer: What Is a Safe Temperature Gradient in a BESS Pack? A temperature gradient is the difference in temperature between the hottest and coolest cells in a pack at the same moment, often written as ΔT. Many BESS specifications target a maximum gradient of around 5°C across a rack, with premium liquid-cooled systems aiming closer to 2-3°C. A larger temperature gradient does not just mean one hot spot. It means cells are aging at different rates within the same pack, which widens the performance gap that cell matching worked to close in the first place. |
1. Why Temperature Uniformity Is a Different Problem Than Cooling Capacity
Choosing between air and liquid cooling answers one question: how much heat can the system remove overall. It does not answer a second, separate question, however: does that heat leave every cell at the same rate? A BESS can have more than enough total cooling capacity. Even so, it can still run a large temperature gradient, if heat leaves some cells faster than others.
This distinction matters because gradient problems do not always show up as an overheating alarm. A pack can sit comfortably within its overall safe temperature range. Meanwhile, one corner of the rack quietly runs several degrees hotter than another, cycle after cycle. Nothing trips. Nothing alarms. The pack simply ages unevenly, and nobody notices until the SOH numbers start to diverge.
2. What Counts as a Safe Temperature Gradient
Exact gradient limits vary by manufacturer, cell chemistry, and system design. As a result, treat any single number as a target to verify, not a universal rule. That said, a few reference points are commonly cited in BESS specifications.
- Around 5°C maximum cell-to-cell gradient is a commonly specified ceiling for air-cooled and moderately cooled BESS racks.
- 2-3°C is a tighter target that premium liquid-cooled systems often aim for, particularly at utility scale, where thousands of cells raise the stakes of even small mismatches.
- Gradient limits typically apply within a single rack or module first. They then get checked again at the full-system level, since gradients between racks can run larger than gradients within one rack.
Ask your supplier for their specific gradient target, not just their overall operating temperature range. A wide operating range, such as -20°C to 55°C, says nothing about how tightly matched cell temperatures stay relative to each other inside that range.
3. Three Root Causes of Uneven Cell Heating
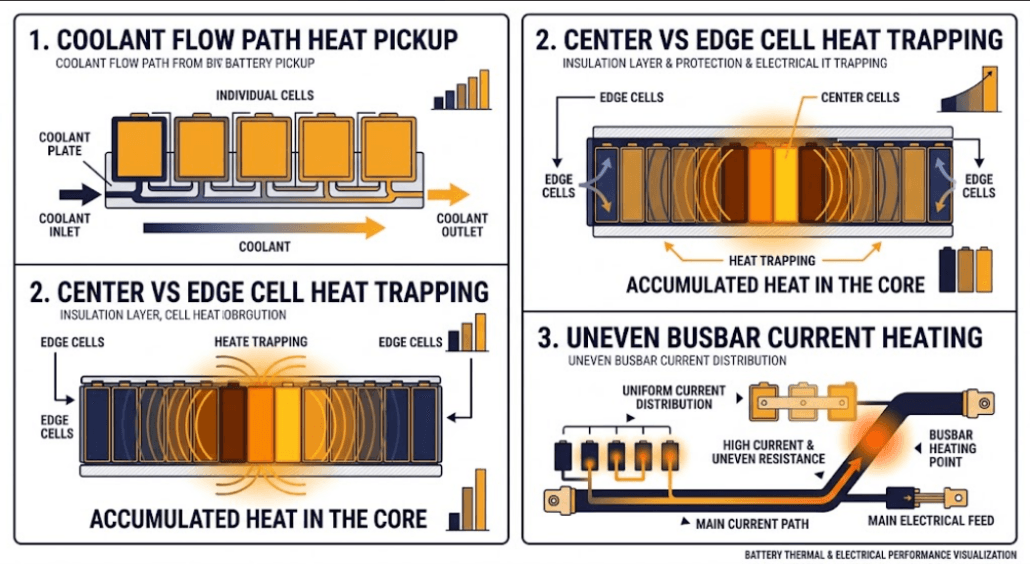
Temperature gradients rarely come from one single cause. Instead, three factors typically combine to create them.
Coolant Path Position
In a liquid-cooled rack, coolant usually enters at one point and exits at another, picking up heat along the way. Cells nearest the coolant inlet sit in cooler fluid. Cells nearest the outlet, by contrast, sit in fluid that has already absorbed heat from cells earlier in the path. As a result, outlet-side cells often run measurably warmer than inlet-side cells. This happens purely because of their position in the flow path, not because of anything different about the cells themselves.
Cell Position Within the Pack
Cells near the edge of a rack or enclosure sit closer to the outside walls, where some heat escapes to the surrounding air. Cells buried in the center of a dense pack, on the other hand, have neighbors on every side, so that heat has fewer places to go. Center cells, therefore, often run hotter than edge cells, even under identical cooling and identical current.
Current Path and Busbar Resistance
Current does not always split perfectly evenly across parallel cell groups. Small differences in busbar length, connection quality, or contact resistance mean some current paths carry slightly more current than others. Since heating from resistance follows I²R, even a small current imbalance produces a disproportionate heating difference. This connects directly to internal resistance variation covered in our cell matching guide: cells or groups with higher resistance generate more heat at the same current. As a result, a resistance mismatch and a temperature gradient often reinforce each other.
4. How a Temperature Gradient Accelerates Divergent Aging
Battery aging reactions speed up with heat. Researchers publishing in PMC (National Center for Biotechnology Information) found that inhomogeneous cell temperature inside a pack is a real, measurable driver of uneven degradation, not just a theoretical concern. Applied to a pack with a real gradient, this means the hottest cells are not just uncomfortable. They are quietly aging faster than their cooler neighbors, cycle after cycle.
This is where uneven heating and cell matching intersect. A pack that started out well matched, as covered in our cell matching guide, can still drift apart over time. A persistent hot zone can push those cells toward faster capacity fade. Meanwhile, cooler cells barely age at all. The BMS then has to work harder to compensate for a gap that thermal design, not manufacturing variance, actually created.
Cold cells create a different problem. Below their optimal range, cells deliver less power. They also accept slower charge rates. In practice, this means the coolest cells in a pack can become the limiting factor for dispatch power. This happens even though they are aging the slowest of anyone in the rack.
5. How the BMS Responds to What It Can Actually See
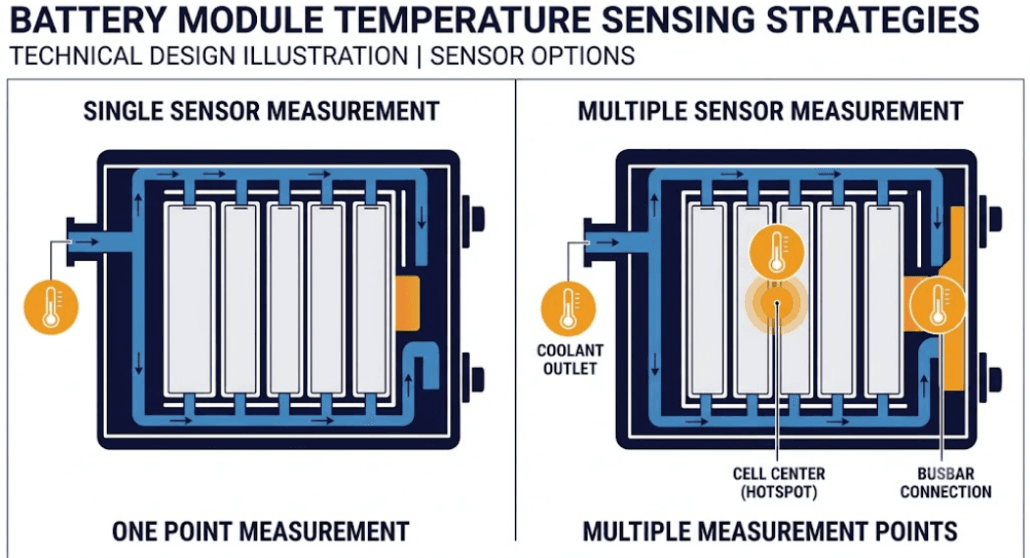
A BMS cannot manage a gradient it cannot measure. Sensor placement, therefore, matters as much as sensor accuracy. A design with one temperature sensor per module, placed at a single convenient point, will miss gradients happening between that sensor’s location and the rest of the module.
More thorough designs, instead, place multiple sensors per module. These sit at known high-risk points — near coolant outlets, at pack centers, and at busbar connections. This ties directly into the safety diagnostic algorithms covered in our BMS algorithms guide, since a BMS can only flag a developing hot spot if a sensor actually sits close enough to detect it before the gradient becomes a real problem.
6. Questions to Ask Your Supplier
- What is your specified maximum cell-to-cell temperature gradient, not just the overall operating temperature range?
- How many temperature sensors does each module have, and where are they physically placed?
- For liquid-cooled systems, what is the coolant flow path? What gradient exists between inlet-side and outlet-side cells?
- Do you have field or test data showing SOH divergence between hot-zone and cool-zone cells over time?
- How does the BMS respond if a persistent gradient develops? Does it just log the data, or does it adjust balancing or dispatch limits?
Conclusion: A Temperature Gradient Is a Slow Problem That Looks Like No Problem at All
Overheating alarms are easy to notice. Temperature gradients, however, are not. A pack can run entirely within its safe range. It can still age unevenly, cell by cell. Nobody measured the gradient closely enough to see it. Ask suppliers for their specific gradient limit, not just their operating range. Then ask how many sensors actually watch for it.
For the manufacturing-stage half of this problem — how mismatched cells enter a pack in the first place — see our cell matching guide. Matching and thermal design solve two different sources of the same underlying issue: cells in one pack quietly drifting apart from each other over time.
| ☀️ Need a Thermal Design Review for Your BESS Project? Sunlith Energy reviews cooling architecture, sensor placement, and gradient specifications for BESS projects from 50 kWh upward. Contact us before you finalize a thermal design. |
Frequently Asked Questions About Cell Temperature Gradients
What is a temperature gradient in a battery pack?
A temperature gradient is the difference between the hottest and coolest cell temperatures in a pack at the same moment, usually written as ΔT. It is a separate measurement from the pack’s overall operating temperature range. That is because a pack can sit within a safe range overall while still having a large gap between its warmest and coolest cells.
What causes temperature gradients inside a BESS pack?
Three factors typically combine to cause gradients. Coolant path position matters, since cells near a coolant outlet run warmer than cells near the inlet. Cell position within the pack matters too, since center cells trap more heat than edge cells. Finally, uneven current distribution from busbar resistance differences creates uneven I²R heating across parallel cell groups.
How does uneven heating affect cell aging?
Hotter cells within a gradient age faster than cooler cells in the same pack, since battery degradation reactions speed up with heat. Over time, this can widen the performance gap between cells, even in a pack that started out well matched. As a result, the BMS ends up compensating for a gap that thermal design created, rather than manufacturing variance.
What is a safe temperature gradient for a BESS pack?
Exact limits vary by manufacturer and system design. However, a maximum gradient of around 5°C is commonly specified for air-cooled and moderately cooled systems, while premium liquid-cooled systems often target 2-3°C. Always confirm the specific figure with your supplier rather than assuming a standard number applies.
How many temperature sensors does a BESS module need?
There is no single universal number. Still, a module with only one sensor at a single convenient location cannot detect a gradient occurring elsewhere in that module. More thorough designs, therefore, place multiple sensors at known high-risk points, such as near coolant outlets, pack centers, and busbar connections.
Further Reading
- Battery Management System (BMS) Explained — the complete guide to what a BMS does, architecture, and certifications.
- Liquid vs Air Cooling in BESS — how to choose a cooling method, before worrying about gradients within it.
- C&I BESS Thermal Management — the broader thermal management picture for commercial and industrial BESS.
- Understanding BESS Specifications — where temperature uniformity fits into the full spec sheet.
- Cell Matching Before Pack Assembly — the manufacturing-stage counterpart to this article
- BMS Algorithms Explained — how SOH, SoP, and safety diagnostics use the sensor data this article discusses
Cell Matching Before Pack Assembly: Why It Matters Before the BMS Ever Balances a Cell
| ⚡ Quick Answer: What Is Cell Matching? Cell matching is the process of sorting battery cells by voltage, capacity, and internal resistance before they go into a pack, so cells with similar characteristics end up grouped together. It happens on the factory floor, before assembly. This is not the same thing as BMS balancing, which corrects drift after the pack is already built and in use. Skipping cell matching does not make a pack unsafe by itself, since the BMS still protects it. However, it does mean the BMS has to work much harder from day one. As a result, the pack’s real-world capacity and cycle life will likely fall short of what the cell datasheet promises. |
1. Why Cell Matching Happens Before the BMS Gets Involved
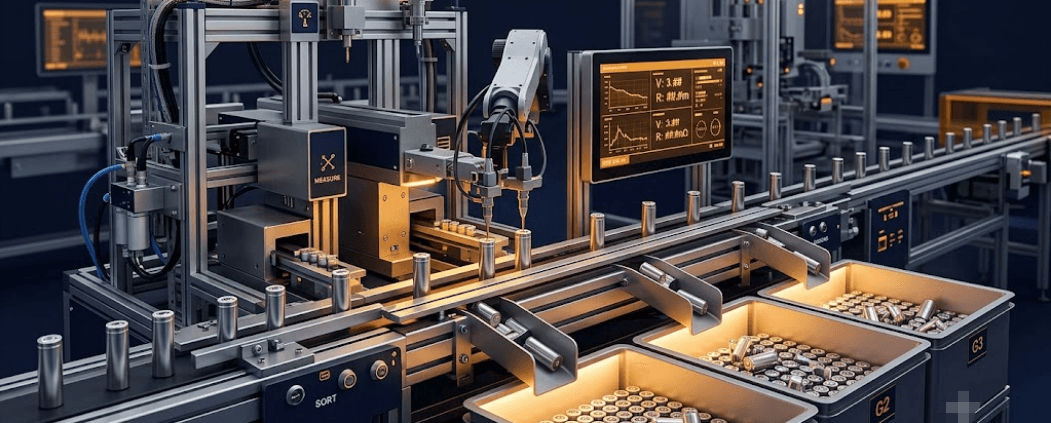
Cell matching is a manufacturing step that happens before a single cell ever reaches a pack. Even cells from the same production batch are not identical. Small differences in electrode coating thickness, electrolyte fill, and formation cycling leave every cell slightly different. Capacity, voltage, and internal resistance all vary a little, even when the datasheet lists one number for all of them. In a single cell, this variation does not matter. Once dozens or hundreds of cells connect into a pack, though, it matters a great deal.
The BMS will eventually correct some of this drift through balancing, as covered in our complete battery management system guide. Cell matching, however, happens earlier. It is a manufacturing step, not a BMS function, and it exists to reduce how much correction the BMS has to do later.
2. Three Criteria Used to Sort Cells: Voltage, Capacity, and Resistance
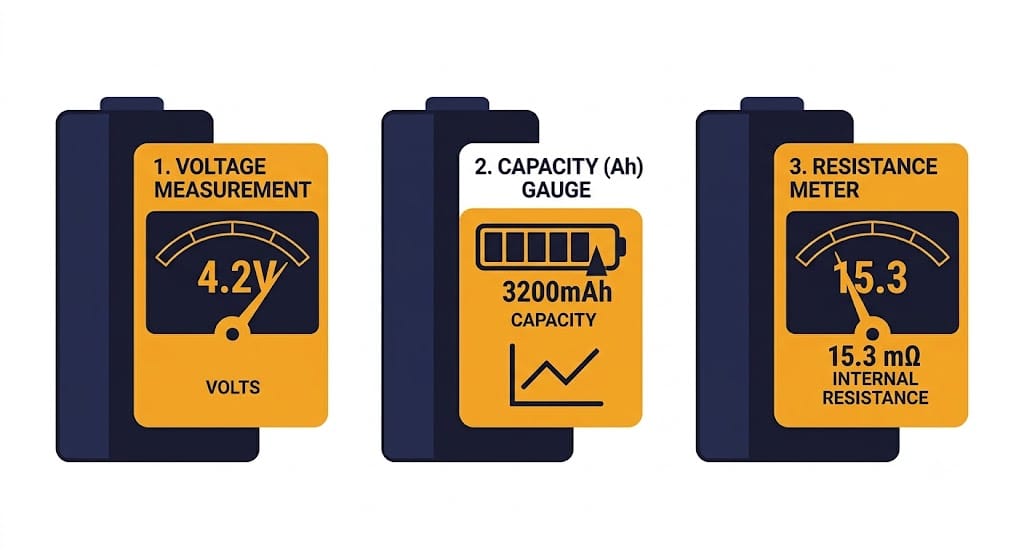
Cell matching typically screens for three characteristics. Each one affects the pack differently. As a result, a thorough process checks all three rather than relying on just one.
- Voltage (or SOC) matching — technicians group cells by their resting voltage after a defined charge or discharge point. This is the simplest check to run. It also catches the most obvious mismatches quickly.
- Capacity matching — technicians charge and discharge test each cell to measure actual usable Ah, then group cells with similar capacity together. This matters most for series strings, since the lowest-capacity cell sets the ceiling for the whole string.
- Internal resistance matching — technicians measure resistance using one of two methods, DCIR or ACIR, then group similar-resistance cells into the same parallel group. This matters most for parallel groups, since a lower-resistance cell otherwise takes more than its fair share of current.
High-volume manufacturers often combine all three, and internal resistance testing itself splits into two distinct methods worth understanding.
DCIR vs ACIR: Two Ways to Measure Internal Resistance
DCIR (DC internal resistance) testing applies a current pulse to the cell and measures the resulting voltage drop. Technicians then calculate resistance directly from Ohm’s law. This method closely reflects how the cell behaves under a real load, since it uses an actual current step rather than a small signal. The tradeoff is speed: each pulse needs time to apply and settle, which slows down high-volume sorting.
ACIR (AC internal resistance) testing instead applies a small alternating current signal, commonly at 1 kHz, and reads the resulting impedance directly. This method runs much faster than DCIR, which is why many production sorting lines use it as a first-pass screen. However, ACIR mostly captures the cell’s high-frequency ohmic resistance. It does not fully capture the slower electrochemical charge-transfer resistance that DCIR testing reveals.
In practice, many manufacturers use ACIR for fast first-pass screening across an entire incoming batch, then apply DCIR pulse testing to verify cells before they go into the same series string or parallel group. A supplier who only mentions one of these two methods is likely doing the faster, less thorough version alone.
3. Series Strings vs Parallel Groups: Different Priorities
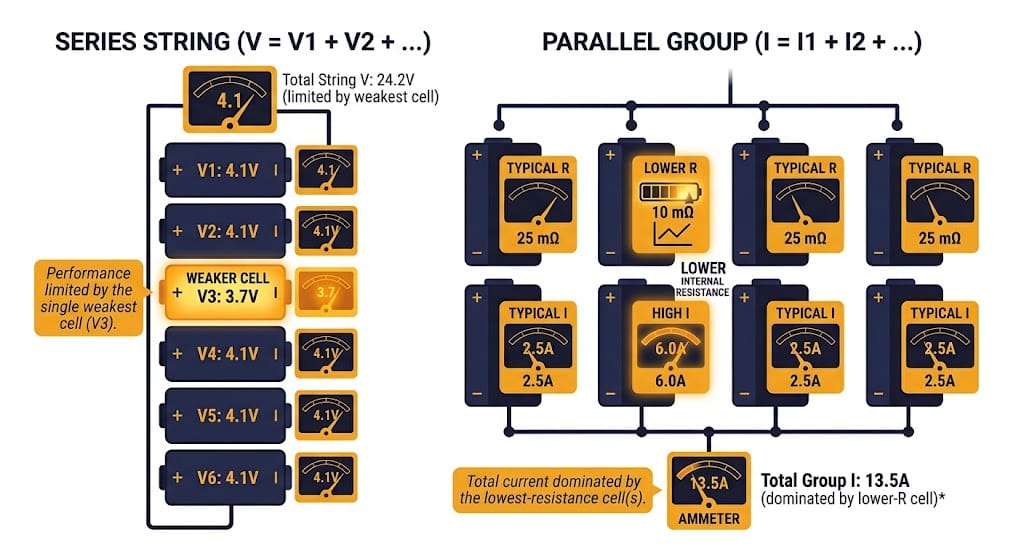
Series and parallel connections fail differently when cells are mismatched. For this reason, they need different matching priorities.
In a series string, cells share the same current, but their voltages differ based on individual state. The weakest cell — the one with the lowest capacity — reaches its low-voltage cutoff first during discharge. Likewise, it hits its high-voltage cutoff first during charge. As a result, that one weak cell limits the usable capacity of the entire string. This happens even though the other cells still have energy left. This is why capacity matching matters most for series strings.
In a parallel group, cells share the same voltage, but current splits between them based on internal resistance. A cell with lower resistance pulls more current than its neighbors. In turn, it works harder and ages faster. Over time, that uneven current sharing can widen the resistance gap further, creating a feedback loop. Left unchecked, this loop drives localized accelerated aging in the same cells, cycle after cycle. That localized wear is what leads to premature pack failure, well before the rest of the pack reaches end of life. For a buyer, that translates directly into a shorter calendar life and a worse return than the datasheet cycle life implied. This is why resistance matching matters most for parallel groups.
| ☀️ Resistance matching matters most for parallel groups. 💡 The Thermal Feedback Loop: Internal resistance mismatch and localized heating reinforce one another. For a deeper look at how temperature imbalances accelerate this degradation, read our guide on Cell Temperature Gradients in BESS |
4. What Happens If You Skip Cell Matching
Skipping cell matching does not make a pack dangerous on its own. A properly designed BMS still enforces voltage and temperature limits, regardless of how well matched the cells are. What changes, instead, is how hard the BMS has to work, and how much capacity the pack actually delivers.
If cells arrive at noticeably different SOC and go into a pack without matching, the BMS must run a large initial balancing pass. This happens the first time the pack charges. Passive balancing currents are typically small — often just tens to a few hundred milliamps — compared to the pack’s full Ah rating. Correcting a large initial mismatch this way can take many hours. In some cases, it takes several charge cycles before the pack reaches a properly balanced state.
Beyond the slow start, an unmatched pack often never fully closes the gap. If capacity variation between cells is large enough, ongoing balancing keeps the weakest cell from falling further behind. Still, balancing cannot manufacture capacity that a weak cell simply does not have. The pack’s usable capacity, therefore, ends up set by its weakest link, cycle after cycle.
5. Top-Balance vs Bottom-Balance: Which Comes First
When manufacturers match cells by connecting them in parallel before final assembly, the SOC point at which this happens changes the outcome.
Bottom-balance matching connects cells in parallel at a low SOC, often close to how they arrive from the manufacturer. This approach is simple and fast. However, it only aligns the cells at the bottom of the charge curve. The pack will likely still need a top-of-charge balancing pass once assembled and charged for the first time.
Top-balance matching, instead, charges the parallel-connected cells to a high SOC before final assembly, typically near the top of the charge curve. This produces a better-aligned pack from the first charge. That is because the region where mismatch matters most for safety and full capacity gets addressed early. The tradeoff is time: bringing a large batch of cells to a matched high-SOC state takes more equipment and more hours before assembly can begin.
6. Cell Matching at Scale: How Manufacturers Grade Cells for Utility BESS
At utility scale, matching thousands of cells by hand is not practical. Instead, high-volume manufacturers run automated sorting lines. These measure voltage, capacity, and resistance for every incoming cell. Grading software then groups cells into matched sets before they ever reach the assembly line.
For a BESS buyer, this raises a practical question worth asking directly: does the supplier grade and match cells before assembly, or does the pack rely entirely on the BMS to fix mismatch after the fact? Independent testing resources such as Battery University document just how differently DCIR and ACIR readings can diverge on the same cell, which is exactly why asking a supplier which method they use, and at which stage, is worth doing directly.
A supplier who can show incoming cell test data is doing meaningfully more quality control than one who simply points to their BMS’s balancing feature. Look, in particular, for a specific matching tolerance — for example, a defined percentage spread in capacity, or a defined milliohm band in resistance.
7. Questions to Ask Your Cell or Pack Supplier
- Do you test and match cells by voltage, capacity, and internal resistance before assembly, or only one of these?
- For internal resistance, do you use DCIR, ACIR, or both — and at which stage does each method apply?
- What matching tolerance do you use? For example, what percentage spread in capacity, or what milliohm band in resistance?
- Do you keep incoming cell test data on file? Can you provide it for the specific batch used in our order?
For series strings, how do you decide which cells go together — capacity, resistance, or both? Our BMS algorithms guide covers how the BMS itself later measures DCIR for SOH estimation, which is a useful comparison point when you ask this question.
- Is matching done at a low SOC, a high SOC, or both, before final assembly?
Conclusion: Matching Sets the Ceiling the BMS Can’t Raise
A BMS is very good at correcting small, ongoing drift between cells. It is not designed, however, to compensate for a pack that started out badly mismatched. Cell matching before pack assembly sets the baseline the BMS then has to maintain for the life of the system. A well-matched pack lets the BMS do its normal job: fine-tuning small differences over time. A poorly matched pack, by contrast, forces the BMS into a losing battle against a gap it cannot close, cycle after cycle.
When evaluating a cell or pack supplier, ask specifically how they match cells before assembly, including whether they use DCIR, ACIR, or both. Do not just ask how the BMS balances them afterward. For supplier evaluation more broadly, see our BESS supplier BMS evaluation guide. The cell matching answer says a lot about how much real capacity and cycle life you can expect to see in practice.
| ☀️ Need Help Evaluating a Cell Matching Process? Sunlith Energy reviews incoming cell test data, matching tolerances, and pack assembly quality control for BESS projects from 50 kWh upward. Contact us before you finalize a cell or pack supplier. |
Frequently Asked Questions About Cell Matching
Is cell matching the same as BMS balancing?
No. Cell matching happens before assembly. It is a manufacturing step that sorts cells by voltage, capacity, and internal resistance, so similar cells end up grouped together. BMS balancing, on the other hand, happens after assembly, correcting the small drift that develops during normal use. Matching reduces how much balancing the BMS has to do; it does not replace it.
What is the difference between DCIR and ACIR matching?
DCIR testing applies a current pulse and calculates resistance from the voltage drop using Ohm’s law, closely reflecting real load behavior. ACIR testing applies a small AC signal, commonly at 1 kHz, and reads impedance directly, which runs much faster but mostly captures high-frequency ohmic resistance rather than the full picture. Many manufacturers use ACIR for fast first-pass screening, then confirm with DCIR before final grouping.
What is the difference between capacity-based and resistance-based sorting?
Capacity-based sorting groups cells with similar usable Ah, and matters most for series strings, since the lowest-capacity cell sets the ceiling for the whole string. Resistance-based sorting, by contrast, groups cells with similar internal resistance, and matters most for parallel groups, since a lower-resistance cell will otherwise pull more than its fair share of current.
Does skipping this step make a battery pack unsafe?
Not directly. A properly designed BMS still enforces voltage and temperature limits, no matter how well the cells were matched. That said, skipping this step does mean the BMS must run a larger initial balancing pass. In turn, the pack’s real-world capacity may fall short of the datasheet value, since the weakest cell limits the whole pack.
Should I ask my BESS supplier for this test data?
Yes. Ask whether the supplier tests and matches cells by voltage, capacity, and internal resistance before assembly, and which resistance method they use. A supplier who can provide incoming cell test data for your specific batch is demonstrating a real quality control process, not just relying on the BMS to compensate after the fact.
Is top-balance or bottom-balance better?
Top-balance, which aligns cells at a high SOC before assembly, generally produces a better-aligned pack from the first charge. That is because it addresses the top-of-charge region where mismatch matters most. Bottom-balance is faster, but the pack will likely still need a top-of-charge balancing pass once assembled.